. 2013 Mar;14(3):281-9.
doi: 10.1038/ni.2523. Epub 2013 Jan 20.

Transcriptional reprogramming of mature CD4⁺ helper T cells generates distinct MHC class II-restricted cytotoxic T lymphocytes

Affiliations

Transcriptional reprogramming of mature CD4⁺ helper T cells generates distinct MHC class II-restricted cytotoxic T lymphocytes

Daniel Mucida et al. Nat Immunol. 2013 Mar.

Abstract

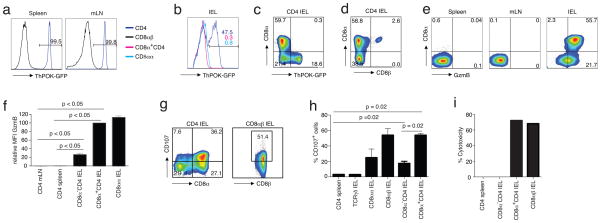
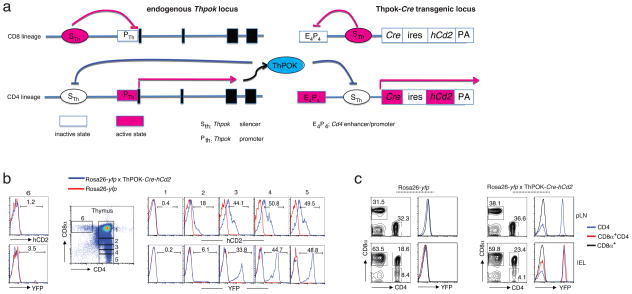
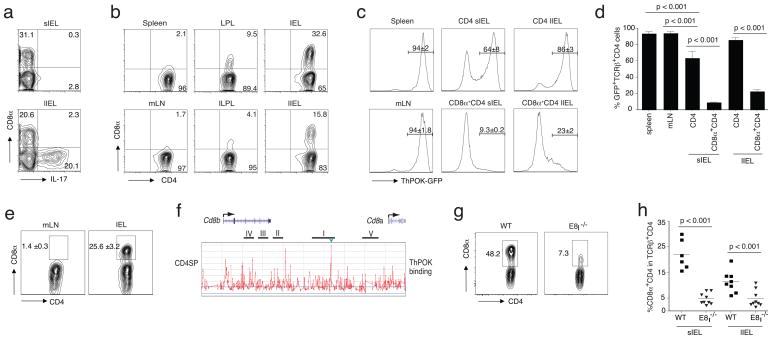
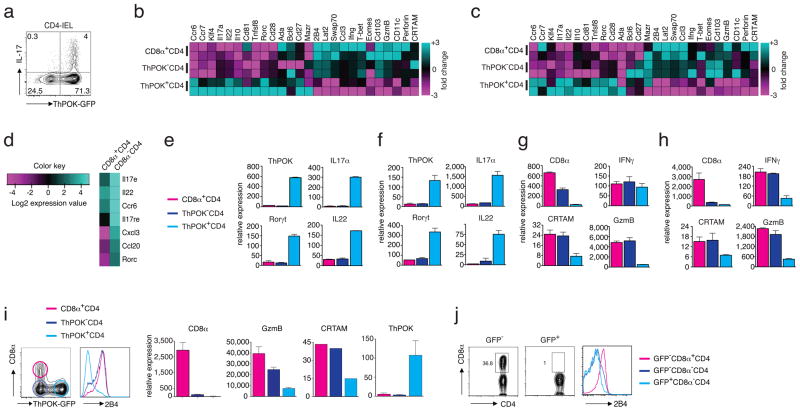
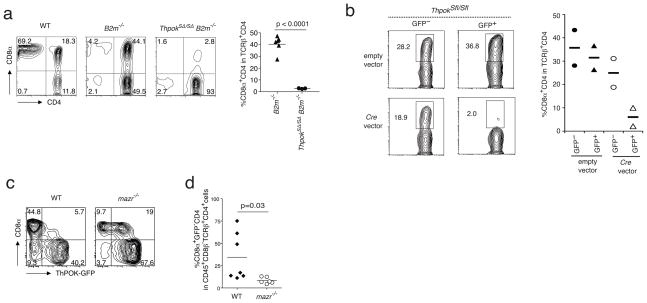
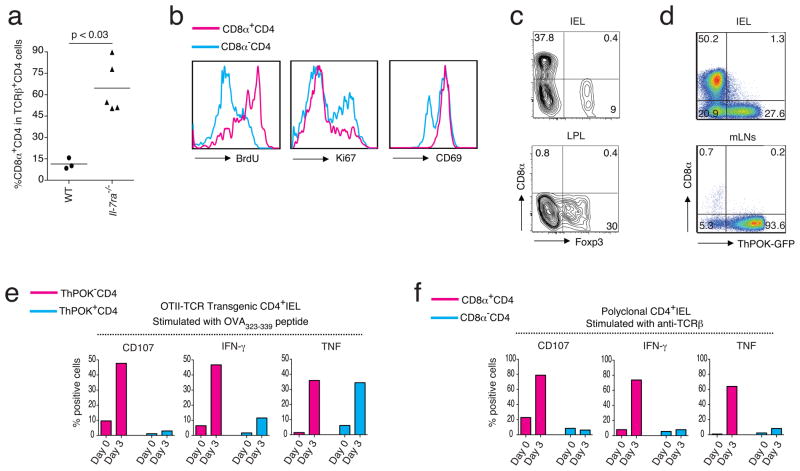
TCRαβ thymocytes differentiate into either CD8αβ(+) cytotoxic T lymphocytes or CD4(+) helper T cells. This functional dichotomy is controlled by key transcription factors, including the helper T cell master regulator ThPOK, which suppresses the cytolytic program in major histocompatibility complex (MHC) class II-restricted CD4(+) thymocytes. ThPOK continues to repress genes of the CD8 lineage in mature CD4(+) T cells, even as they differentiate into effector helper T cell subsets. Here we found that the helper T cell fate was not fixed and that mature, antigen-stimulated CD4(+) T cells terminated expression of the gene encoding ThPOK and reactivated genes of the CD8 lineage. This unexpected plasticity resulted in the post-thymic termination of the helper T cell program and the functional differentiation of distinct MHC class II-restricted CD4(+) cytotoxic T lymphocytes.


Conflict of interest statement

Competing Interests statement.

The authors declare no competing financial interests.

Figures

Figure 1
Figure 1
Some mature CD4 T cells do not maintain ThPOK expression in the periphery. (a) Frequency of GFP positive cells among gated CD45+TCRβ+ lymphocytes isolated from the spleen and mLN of naïve ThPOK-gfp reporter mice. (b) Frequency of GFP positive cells among gated CD45+TCRβ+ lymphocytes isolated from the small intestine epithelium of naïve ThPOK-gfp reporter mice. Data in a and b are representative of 2 independent experiments, n = 4 or 5 mice. (c) Cell surface staining for CD8α and GFP expression in gated CD45+TCRβ+CD8βCD4+ IELs as in (b). (d) Cell surface staining for CD8α and CD8β expression in gated CD45+TCRβ+CD4+ IELs as in (b). (e) Cell surface staining for CD8α and intracellular for Granzyme B in gated CD45+TCRβ+CD8βCD4+ lymphocytes isolated from spleen, mLN and sIELs of naïve WT B6 mice. Values in plots indicate percent positivity (f) MFI for Granzyme B expression by CD4+, CD8α+CD4+ or CD8αα+ T cells in gated CD45+TCRβ+CD8β lymphocytes from different tissues of naïve wild type B6 mice. Data in c–f are representative of 3 independent experiments, n = 4 or 5 mice. ANOVA and Bonferroni as post test were used for statistics (g) Frequency of CD107 positive cells among total gated CD45+TCRβ+CD8βCD4+- and CD45+TCRβ+CD8αβ+ IELs after anti-TCRβ stimulation. Representative data of 4 independent experiments. Values indicate percent positivity (h) Frequency of CD107 expressing CD4+ splenocytes or TCRγδ+-, CD8αα+-, CD8αβ+-, CD8α- and CD8α+CD4+ IEL subsets after anti-TCRβ stimulation. Data are representative of 4 independent experiments. Each bar shows standard error of the mean (SEM; n=4). Nonparametric two tailed Mann-Whiteny test was used for statistics (i) % cytotoxicity of respective lymphocyte subsets as measured by LDH release assay. Representative data of 4 independent experiments.
Figure 2
Figure 2
ThPOK mature CD4 T cells are progeny of ThPOK-expressing thymocytes. (a) A schematic presentation of the Thpok and the transgenic ThPOK-Cre locus in CD8- and CD4-lineage thymocytes. Red indicates “active” and white “inactive”. (b) Staining for CD4 and CD8α (dot plot), human CD2 and YFP (histograms) of thymocytes gated on CD4 and CD8α expression levels (gates 1–6) where 1 represents immature double-positive thymocytes and 5 and 6 represent mature, single-positive CD4 and CD8 thymocytes, respectively. Red histograms represent thymocytes from Rosa26-yfp mice and blue histograms from Rosa26-yfp x ThPOK-Cre-hCd2 mice. Values above histograms indicate percent positivity (c) Staining for CD4 and CD8α (contour plots) and YFP (histograms) of peripheral lymph node (pLN) and sIELs, gated on TCRβ+CD4+ lymphocytes isolated from the Rosa26-yfp (left)- or the Rosa26-yfp x ThPOK-Cre-hCd2 (right) mice. Values above histograms and in contour plots indicate percent positivity. Data in b and c are representative of at least 3 independent experiments.
Figure 3
Figure 3
ThPOK CD4 effector cells lose ThPOK as mature cells in the periphery. (a) CD8α and intracellular IL-17 staining of gated CD45+TCRβ+CD4+ small and large intestine IELs of Rag1−/−recipient mice 8 weeks after adoptive transfer of naïve TCRβ+CD8αCD45RBhighCD25CD4+ spleen T cells. Values in plots indicate percent positivity. (b) CD8α and CD4 staining of gated CD45+TCRβ+CD4+ T cells from various tissues of Rag1−/− recipient mice 8 weeks after adoptive transfer of naïve TCRβ+CD8αCD45RBhighCD25CD4 spleen T cells. Values in plots indicate percent positivity. (c) Thpok GFP expression in gated CD45+TCRβ+ -SP CD4+ or -DP CD8α+CD8βCD4+ lymphocytes isolated from various tissues of Rag1−/− recipient mice 8 weeks after transfer of sorted TCRβ+CD8αCD45RBhighCD25CD4+ spleen T cells from Thpok GFP donor mice. Values above histograms indicate mean±SEM percent positivity. Data in a–c are representative of 3 independent experiments. (d) Frequency of GFP+ cells in gated CD45+TCRβ+ -SP CD4+ or -DP CD8α+CD8βCD4+ lymphocytes from spleen, mLN or IELs of Rag1−/− recipients after transfer of sorted naïve TCRβ+CD8αGFP+CD45RBhighCD25CD4 spleen T cells from Thpok GFP donor mice. Data are representative of 3 independent experiments. ANOVA and Bonferroni as post test were used for statistics. Each bar shows the SEM (e) Surface Staining for CD8α on re-transferred sorted (> 99.7% purity) CD45+TCRβ+CD8αCD4+ donor IELs (from 3 pooled recipient mice) isolated from mLN and sIELs of a second Rag1−/−recipient 8 weeks after the second transfer. Values in plots indicate mean±SEM percent positivity. Data are representative of 2 independent experiments. (f) Chromatin immuno-precipitation (ChIP) with tiling array using CD4 SP thymocytes from the FH-ThPOK knock-in mice expressing FLAG-hemagglutinin epitope tagged ThPOK protein. Binding of ThPOK to the E8I region was marked with a green arrowhead. Data are representative of 2 independent experiments. (g) Frequency of CD8α positive CD45+TCRβ+CD8βCD4+ IELs isolated from wild type (left panel) and E8I-deficient (right panel) mice. Data are representative of 3 independent experiments, n = 4 or 5 mice. (h) Frequency of CD8α+CD4+ IELs from Rag1−/− recipient mice 8 weeks after transfer of wild type or E8I-deficient TCRβ+CD8α CD45RBhighCD25CD4+ spleen T cells.
Figure 4
Figure 4
Activated CD4 TH cells that lose ThPOK expression differentiate to CTL. (a) Intracellular IL-17 and GFP staining in gated CD45+TCRβ+CD4+ IELs from Rag1−/− recipient mice of Rag1−/− recipients that previously received sorted naïve TCRβ+CD8αGFP+CD45RBhighCD25CD4+ spleen T cells from ThPOK-gfp donor mice. Data are representative of 3 independent experiments. (b) Gene expression microarray analysis of mRNA from sorted CD45+TCRβ+-ThPOK+CD8αCD4+, -ThPOKCD8αCD4+ and ThPOKCD8α+CD4+ IELs of naïve ThPOK-gfp reporter mice. Each sample represents 2 independent experiments, sorting and duplicate microarray analyses (c) Gene expression microarray analysis of mRNA from sorted CD45+TCRβ+-ThPOK+CD8αCD4+, -ThPOKCD8αCD4+ and ThPOKCD8α+CD4+ IELs of Rag1−/− recipients that previously received sorted naïve TCRβ+CD8α GFP+CD45RBhighCD25CD4+ spleen T cells from ThPOK-gfp donor mice. Each sample represents 2 independent experiments, sorting and duplicate microarray analyses (d) Heat map of normalized gene expression levels of Th17 signature genes in donor CD4 T cells determined by microarray analysis as in (b). (e) Relative mRNA levels of Th17-associated genes from sorted T cell subsets as in (c). (f) Relative mRNA levels of Th17-associated genes from sorted T cell subsets as in (d). (g) Relative mRNA levels of CTL-associated genes from sorted T cell subsets as in (c). (h) Relative mRNA levels of CTL-associated genes from sorted T cell subsets as in (d). (i) ThPOK-GFP (left panel) and 2B4 (right panel) expression in gated CD45+TCRβ+CD4+ IELs as in (a). Relative mRNA expression of CD8α, Granzyme B, CRTAM and ThPOK in IELs sorted for (CD45+TCRβ+CD4+) GFP+, GFPCD8α, and GFPCD8α+ subsets isolated from 4 individual Rag1−/− recipients as in (a). Data are representative of 3 independent experiments. Gene expression was analyzed by quantitative real-time PCR and expressed relative to L32 as an internal standard. (j) Staining for CD4, CD8α (left and middle panels) and 2B4 (right panel) of gated TCRβ+CD4+ IELs from Rag1−/− recipients that previously received ThPOK-transfected (GFP+) or untransfected (GFP) TCRβ+CD8αCD45RBhighCD25CD4+ donor spleen T cells. Data are representative of 3 independent experiments, n = 3 mice.
Figure 5
Figure 5
The Thpok silencer forms the switch that terminates Thpok expression in mature CD4 T cells. (a) Staining for CD4 and CD8α expression on gated TCRβ+CD4+ sIELs isolated from naïve wild type,B2m−/− and ThpokSΔ/SΔ (Thpok silencer deletion) x B2m−/− mice. Plots are representative of 3 independent experiments, n = 2 or 3 mice. (b) Staining as in (a) gated on (GFP+ or GFP) sIELs isolated from Rag1−/−recipients 4–5 weeks after adoptive transfer of Cre-gfp-transfected TCRβ+CD4+ Thpok silencerflox/flox (ThpokSflox/Sflox) primary cells. Data are representative of 2 independent experiments. (c) Staining for GFP and CD8α expression on sIELs gated as in (a) and isolated from Rag1−/− recipients after transfer of sorted naïve TCRβ+CD8αGFP+CD45RBhighCD25CD4+ spleen T cells from wild type- and Mazr−/− ThPOK-gfp donor mice. Representative data of 3 independent experiments. (d) Frequency of CD8α+GFPCD4 sIELs as in (c). Data are representative of 3 independent experiments.
Figure 6
Figure 6
The ThPOK loss and reprogramming of CD4 CTL is an antigen-driven process in vivo. (a) Frequency of CD8α+CD4+ T cells in gated CD45+TCRβ+CD8βCD4+ IELs from wild type or Il-7ra−/− mice. Nonparametric two-tailed Mann-Whiteny test was used for statistics. (b) BrdU staining following an i.p. injection with 1 mg BrdU and 6 days of 0.8 mg/ml BrdU in the drinking water (left panel). Ki67 staining (middle panel) and CD69 staining (right panel) of CD8α+ or CD8α gated CD45+TCRβ+CD8βCD4+ IELs of naïve wild type mice. (c) Staining for CD8α and Foxp3 in gated CD45+TCRβ+CD8βCD4 IELs (upper panel) and LPL (lower panel) of OVA-specific OTII TCR transgenic Rag1−/− mice after 4 weeks of OVA-diet feeding. Representative data of 2 independent experiments, n = 4 mice per group. (d) Frequency of CD8α and GFP positive cells among CD45+TCRβ+ OT-II TCR ThPOK-gfp CD4+ IELs isolated from Rag1−/− recipient mice after 4 weeks of OVA-diet feeding. Data represents 5 independent experiments. (e) Frequency of CD107, IFNγ and TNFα positive cells in ThPOK(red) and ThPOK+ (blue) CD45+TCRβ+ OT-II TCR ThPOK-gfp CD4+ IELs as in (d) analyzed at day 0, without IL-15 exposure (red bars) or after 3 days in vitro culturing with rIL-15 (blue bars) prior to re-stimulation with OVA323-339 peptide. Data are representative of 3 independent experiments. (f) Frequency of CD107, IFNγ and TNF positive cells in CD8α+ (red) and CD8α (green) CD45+TCRβ+CD8βCD4+ polyclonal wild type IELs without or with IL-15 as in (e). Data are representative of 3 independent experiments.

Comment in

References

    1. Aliahmad P, Kadavallore A, de la Torre B, Kappes D, Kaye J. TOX is required for development of the CD4 T cell lineage gene program. J Immunol. 2011;187:5931–5940. - PMC - PubMed
    1. Hernandez-Hoyos G, Anderson MK, Wang C, Rothenberg EV, Alberola-Ila J. GATA-3 expression is controlled by TCR signals and regulates CD4/CD8 differentiation. Immunity. 2003;19:83–94. - PubMed
    1. Pai SY, et al. Critical roles for transcription factor GATA-3 in thymocyte development. Immunity. 2003;19:863–875. - PubMed
    1. He X, et al. The zinc finger transcription factor Th-POK regulates CD4 versus CD8 T-cell lineage commitment. Nature. 2005;433:826–833. - PubMed
    1. Sun G, et al. The zinc finger protein cKrox directs CD4 lineage differentiation during intrathymic T cell positive selection. Nat Immunol. 2005;6:373–381. - PubMed

Publication types

MeSH terms

Associated data