. 2013 Mar;14(3):271-80.
doi: 10.1038/ni.2518. Epub 2013 Jan 20.

Mutual expression of the transcription factors Runx3 and ThPOK regulates intestinal CD4⁺ T cell immunity

Affiliations

Mutual expression of the transcription factors Runx3 and ThPOK regulates intestinal CD4⁺ T cell immunity

Bernardo Sgarbi Reis et al. Nat Immunol. 2013 Mar.

Abstract

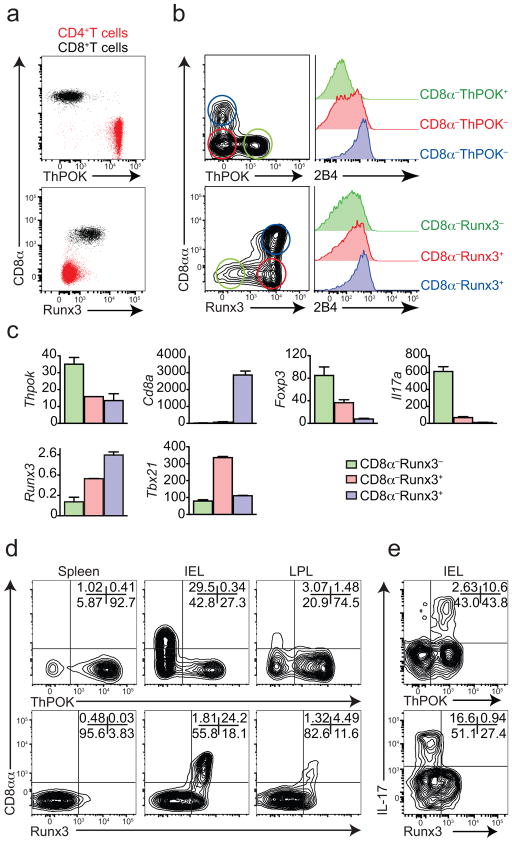
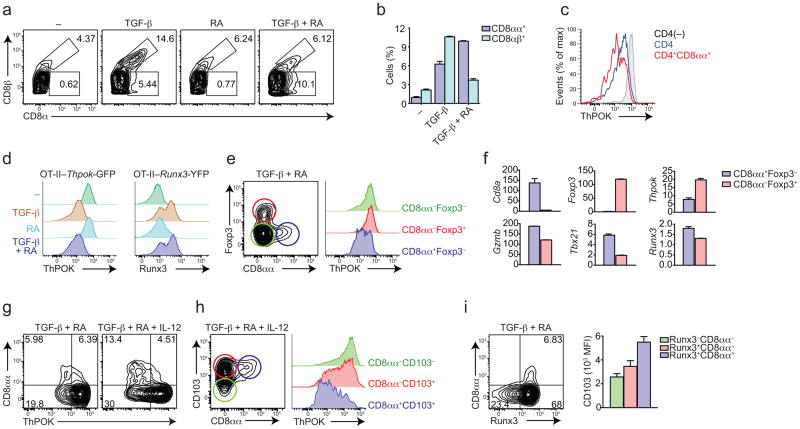
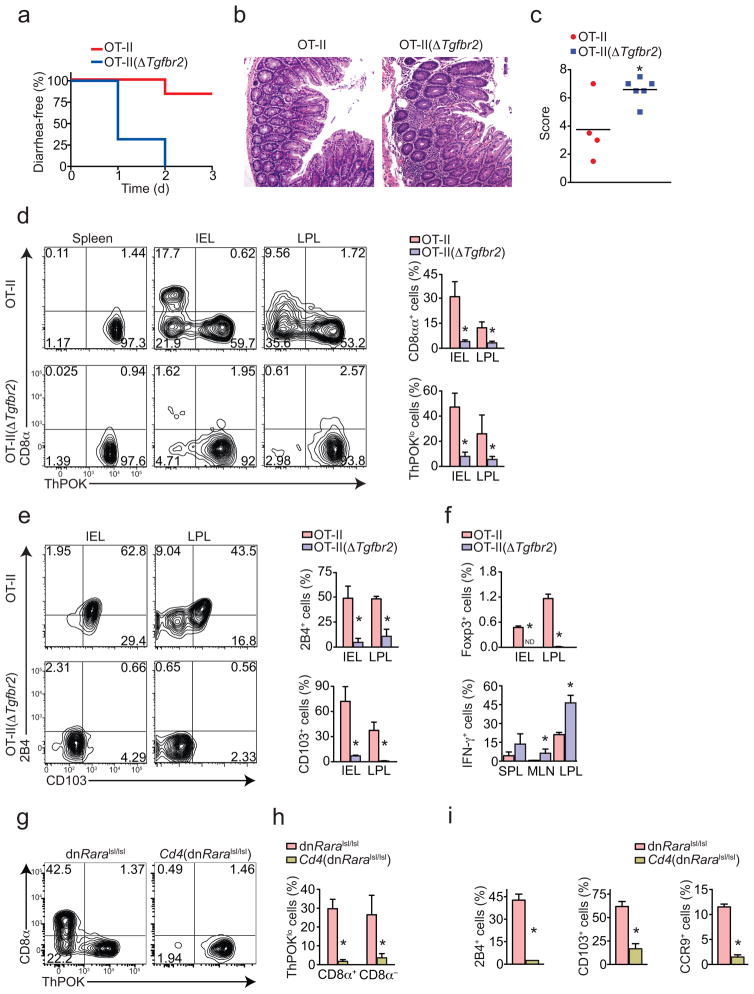
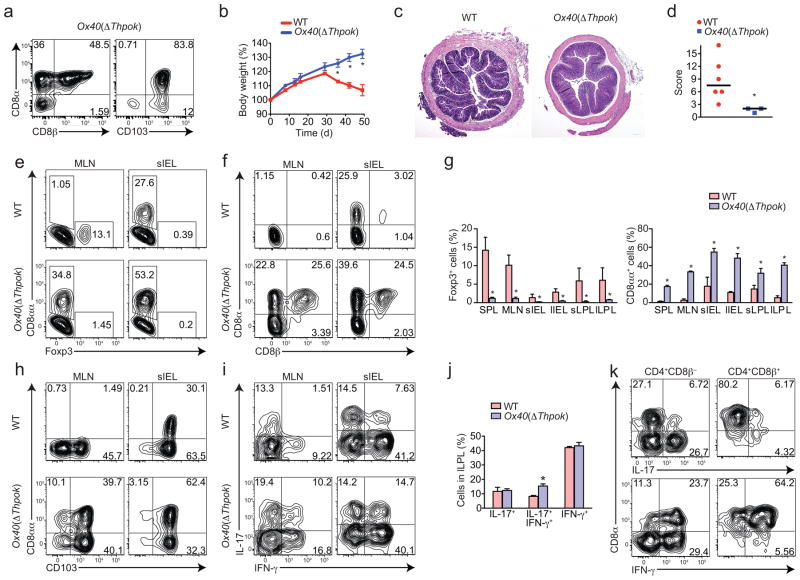
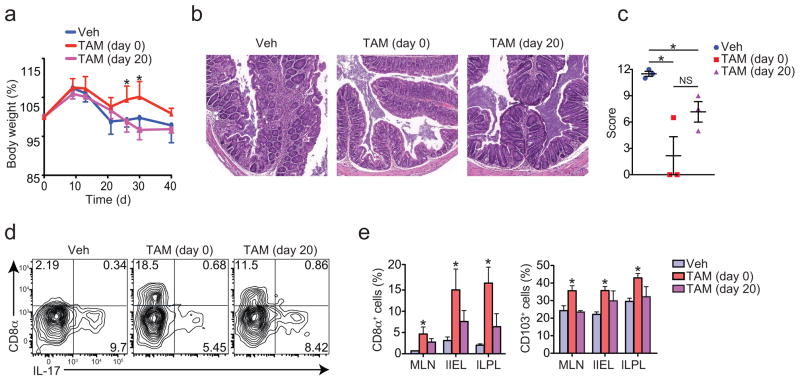
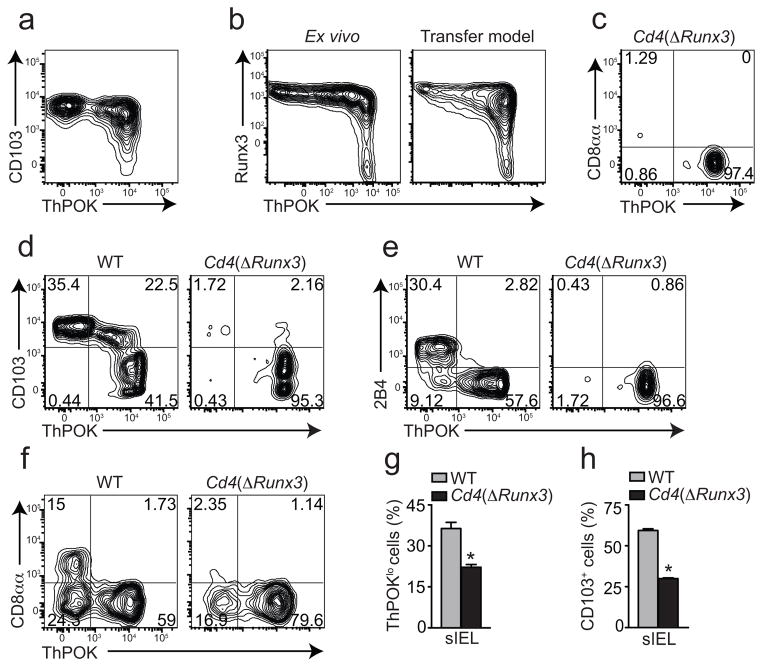
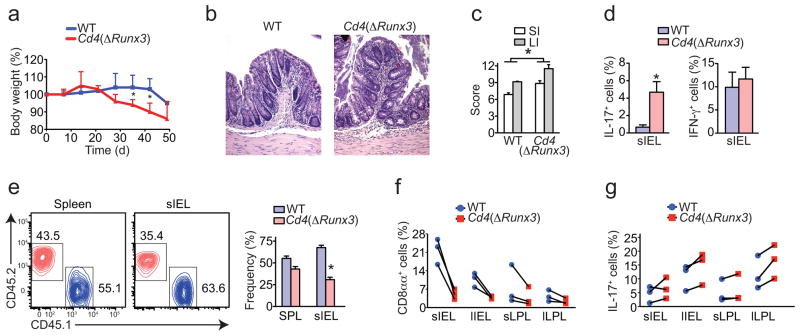
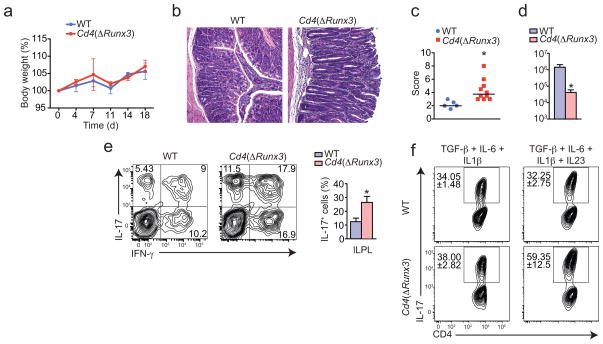
The gut mucosa hosts large numbers of activated lymphocytes that are exposed to stimuli from the diet, microbiota and pathogens. Although CD4(+) T cells are crucial for defense, intestinal homeostasis precludes exaggerated responses to luminal contents, whether they are harmful or not. We investigated mechanisms used by CD4(+) T cells to avoid excessive activation in the intestine. Using genetic tools to label and interfere with T cell-development transcription factors, we found that CD4(+) T cells acquired the CD8-lineage transcription factor Runx3 and lost the CD4-lineage transcription factor ThPOK and their differentiation into the T(H)17 subset of helper T cells and colitogenic potential, in a manner dependent on transforming growth factor-β (TGF-β) and retinoic acid. Our results demonstrate considerable plasticity in the CD4(+) T cell lineage that allows chronic exposure to luminal antigens without pathological inflammation.


Conflict of interest statement

The authors have no conflicting financial interests.

Figures

Figure 1
Figure 1. ThPOK and Runx3 are reciprocally regulated at the intestinal tissue
(a, b) ThPOK or Runx3 expression by CD45+TCRβ+ cells from spleen (a) or CD45+TCRβ+CD4+ cells from small intestine epithelium (intraepithelial lymphocytes, IEL) (b) of naive Thpok-GFP (top) or Runx3-YFP (bottom) reporter mice. On the respective right sides, histograms for 2B4 (CD244) expression by ThPOK+CD8αCD4+, ThPOKCD8α CD4+ and ThPOKCD8α+CD4+ (top) or Runx3+CD8αCD4+, Runx3CD8α CD4+ and Runx3CD8α+CD4+ (bottom). Plots are representative of at least three independent experiments (n=5 per group). (c) Relative mRNA expression of genes in sIEL sorted from naïve Runx3-YFP reporter as in b. Pooled data from n=3 representative of two independent experiments with similar results (error bars, s.e.m. of triplicates). (d, e) Sorted naïve CD4+ T cells isolated from spleen of Thpok-GFP (top) or Runx3-YFP (bottom) were adoptively transferred to Rag1−/− recipients and mice were analyzed 40 days after transfer. (d) CD8αα and ThPOK (top) or Runx3 (bottom) expression by CD45+TCRβ+CD4+ from spleen, small intestine IEL and lamina propria (LPL). (e) ThPOK (top) or Runx3 (bottom) and intracellular IL-17A expression by CD45+TCRβ+CD4+ from small intestine IELs. Plots are representative of three independent experiments (n=5 per group).
Figure 2
Figure 2. TGF-β and RA concomitantly induce Treg and ThPOKloRunx3hiCD4+ T cells
Sorted naïve Vα2+CD4+ T cells isolated from reporter OT-II mice (Thpok-GFP, a-d, g and h; Runx3-YFP, d and i; Thpok-GFP–Foxp3-RFP, e and f) were co-cultured with DCs, OVA peptide and indicated cytokines. (a, b) CD8αα and CD8αβ expression by T cells. Graph depicts the average frequency (error bars, s.e.m. of duplicates). (c) ThPOK expression by T cells stimulated without additional cytokines (grey) or by gated CD4 (blue) and CD4+CD8αα (red) stimulated in the presence of TGF-β. (d) ThPOK (left) or Runx3 (right) expression by T cells. (e) CD8αα and Foxp3 expression by T cells. Histograms show ThPOK expression by gated CD8α+Foxp3 (blue), CD8αFoxp3+ (red), and CD8αFoxp3 (green) populations. (f) Relative mRNA expression of genes in cells gated from e (error bars, s.e.m. of duplicates). (g, h) Cells were cultured in the presence of TGF-β+RA and re-stimulated in the presence of TGF-β+RA or IL-12. CD8αα and ThPOK (g) and CD103 (h) expression by T cells. Histograms show ThPOK expression by gated CD8α+CD103+ (blue), CD8αCD103+ (red) and CD8αCD103 (green) populations. (i) Runx3 and CD8αα expression by T cells. Graph depicts the average (error bars, s.e.m. of duplicates) of CD103 mean-fluorescence-intensity (MFI) from gated cells. Data are representative of at least three independent experiments. How many mice per independent experiment? P values for the graphs – if only three mice, might be better to show the individual mouse values rather than as bars.
Figure 3
Figure 3. TGF-β and RA signaling in intestinal CD4+ T cells are required for ThPOK downmodulation and CD8α expression in vivo
(a–f) OT-II or OT-II(ΔTgfbr2) mice were fed with OVA-containing chow for 7 days and cells analyzed by flow cytometry 3 days later. (a) Frequency of diarrhea-free mice after oral OVA challenge. (b) Hematoxylin and eosin staining of the proximal colon. Original magnification, 20x. (c) Histological scores of the colon (each symbol represents one mouse; bar, mean). CD8α and ThPOK (d), 2B4 and CD103 (e), and intracellular IFN-γ and Foxp3 (f) expression by CD45+Vα2+CD4+CD8β cells from spleen (SPL), mesenteric lymph nodes (MLN), small intestine IEL and LPL. Graphs depict frequency of gated cells in each tissue (error bars, s.e.m.). Data are representative of two independent experiments (n=4 to 6 per group). (g–i) CD8α, 2B4, CD103, CCR9, and ThPOK expression by CD45+TCRβ+CD4+CD8β cells isolated from the small intestine IEL of naïve control Cd4-Cre or Cd4-Cre+ dominant negative Raralsl/lslThpok-GFP mice. Graphs depict frequency among gated cells (error bars, s.e.m.). Plots are representative of three independent experiments (n=3 to 4 per group). * p<0.05.
Figure 4
Figure 4. ThPOK loss by activated CD4+ T cells hinders colitis development
(a) CD8α, CD8β and CD103 expression by CD45+TCRβ+CD4+ cells isolated from the small intestine IEL of a naive Ox40Thpok) mouse. Plots are representative of n=5 mice per group. (b–k) Sorted naïve CD4+ T cells isolated from spleen of WT or Ox40Thpok) mice were adoptively transferred to Rag1 −/− recipients and mice were analyzed 40 to 50 days later. (b) Body weight of recipient mice. (c) Hematoxylin and eosin staining of the proximal colon of recipient mice. Original magnification, 4x. (d) Histological scores of the colon from recipient mice (each symbol represents one mouse; bars, mean). CD8α, CD8β and intracellular Foxp3 (e–g), CD103 (h) and intracellular IL-17 and IFN-γ expression (i, j) by CD45+TCRβ+CD4+ cells isolated from the indicated tissues of recipient mice. Graphs depict frequency of gated cells in the different tissues (error bars, s.e.m.). (k) CD8α and intracellular IL-17 and IFN-γ expression by CD45+TCRβ+CD4+ CD8β or CD8β+ cells isolated from the large intestine LPL of mice recipients of Ox40Thpok)naïve CD4+ T cells. Data are representative of two independent experiments (n=3 to 6 per group). * p<0.05.
Figure 5
Figure 5. Continuous ThPOK expression is required for inflammatory activity of CD4+ T cells
(a-f) Sorted naïve CD4+ T cells isolated from spleen of ThpokERT2 mice were adoptively transferred to Rag1−/− recipients and mice were analyzed 40 days later. Recipient mice were administered tamoxifen (TAM) intraperitoneally three times, every three days, starting on day 0 or day 20 after transfer. (a) Body weight of recipient mice (error bars, s.e.m.). (b) Hematoxylin and eosin staining of the proximal colon of recipient mice. Original magnification, 10x. (c) Histological scores of recipient mice (each symbol represents one mouse; bars, mean). (d, e) CD8α, CD103 and intracellular IL-17 expression by CD45+TCRβ+CD4+ cells. Graphs depict frequency of gated cells in the different tissues (error bars, s.e.m.). Data are representative of two independent experiments (n=3 per group). * p<0.05.
Figure 6
Figure 6. Runx3 upregulation precedes ThPOK downmodulation and CD8αα expression by intestinal CD4+ T cells
(a) ThPOK and CD103 expression by CD45+TCRβ+CD4+ cells isolated from the small intestine epithelium of a naïve Thpok-GFP mouse. Plot is representative of three independent experiments (n=5). (b) Runx3 and ThPOK expression by CD45+TCRβ+CD4+ cells isolated from the small intestine epithelium of naïve Runx3-YFP–Thpok-GFP mice or 40 days following adoptive transfer of sorted naïve CD4+ T cells isolated from spleen of Runx3-YFP–Thpok-GFP mice to Rag1−/− recipients. Data are representative of three independent experiments (n=5). (c) ThPOK and CD8α expression by CD45+TCRβ+CD4+CD8β cells isolated from small intestine epithelium of naïve Cd4Runx3)–Thpok-GFP mice. (d, e) ThPOK, CD103 and 2B4 expression by CD45+TCRβ+CD4+ cells isolated from the small intestine epithelium of naïve Thpok-GFP (WT) or Cd4Runx3)–Thpok-GFP mice. (c–e) Data are representative of two independent experiments (n=3 per group). (f–h) Sorted naïve CD4+ T cells isolated from spleen of Thpok-GFP (WT) or Cd4Runx3)–Thpok-GFP mice were adoptively transferred to Rag1−/− recipients and mice were analyzed 40 days later. (f) CD8αα and ThPOK expression by CD45+TCRβ+CD4+CD8β cells isolated from small intestine epithelium of recipient mice. Graphs depict frequency of ThPOKlo (g) and CD103+ (h) cells gated as in f (error bars, s.e.m.). Data are representative of two independent experiments (n=4 per group). * p<0.05.
Figure 7
Figure 7. Runx3 expression by CD4+ T cells inversely correlates with their inflammatory potential
(a–g) Sorted naïve CD4+ T cells isolated from spleen of Thpok-GFP (WT) or Cd4Runx3)–Thpok-GFP mice were adoptively transferred to Rag1−/− recipients and mice were analyzed 40 to 50 days later. (a) Body weight of recipient mice (error bars, s.e.m.). (b) Hematoxylin and eosin staining of the proximal colon of recipient mice. Original magnification, 20x. (c) Histological scores of small intestine and colon of recipient mice (error bars, s.e.m.). (d) Frequency of IL-17 and IFN-γ expressing cells among CD45+TCRβ+CD4+ cells isolated from the small intestine epithelium of recipient mice (error bars, s.e.m.). Data are representative of three independent experiments (n= 5 per group). (e–g) Sorted naïve CD4+ T cells isolated from spleen of WT CD45.1 or Cd4Runx3) CD45.2 mice were adoptively co-transferred at a ratio 1:1 to Rag1−/− recipients and mice were analyzed 40 days later (n=3 per group). (e) CD45.1 and CD45.2 expression by TCRβ+CD4+ cells isolated from spleen or small intestine epithelium of recipient mice. (f, g) Frequency of CD8α (CD8β) and IL-17 expressing cells among TCRβ+CD4+ CD45.1 or CD45.2 cells isolated from the small and large intestine IEL and LPL of recipient mice. Connecting lines represent each individual recipient mouse. * p<0.05.
Figure 8
Figure 8. Cd4Runx3) mice show increased resistance to Citrobacter rodentium infection
(a–e) WT or Cd4Runx3) mice were orally infected with C. rodentium and analyzed 18 days post infection. (a) Body weight of mice (error bars, s.e.m.). (b) Hematoxylin and eosin staining of the proximal colon of infected mice. Original magnification, 20x. (c) Histological scores of proximal colon of infected mice (each symbol represents one mouse from two combined experiments; bars, mean) (d) Colony-forming-unit (CFU) of C. rodentium from fecal pellets of infected mice (error bars, s.e.m.). (e) Intracellular IL-17 and IFN-γ expression by CD45+TCRβ+CD4+ cells isolated from the large intestine LPL. Graph depicts frequency of IL-17 producing cells (error bars, s.e.m.). Data are representative of three independent experiments (n=3 to 5 per group). (f) Sorted naïve CD4+ T cells isolated from WT or Cd4Runx3) mice were co-cultured for 4.5 days with splenic DCs and soluble anti-CD3ε in the presence of the indicated cytokines. Plots show intracellular IL-17 expression by gated CD4+ T cells (values, mean and s.e.m. of duplicate wells). Data are representative from three independent experiments. * p<0.05.

Comment in

References

    1. He X, Park K, Kappes DJ. The role of ThPOK in control of CD4/CD8 lineage commitment. Annu Rev Immunol. 2010;28:295–320. - PubMed
    1. Xiong Y, Bosselut R. CD4-CD8 differentiation in the thymus: connecting circuits and building memories. Curr Opin Immunol. 2012;24:139–145. - PMC - PubMed
    1. Sakaguchi S, et al. The zinc-finger protein MAZR is part of the transcription factor network that controls the CD4 versus CD8 lineage fate of double-positive thymocytes. Nat Immunol. 2010;11:442–448. - PMC - PubMed
    1. Setoguchi R, et al. Repression of the transcription factor Th-POK by Runx complexes in cytotoxic T cell development. Science. 2008;319:822–825. - PubMed
    1. Egawa T, Littman DR. ThPOK acts late in specification of the helper T cell lineage and suppresses Runx-mediated commitment to the cytotoxic T cell lineage. Nat Immunol. 2008;9:1131–1139. - PMC - PubMed

Publication types

MeSH terms