. 2014 Apr;35(4):1284-96.
doi: 10.1002/hbm.22252. Epub 2013 Jan 18.

Dysmaturation of the default mode network in autism

Affiliations

Dysmaturation of the default mode network in autism

Stuart D Washington et al. Hum Brain Mapp. 2014 Apr.

Abstract

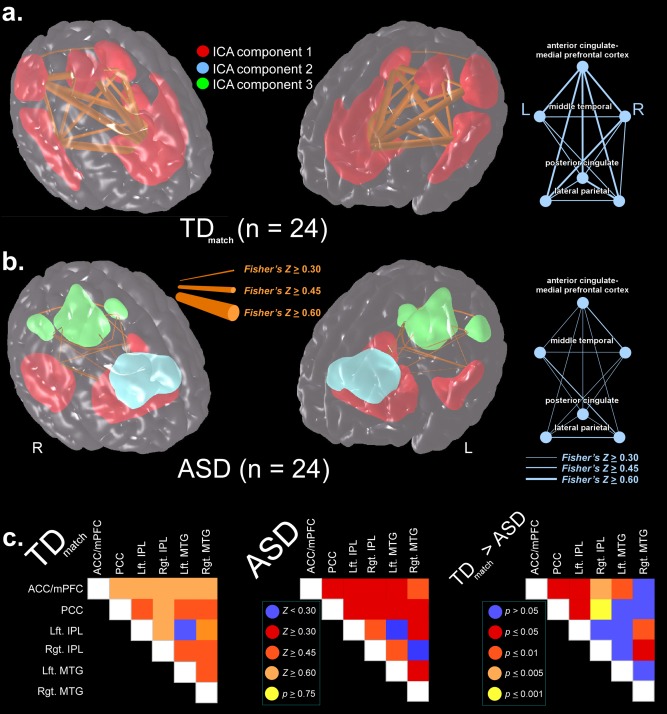
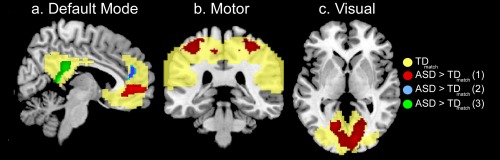
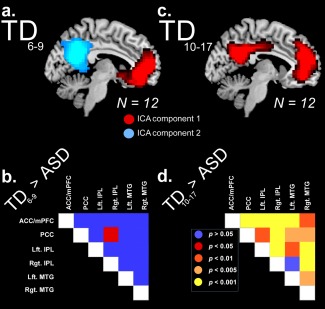
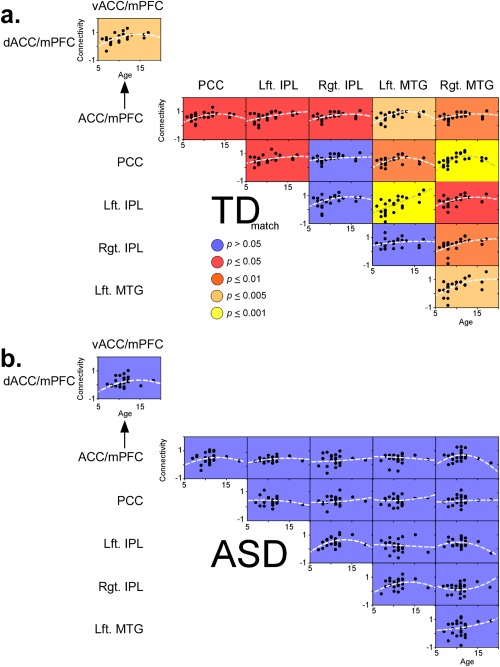
Two hypotheses of autism spectrum disorder (ASD) propose that this condition is characterized by deficits in Theory of Mind and by hypoconnectivity between remote cortical regions with hyperconnectivity locally. The default mode network (DMN) is a set of remote, functionally connected cortical nodes less active during executive tasks than at rest and is implicated in Theory of Mind, episodic memory, and other self-reflective processes. We show that children with ASD have reduced connectivity between DMN nodes and increased local connectivity within DMN nodes and the visual and motor resting-state networks. We show that, like the trajectory of synaptogenesis, internodal DMN functional connectivity increased as a quadratic function of age in typically developing children, peaking between, 11 and 13 years. In children with ASD, these long-distance connections fail to develop during adolescence. These findings support the "developmental disconnection model" of ASD, provide a possible mechanistic explanation for the Theory-of-Mind hypothesis of ASD, and show that the window for effectively treating ASD could be wider than previously thought.

Keywords: Theory of Mind; autism; default mode network; development; functional connectivity; synaptogenesis.


Figures

Figure 1
Figure 1
Illustration of the experimental design and subsequent data analysis. fMRI data in this study was elicited by BOLD signal fluctuations associated with the fixation blocks of a modified, flanker task presented using a block design. For the purposes of this study, changes in BOLD signal were only measured from scans associated with the 48‐s control period (i.e., rest block), and scans associated with the performance/perception of the modified flanker task and its stimuli were discarded. BOLD activity associated with resting‐state networks was visually identified using an ICA analysis. ROIs were created based on loci of BOLD activity in the TDmatch group that were associated with nodes of the default mode network (DMN), and correlations (Fisher's Z‐scores) of BOLD signal fluctuations between DMN nodes were used to determine functional connectivity.
Figure 2
Figure 2
Comparisons between the internodal DMN functional connectivity of children with ASD and age‐matched TD children (TDmatch). Three‐dimensional renderings of the functional connectivity between DMN nodes in the TDmatch group (a) and the ASD group (b) visualized in a translucent brain template are shown in the left and middle figures. Regions‐of‐interest (ROI) were determined in an unbiased, data‐driven approach using ICA on four rest blocks (each 42 s) of a modified flanker task. Colors of ROIs denote the different independent components identified in each group. Strengths of functional connections were ascertained using average partial correlations of BOLD signal between the ICA‐derived ROIs and are depicted by the width of the lines connecting pairs of nodes. The right figure shows a top‐down 2D graphical depiction of the functional connections between DMN nodes as determined by partial correlations in which line‐widths denote strengths of functional connections. As the complete DMN was contained in a single ICA component in the TDmatch group, all of these ROIs are shown in red (a). In the ASD group (b), three ICA components were needed to identify the DMN: the red (ventral ACC/mPFC and MTG), cyan (dorsal ACC/mPFC), and green (PCC and IPL) ROIs. (c) Left: Correlation matrix representing DMN functional connectivity for the TDmatch group. Colors correspond to Fisher's Z transformations of Pearson's Product moment correlations. Middle: correlation matrix of default mode functional connectivity for children with ASD. Representation is similar to that at left. Right: Matrix representation of post‐hoc statistical comparisons between DMN functional connectivity in the TDmatch and ASD groups. Representations match those above except that colors symbolize P values as opposed to Fisher's Z values. Connectivity differences between the TDmatch and ASD groups are shown in detail in Supporting Information Figure SS2.
Figure 3
Figure 3
Differences in intra‐nodal (a) DMN, (b) motor, and (c) visual network functional connectivity between TD children and those with ASD. Translucent yellow regions represent ICA‐derived ROIs based on results from the TDmatch group, and correspond to DMN (left), motor (middle), and visual (right) networks, each of which could be described by a single ICA component. Red, cyan, and green regions, respectively, represent voxelwise dual‐regression comparisons (ASD > TDmatch) between the first, second, and third components from the ASD group and the single ICA‐component from the TDmatch group. In the ASD group, only the DMN required more than one ICA‐component to describe the entire network. Voxelwise comparisons were predicated on performing dual regression on each subject's resting‐state data and were masked by the DMN, motor, and visual networks of the TDmatch group and thresholded at P < 0.05 (FWE corrected; extent threshold = 50 voxels). The inverse comparison (TDmatch > ASD) yielded no significant voxels in either the motor or visual networks, and yielded none within DMN nodes.
Figure 4
Figure 4
(a) ICA component map of DMN functional connectivity in the TD6–9 group superimposed onto the sagittal plane of a typical brain. Similar to the ASD group, more than one component is needed to capture the DMN network in the younger TD group. In this case, two ICA component maps were required to represent functional connectivity between DMN nodes in this group. (b) Correlation matrix of post‐hoc comparisons of internodal DMN functional connectivity in the TD6–9 and ASD groups. Colors are proportional to P values. The only statistically significant (P < 0.05) difference in connectivity between the TD6–9 and ASD groups was the PCC and right IPL node pair. All differences correspond to the comparison of TD6–9 > ASD. None of the connections were found to be significantly greater in the ASD group. (c) ICA component map of DMN functional connectivity in the TD10–17 group superimposed onto the sagittal plane of a typical brain. Similar to the TDmatch group, the entire DMN network is captured by a single ICA component. (d) Correlation matrix of post‐hoc comparisons of internodal DMN functional connectivity in the TD10–17 and ASD groups. Unlike the TD6–9 group, TD10–17 group shows differences in connectivity throughout DMN. None of the connections were found to be significantly greater in the ASD group. Connectivity differences between the TD6–9 and TD10–17 groups and the ASD group are explained in more detail in Supporting Information Figures SS3 and SS4.
Figure 5
Figure 5
Relationship between DMN functional connectivity and age. (a) Each of the 16 plots compares functional connectivity (Fisher's Z, ordinate) with the ages of children (N = 24, abscissa) in the TDmatch group. The upper left graph is a comparison between the dorsal and ventral portions of the ACC/mPFC region based on the ASD ICA. The remaining 15 graphs are comparisons between ROIs based on the same DMN nodes (ACC/mPFC, PCC, left IPL, right IPL, left MTG, and right MTG) as in Figures 3, 4, 5. Each black circle represents one child's functional connectivity. Each hashed, translucent line is the second‐order fit. The background color of each plot indicates the significance of each second‐order fit: blue indicates no correlation (P > 0.05), whereas red (0.01 ≤ P ≤ 0.05), red‐orange (0.005 ≤ P ≤ 0.01), and yellow orange (0.005 ≤ P ≤ 0.001) indicate significant correlations, and yellow indicates the highest correlations (P ≤ 0.001). (b) The same representation as “A” for the 24 children with ASD.
Figure 6
Figure 6
Exploratory correlations between functional connectivity and ASD psychometrics. (a) Scatter diagram comparing the internodal DMN functional connectivity between the PCC and right MTG nodes (abscissa) in 17 children with ASD and the corresponding ADI Social (ADI‐Soc) score (ordinate) for each subject. Correlations between PCC and right MTG connectivity and ADI‐Soc scores showed an increase in symptom severity coinciding with decreased functional connectivity (r = −0.50). (b) Scatter‐diagram comparing the internodal DMN functional connectivity between the ACC/mPFC and PCC nodes, expressed as Fisher's Z‐scores (abscissa), in 10 children with ASD and the corresponding SRS Autistic Mannerism (SRS–Mann) score (ordinate) for each subject. Correlations between ACC/mPFC and PCC connectivity and SRS–Mann scores showed an increase in symptom severity coinciding with decreased functional connectivity (r = −0.70). Other significant correlations between internodal DMN connectivity and autism psychometrics are detailed in Supporting Information Table SS1.

References

    1. Abbott C, Juarez M, White T, Gollub RL, Pearlson GD, Bustillo J, Lauriello J, Ho B, Bockholt HJ, Clark VP, Magnotta V, Calhoun VD (2011): Antipsychotic dose and diminished neural modulation: A multi‐site fMRI study. Prog Neuropsychopharmacol Biol Psychiatry 35:473–482. - PMC - PubMed
    1. Addis DR, Wong AT, Schacter DL (2007): Remembering the past and imagining the future: Common and distinct neural substrates during event construction and elaboration. Neuropsychologia 45:1363–1377. - PMC - PubMed
    1. Assaf M, Jagannathan K, Calhoun VD, Miller L, Stevens MC, Sahl R, O'Boyle JG, Schultz RT, Pearlson GD (2010): Abnormal functional connectivity of default mode sub‐networks in autism spectrum disorder patients. Neuroimage 53:247–256. - PMC - PubMed
    1. Baron‐Cohen S (1989): The theory of mind hypothesis of autism: A reply to Boucher. Br J Disord Commun 24:199–200. - PubMed
    1. Beckmann CF, DeLuca M, Devlin JT, Smith SM (2005): Investigations into resting‐state connectivity using independent component analysis. Philos Trans R Soc Lond B Biol Sci 360:1001–1013. - PMC - PubMed

Publication types