

Vancomycin AUC/MIC ratio and 30-day mortality in patients with Staphylococcus aureus bacteremia
- PMID: 23335735
- PMCID: PMC3623342
- DOI: 10.1128/AAC.01485-12
Vancomycin AUC/MIC ratio and 30-day mortality in patients with Staphylococcus aureus bacteremia
Abstract
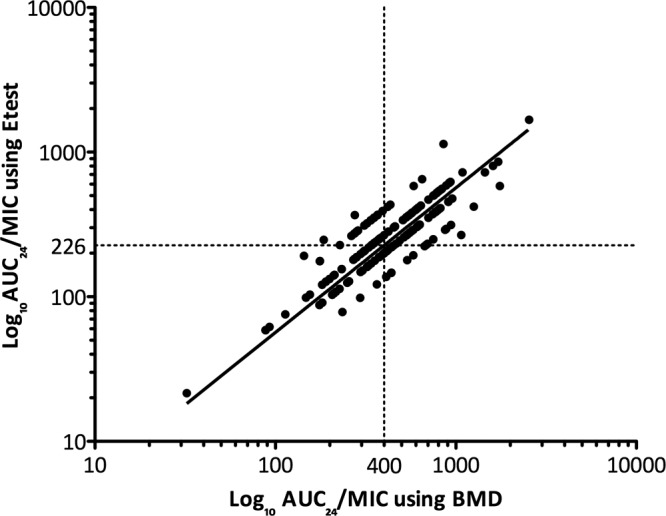
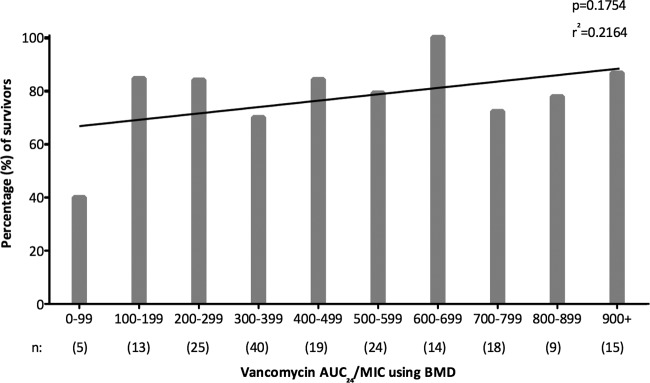
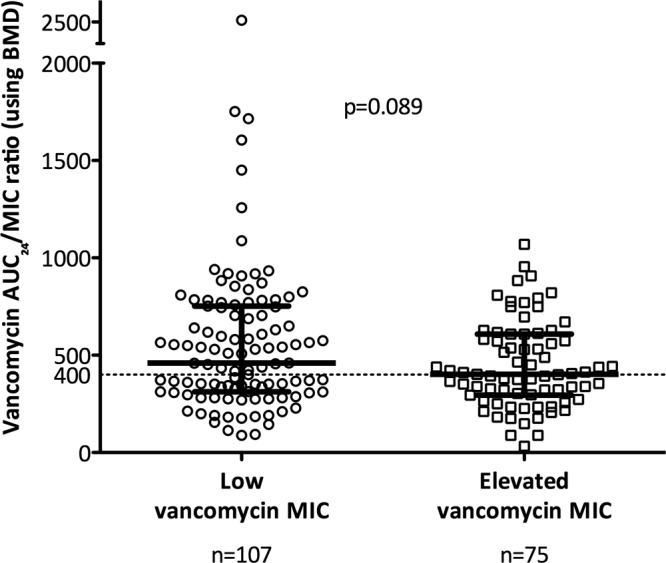
A ratio of the vancomycin area under the concentration-time curve to the MIC (AUC/MIC) of ≥ 400 has been associated with clinical success when treating Staphylococcus aureus pneumonia, and this target was recommended by recently published vancomycin therapeutic monitoring consensus guidelines for treating all serious S. aureus infections. Here, vancomycin serum trough levels and vancomycin AUC/MIC were evaluated in a "real-world" context by following a cohort of 182 patients with S. aureus bacteremia (SAB) and analyzing these parameters within the critical first 96 h of vancomycin therapy. The median vancomycin trough level at this time point was 19.5 mg/liter. There was a significant difference in vancomycin AUC/MIC when using broth microdilution (BMD) compared with Etest MIC (medians of 436.1 and 271.5, respectively; P < 0.001). Obtaining the recommended vancomycin target AUC/MIC of ≥ 400 using BMD was not associated with lower 30-day all-cause or attributable mortality from SAB (P = 0.132 and P = 0.273, respectively). However, an alternative vancomycin AUC/MIC of >373, derived using classification and regression tree analysis, was associated with reduced mortality (P = 0.043) and remained significant in a multivariable model. This study demonstrated that we obtained vancomycin trough levels in the target therapeutic range early during the course of therapy and that obtaining a higher vancomycin AUC/MIC (in this case, >373) within 96 h was associated with reduced mortality. The MIC test method has a significant impact on vancomycin AUC/MIC estimation. Clinicians should be aware that the current target AUC/MIC of ≥ 400 was derived using the reference BMD method, so adjustments to this target need to be made when calculating AUC/MIC ratio using other MIC testing methods.
Figures

References
-
- Deresinski S. 2007. Vancomycin and Staphylococcus aureus—an antibiotic enters obsolescence. Clin. Infect. Dis. 44:1543–1548 - PubMed
-
- Gould IM. 2010. Is vancomycin redundant for serious staphylococcal infection? Int. J. Antimicrob. Agents 36(Suppl. 2):S55–S57 - PubMed
-
- Rehm SJ, Tice A. 2010. Staphylococcus aureus: methicillin-susceptible S. aureus to methicillin-resistant S. aureus and vancomycin-resistant S. aureus. Clin. Infect. Dis. 51(Suppl. 2):S176–S182 - PubMed
-
- Howden BP. 2005. Recognition and management of infections caused by vancomycin-intermediate Staphylococcus aureus (VISA) and heterogenous VISA (hVISA). Intern. Med. J. 35(Suppl. 2):S136–S140 - PubMed
-
- Charles PG, Ward PB, Johnson PD, Howden BP, Grayson ML. 2004. Clinical features associated with bacteremia due to heterogeneous vancomycin-intermediate Staphylococcus aureus. Clin. Infect. Dis. 38:448–451 - PubMed
Publication types
MeSH terms
Substances
LinkOut - more resources
Full Text Sources
Other Literature Sources
Medical
