. 2013 Feb 15;190(4):1528-39.
doi: 10.4049/jimmunol.1201387. Epub 2013 Jan 18.

Suppression of inflammatory responses during myelin oligodendrocyte glycoprotein-induced experimental autoimmune encephalomyelitis is regulated by AKT3 signaling

Affiliations

Suppression of inflammatory responses during myelin oligodendrocyte glycoprotein-induced experimental autoimmune encephalomyelitis is regulated by AKT3 signaling

Vladislav Tsiperson et al. J Immunol. .

Abstract

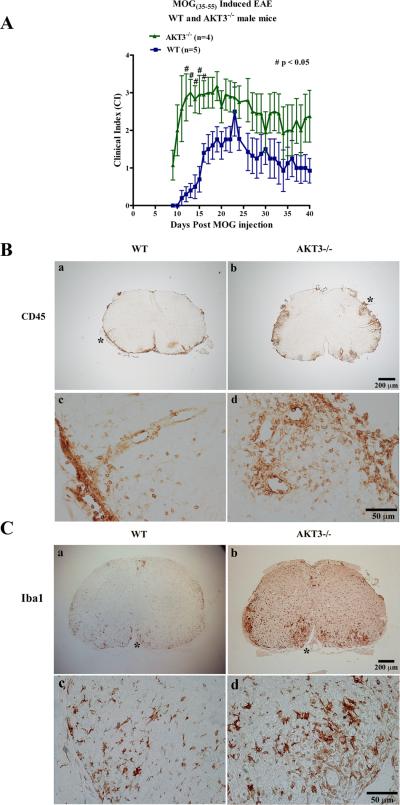
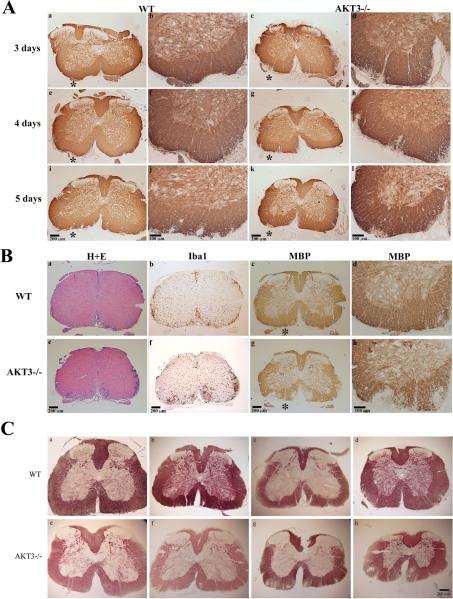
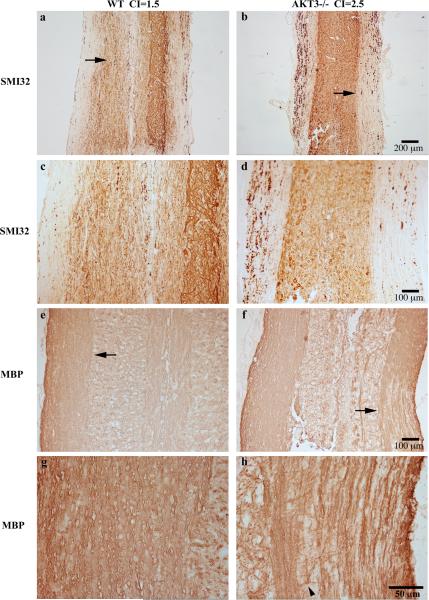
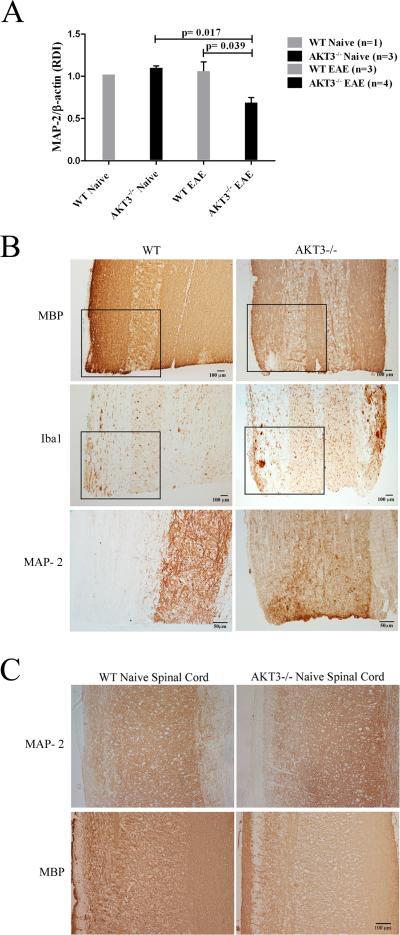
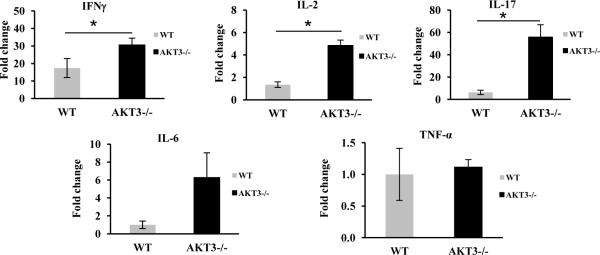
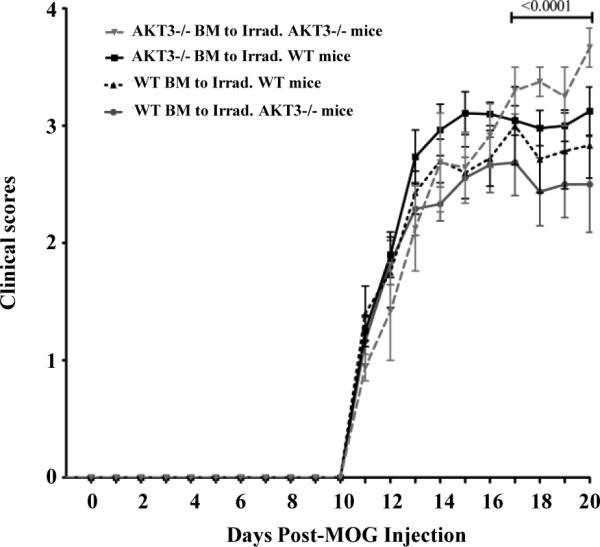
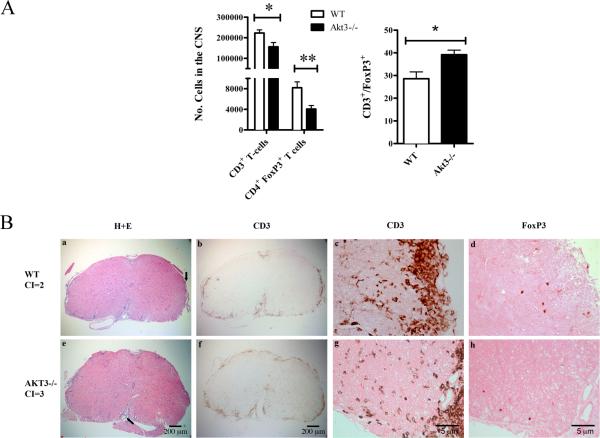
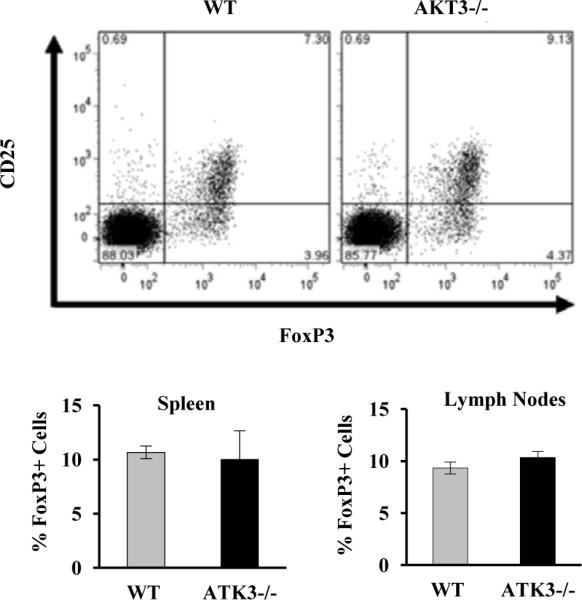
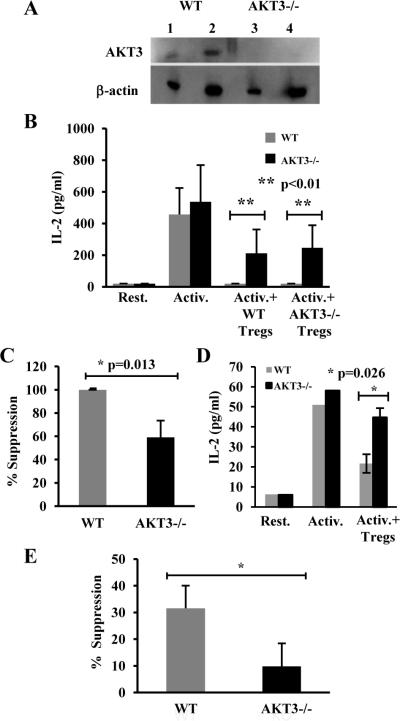
AKT3, a member of the serine/threonine kinase AKT family, is involved in a variety of biologic processes. AKT3 is expressed in immune cells and is the major AKT isoform in the CNS representing 30% of the total AKT expressed in spinal cord, and 50% in the brain. Myelin-oligodendrocyte glycoprotein-induced experimental autoimmune encephalomyelitis (EAE) is a mouse model in which lymphocytes and monocytes enter the CNS, resulting in inflammation, demyelination, and axonal injury. We hypothesized that during EAE, deletion of AKT3 would negatively affect the CNS of AKT3(-/-) mice, making them more susceptible to CNS damage. During acute EAE, AKT3(-/-)mice were more severely affected than wild type (WT) mice. Evaluation of spinal cords showed that during acute and chronic disease, AKT3(-/-) spinal cords had more demyelination compared with WT spinal cords. Quantitative RT-PCR determined higher levels of IL-2, IL-17, and IFN-γ mRNA in spinal cords from AKT3(-/-) mice than WT. Experiments using bone marrow chimeras demonstrated that AKT3(-/-) mice receiving AKT3-deficient bone marrow cells had elevated clinical scores relative to control WT mice reconstituted with WT cells, indicating that altered function of both CNS cells and bone marrow-derived immune cells contributed to the phenotype. Immunohistochemical analysis revealed decreased numbers of Foxp3(+) regulatory T cells in the spinal cord of AKT3(-/-) mice compared with WT mice, whereas in vitro suppression assays showed that AKT3-deficient Th cells were less susceptible to regulatory T cell-mediated suppression than their WT counterparts. These results indicate that AKT3 signaling contributes to the protection of mice against EAE.


Figures

Figure 1
Figure 1. AKT3-/- mice have significantly higher clinical scores than WT mice and increased CD45+ and Iba1+ inflammation in lumbar spinal cord during acute EAE
A. Following MOG sensitization, WT and AKT3-/- mice were monitored and graded daily for evidence of EAE as follows: 0, no disease; +1, limp tail or hind limb weakness; +2, limp tail and hind limb weakness; +3, hind limb paralysis; +4, hind and front limb paralysis; +5, moribund # p<0.05. B, C. Increased CD45 and Iba1 immunostaining in AKT3-/- spinal cord during EAE. Lumbar spinal cord sections from mice with clinical scores for 10 days were incubated with anti-CD45 (B) and anti-Iba1 (C). The clinical score of the WT mouse was 1.5 and the AKT3-/- mouse was 2.0. Data is Mean ± SEM. Visualization was by DAB. Asterisk in B,C indicates the designated area in the panels B,C (c,d) at higher magnification. C. Evaluation of Iba1+ inflammation in spinal cord sections. Three to four sections of spinal cord were examined per mouse. Each section was scored for the extent of inflammation on a 1-4 scale, and the averaged/mouse was noted and compared with the WT for statistical significance using a Mann-Whitney test. The extent of Iba1+ inflammation was evaluated on cross sections of spinal cord as follows: A score of 1= mild inflammation at lesions; 2= moderate inflammation at lesions; 3= severe inflammation at lesions; 4=very severe inflammation involving >50% of the spinal cord. WT mice (n=8) and AKT3-/- mice (n=7) were examined. The overall score for the AKT3-/- spinal cords was 3.7±0.18 (±SEM). The overall score of the WT spinal cords was 2.6± 0.42 (±SEM); p ≤ 0.05.
Figure 2
Figure 2. AKT3-/- mice have more demyelination in the ventral funiculus than WT mice during acute EAE
Paraffin-embedded cross-sections of lumbar spinal cord, with clinical scores for 3-5 days (A) or 10 days (B), were incubated with MBP mAb SMI99 and visualized by DAB. B. Representative sections stained with H+E (a,e), or incubated with antibody to Iba1 (Bd and Bf), and MBP (c,d,g,h) and visualized by DAB. Asterisk indicates the designated area in the panels at higher magnification. C. Myelin Black Gold II staining of frozen spinal cord sections from WT (n=5) and AKT3-/- mice (n=4) with clinical scores for 10 days. Analysis in Image J.
Figure 3
Figure 3. AKT3-/- mice have more demyelination than WT mice during chronic EAE
Longitudinal sections of lumbar spinal cord from AKT3-/- and WT mice, with clinical scores for 29-30 days, were incubated with SMI32 (a-d) and MBP (e-h); visualization was by DAB. Arrows in a,b,e,f denote areas of magnification in c,d,g,h, respectively. Arrow in f, lower right also denotes a region of myelin pallor. Arrowhead in h shows an oligodendrocyte extending MBP+ processes adjacent to axons.
Figure 4
Figure 4. Significant loss of MAP-2 during chronic EAE is observed by immunoblot and immunohistochemical analysis
A. Western blot analysis shows a significant loss of MAP-2 in lumbar spinal cord at 40 days post-sensitization. 20 μg of lumbar spinal cord protein homogenate was loaded/lane. The upper portion of the blot was incubated with a monoclonal antibody to MAP-2 (Sigma, 1:1000), and the lower portion was incubated with a monoclonal antibody to β-actin (Sigma). Visualization was by ECL (Amersham). Densitometry and RDI was performed on signals in the linear range (ImageJ). B. Longitudinal sections of lumbar spinal cord from sensitized mice with clinical scores for 30 days were incubated with antibodies to MBP, Iba1 and MAP-2. Boxed region denotes region magnified in MAP-2 stained sections. C. Longitudinal sections of lumbar spinal cord from naïve, 10 week old WT and AKT3-/- mice incubated with antibodies to MAP-2 and MBP.
Figure 5
Figure 5. Quantitative RT-PCR demonstrates that relative to WT mice, AKT3-/- mice have increased inflammatory cytokine expression in spinal cord during acute EAE
Total RNA was isolated from spinal cords of naïve mice and MOG-sensitized WT and AKT3-/- mice following three consecutive days of clinical scores (~day 14). Values were normalized to levels of actin mRNA and calculated as the fold induction mRNA relative to naïve mice for AKT3-/- and WT mice for IL-2, IL-17 and IFNγ; p≤0.05. Similar statistically significant results were obtained when the data was normalized to GAPDH or HPRT. No detectable levels of IL-6 or TNFα were obtained for naïve mice and therefore, levels represent values expressed during EAE; p > 0.05.
Figure 6
Figure 6. Mice receiving bone marrow (BM) cells from AKT3-/- mice have higher mean clinical scores following MOG-induced EAE
Upon sacrificing the mice we analyzed the re-population of T cells in spleen. Our analysis demonstrated that the repopulation of BM cells in groups 1 through 4 were successful. Data were normalized to the day of onset of disease for each group of mice. Inverted grey triangle, AKT3-/- BM to Irrad. AKT3-/- Mice (n=8). Black square, AKT3-/- BM to Irrad. WT Mice (n=20). Upward triangle, WT BM to Irrad. WT Mice (n=10). Circle, WT BM to Irrad. AKT3-/- Mice (n=12).
Figure 7
Figure 7. During acute EAE, fewer Tregs are present in the spinal cord of AKT3-/- mice than WT mice
A. FACS analysis of brain and spinal cord of mice having clinical scores for 3-4 days show fewer FoxP3+ Tregs in the CNS of AKT3-/- mice during acute EAE. The ratio of CD3+/FoxP3+ cells is significantly increased in AKT3-/- brain and spinal cord, *p≤0.05; **<0.02. B. Mice with clinical scores for 4 days were sacrificed on day 14. Multiple 7 μm, 4% paraformaldehyde-treated sections of spinal cord were stained with H+E, and incubated with antibodies to CD3 and FoxP3. Arrow in a and e denote area in c,d,g,h at higher magnification.
Figure 8
Figure 8. Equivalent numbers of regulatory T cells are found in spleen and lymph nodes of naïve WT and AKT3-/- mice
A. The percentage of CD25+FoxP3+ T cells in the CD4+ T cell population was assessed by FACS in cells isolated from spleen of WT and AKT3-/- mice. B. Quantification of the percentages of Foxp3+ cells in the CD4+ T cell population in spleen and lymph nodes of WT and AKT3-/- mice.
Figure 9
Figure 9. CD4+ T cells isolated from naïve AKT3-/- mice and following MOG-induced EAE are more resistant to Treg-mediated suppression than T cells from WT mice
A. Total T cell protein homogenates were prepared from WT and AKT3-/- mice and incubated with an AKT3 monoclonal antibody followed by β-actin. Lanes 1 and 2: WT; lanes 3 and 4: AKT3-/-. 40 μg (lanes 1, 3) and 80 μg (lanes 2, 4) of protein were loaded for each sample. B and C. In vitro differentiated primary Th1 cells from WT or AKT3-/- naïve mice were activated with plate bound antiCD3 and antiCD28 in the presence or absence of WT or AKT3-/- Tregs for 24 hours and IL-2 production measured by ELISA. Results are mean ± SEM from 3 independent experiments; p<0.01. C. Suppression was evaluated as a percentage of inhibition of IL-2 expression induced by WT Tregs on WT or AKT3-/- Th1 cells; p=0.013. D. Spleens and lymph nodes from WT or AKT3-/- mice were pooled according to the clinical scores (2-3 mice/group). Each assay was performed in triplicate. CD4+ Tconv cells were activated in the presence and absence of Treg (50,000 cells each) were co-cultured for 48h. Supernatants were then harvest for ELISA assay to detect IL-2 production; p=0.026. E: In vitro differentiated Th17 cells from wild type or AKT3-deficient mice were activated with plate bound antiCD3 in the presence or absence of wild type Tregs. IL-17 production was measured by ELISA. Results are presented as percentage of suppression of IL-17 production in the presence of Tregs compared to control activated Th17 cells. Graph represents mean+SEM from three independent experiments. *p<0.05.

References

    1. Manning BD, Cantley LC. AKT/PKB signaling: navigating downstream. Cell. 2007;129:1261–1274. - PMC - PubMed
    1. Engelman JA, Luo J, Cantley LC. The evolution of phosphatidylinositol 3-kinases as regulators of growth and metabolism. Nat Rev Genet. 2006;7:606–619. - PubMed
    1. Cho H, Thorvaldsen JL, Chu Q, Feng F, Birnbaum MJ. Akt1/PKBalpha is required for normal growth but dispensable for maintenance of glucose homeostasis in mice. J Biol Chem. 2001;276:38349–38352. - PubMed
    1. Yang ZZ, Tschopp O, Hemmings-Mieszczak M, Feng J, Brodbeck D, Perentes E, Hemmings BA. Protein kinase B alpha/Akt1 regulates placental development and fetal growth. J Biol Chem. 2003;278:32124–32131. - PubMed
    1. Chen WS, Xu PZ, Gottlob K, Chen ML, Sokol K, Shiyanova T, Roninson I, Weng W, Suzuki R, Tobe K, Kadowaki T, Hay N. Growth retardation and increased apoptosis in mice with homozygous disruption of the Akt1 gene. Genes Dev. 2001;15:2203–2208. - PMC - PubMed

Publication types

MeSH terms

Substances