

Co-phylog: an assembly-free phylogenomic approach for closely related organisms
- PMID: 23335788
- PMCID: PMC3627563
- DOI: 10.1093/nar/gkt003
Co-phylog: an assembly-free phylogenomic approach for closely related organisms
Abstract
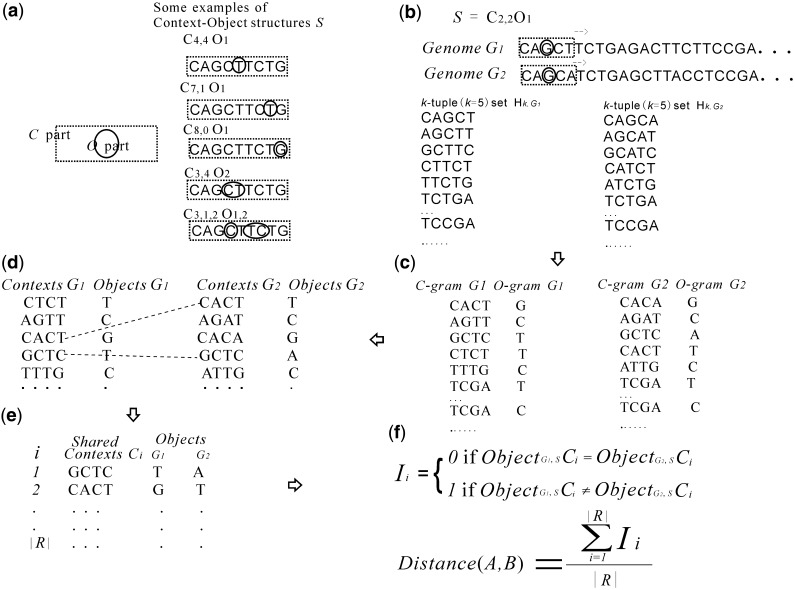
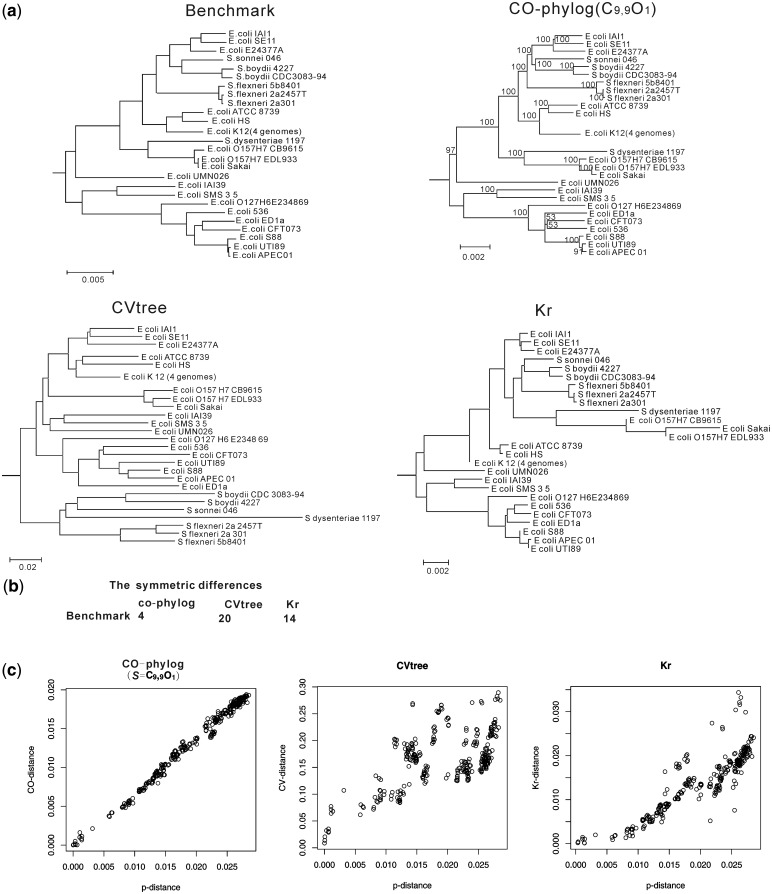
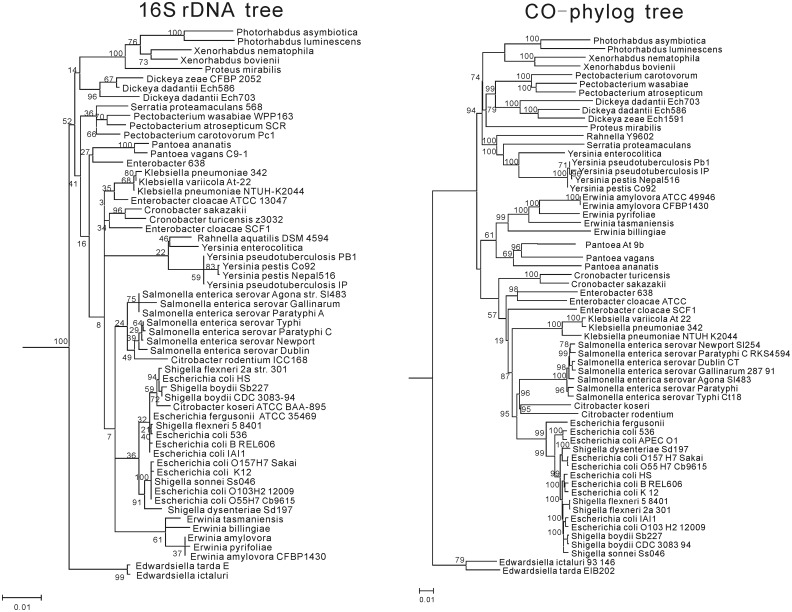
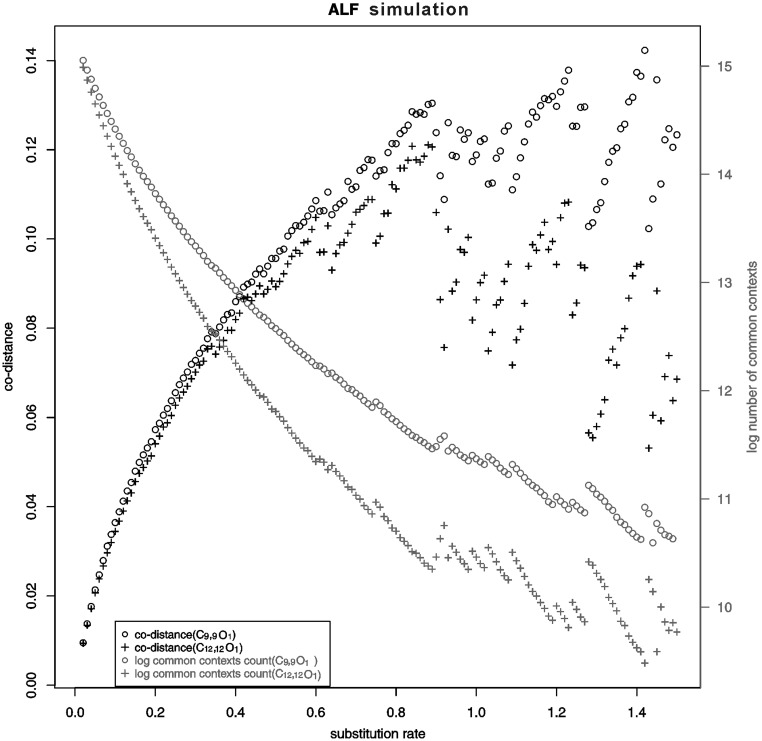
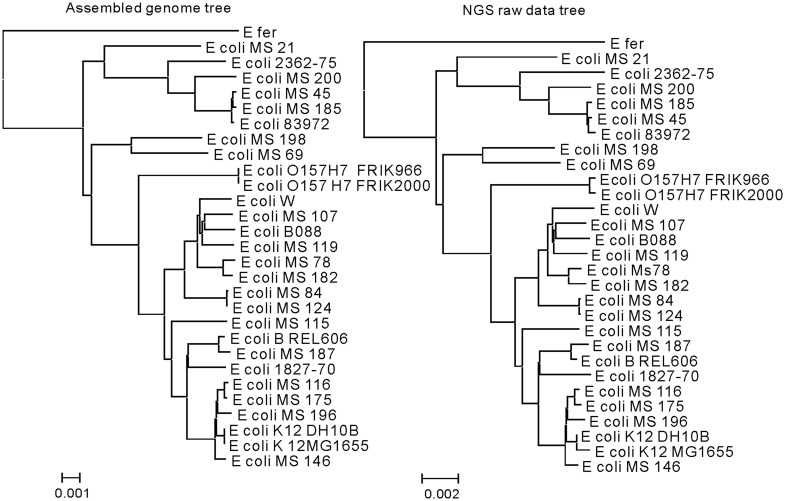
With the advent of high-throughput sequencing technologies, the rapid generation and accumulation of large amounts of sequencing data pose an insurmountable demand for efficient algorithms for constructing whole-genome phylogenies. The existing phylogenomic methods all use assembled sequences, which are often not available owing to the difficulty of assembling short-reads; this obstructs phylogenetic investigations on species without a reference genome. In this report, we present co-phylog, an assembly-free phylogenomic approach that creates a 'micro-alignment' at each 'object' in the sequence using the 'context' of the object and calculates pairwise distances before reconstructing the phylogenetic tree based on those distances. We explored the parameters' usages and the optimal working range of co-phylog, assessed co-phylog using the simulated next-generation sequencing (NGS) data and the real NGS raw data. We also compared co-phylog method with traditional alignment and alignment-free methods and illustrated the advantages and limitations of co-phylog method. In conclusion, we demonstrated that co-phylog is efficient algorithm and that it delivers high resolution and accurate phylogenies using whole-genome unassembled sequencing data, especially in the case of closely related organisms, thereby significantly alleviating the computational burden in the genomic era.
Figures

References
-
- Wiens JJ. Missing data, incomplete taxa, and phylogenetic accuracy. Syst. Biol. 2003;52:528–538. - PubMed
-
- Snel B, Bork P, Huynen MA. Genome phylogeny based on gene content. Nat. Genet. 1999;21:108–110. - PubMed
-
- Blanchette M, Kunisawa T, Sankoff D. Gene order breakpoint evidence in animal mitochondrial phylogeny. J. Mol. Evol. 1999;49:193–203. - PubMed
-
- Ulitsky I, Burstein D, Tuller T, Chor B. The average common substring approach to phylogenomic reconstruction. J. Comput. Biol. 2006;13:336–350. - PubMed
-
- Qi J, Wang B, Hao BI. Whole proteome prokaryote phylogeny without sequence alignment: a K-string composition approach. J. Mol. Evol. 2004;58:1–11. - PubMed
Publication types
MeSH terms
LinkOut - more resources
Full Text Sources
Other Literature Sources
