

Change in the body mass index distribution for women: analysis of surveys from 37 low- and middle-income countries
- PMID: 23335861
- PMCID: PMC3545870
- DOI: 10.1371/journal.pmed.1001367
Change in the body mass index distribution for women: analysis of surveys from 37 low- and middle-income countries
Abstract
Background: There are well-documented global increases in mean body mass index (BMI) and prevalence of overweight (BMI ≥ 25.0 kg/m(2)) and obese (BMI ≥ 30.0 kg/m(2)). Previous analyses, however, have failed to report whether this weight gain is shared equally across the population. We examined the change in BMI across all segments of the BMI distribution in a wide range of countries, and assessed whether the BMI distribution is changing between cross-sectional surveys conducted at different time points.
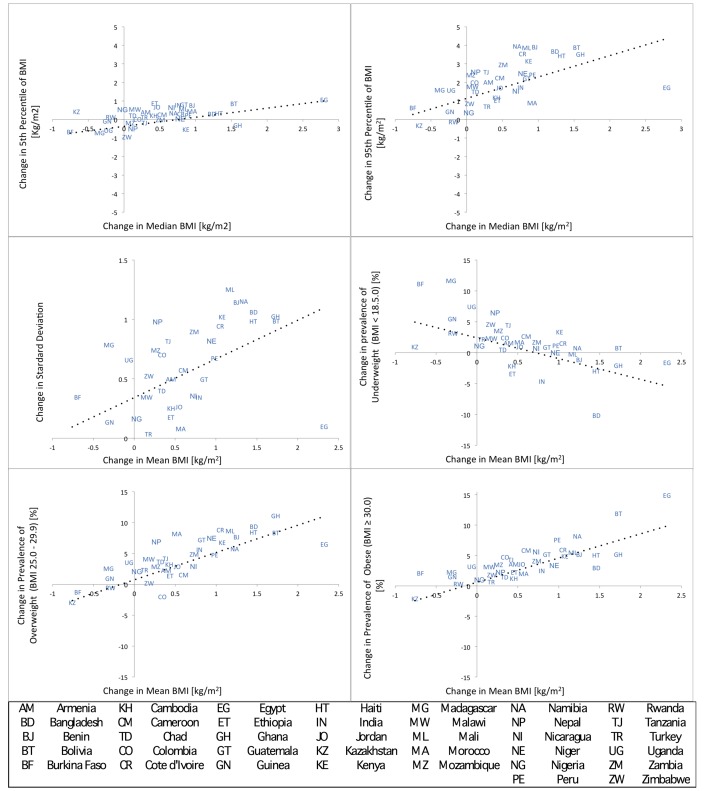
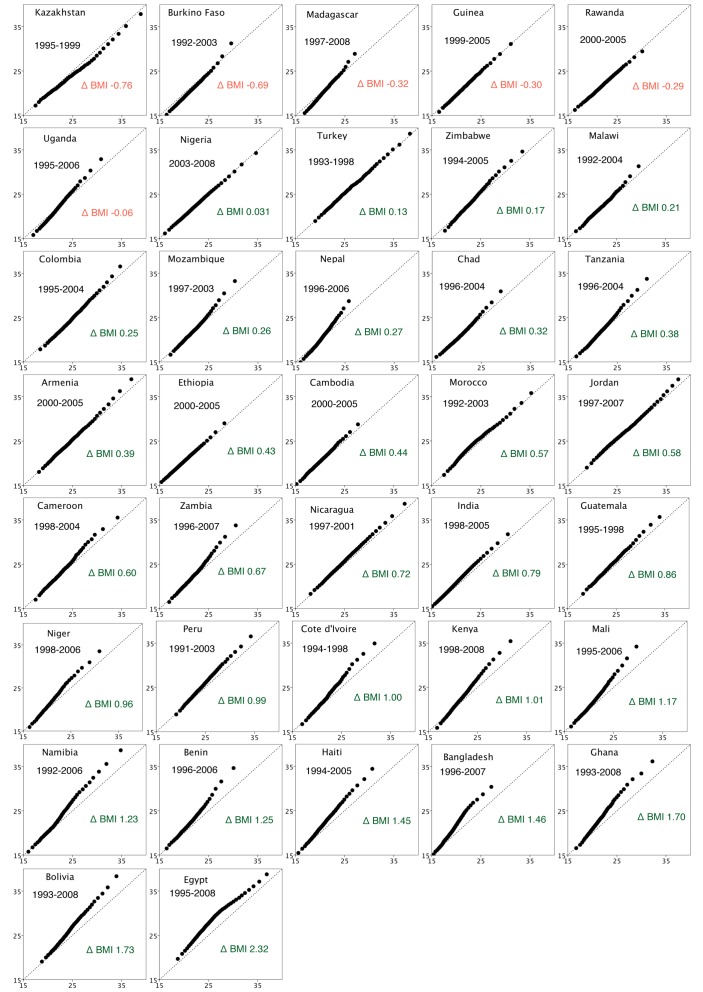
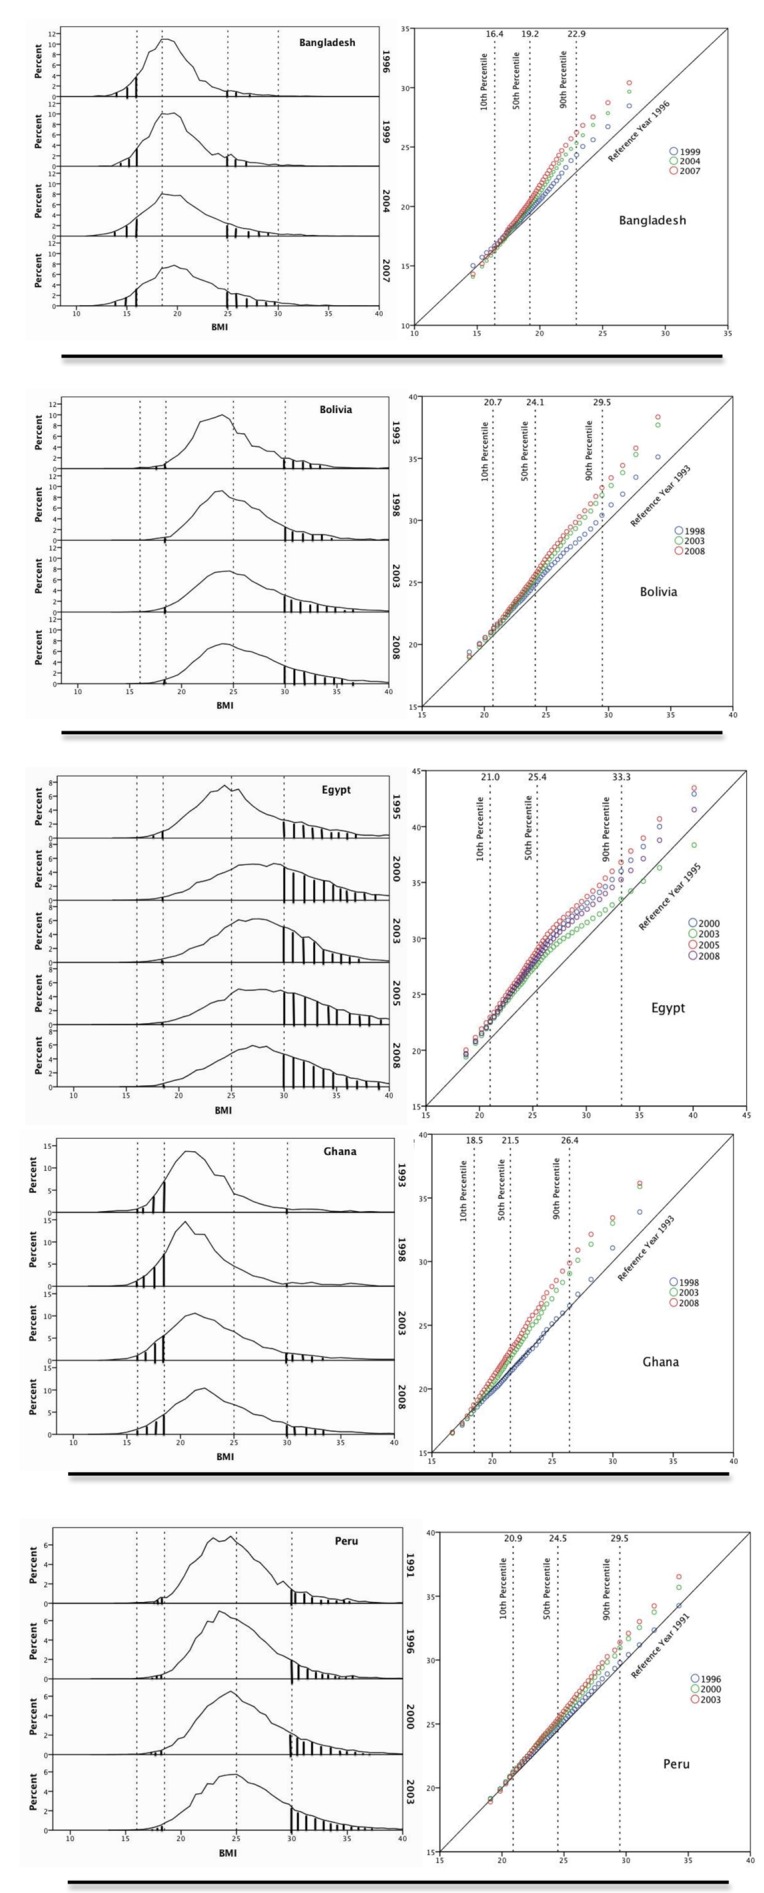
Methods and findings: We used nationally representative surveys of women between 1991-2008, in 37 low- and middle-income countries from the Demographic Health Surveys ([DHS] n = 732,784). There were a total of 96 country-survey cycles, and the number of survey cycles per country varied between two (21/37) and five (1/37). Using multilevel regression models, between countries and within countries over survey cycles, the change in mean BMI was used to predict the standard deviation of BMI, the prevalence of underweight, overweight, and obese. Changes in median BMI were used to predict the 5th and 95th percentile of the BMI distribution. Quantile-quantile plots were used to examine the change in the BMI distribution between surveys conducted at different times within countries. At the population level, increasing mean BMI is related to increasing standard deviation of BMI, with the BMI at the 95th percentile rising at approximately 2.5 times the rate of the 5th percentile. Similarly, there is an approximately 60% excess increase in prevalence of overweight and 40% excess in obese, relative to the decline in prevalence of underweight. Quantile-quantile plots demonstrate a consistent pattern of unequal weight gain across percentiles of the BMI distribution as mean BMI increases, with increased weight gain at high percentiles of the BMI distribution and little change at low percentiles. Major limitations of these results are that repeated population surveys cannot examine weight gain within an individual over time, most of the countries only had data from two surveys and the study sample only contains women in low- and middle-income countries, potentially limiting generalizability of findings.
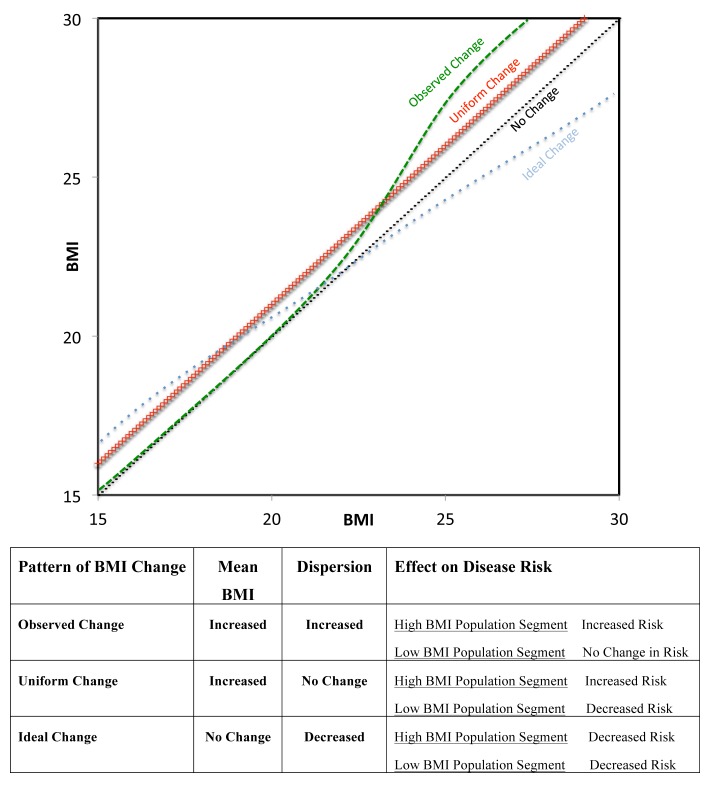
Conclusions: Mean changes in BMI, or in single parameters such as percent overweight, do not capture the divergence in the degree of weight gain occurring between BMI at low and high percentiles. Population weight gain is occurring disproportionately among groups with already high baseline BMI levels. Studies that characterize population change should examine patterns of change across the entire distribution and not just average trends or single parameters.
Conflict of interest statement
The authors have declared that no competing interests exist.
Figures
References
-
- Finucane MM, Stevens GA, Cowan MJ, Danaei G, Lin JK, et al. (2011) National, regional, and global trends in body-mass index since 1980: systematic analysis of health examination surveys and epidemiological studies with 960 country-years and 9·1 million participants. Lancet 377: 557–567. - PMC - PubMed
-
- Rose G, Khaw K-T, Marmot M (2008) Rose's strategy of preventive medicine: the complete original text. New York: Oxford University Press.
-
- Freedman DS, Srinivasan SR, Valdez RA, Williamson DF, Berenson GS (1997) Secular increases in relative weight and adiposity among children over two decades: the Bogalusa Heart Study. Pediatrics 99: 420–426. - PubMed
MeSH terms
LinkOut - more resources
Full Text Sources
Other Literature Sources
