. 2013 Jan 17:6:89.
doi: 10.3389/fncir.2012.00089. eCollection 2012.

Stimulus-specific adaptation and deviance detection in the inferior colliculus

Affiliations

Stimulus-specific adaptation and deviance detection in the inferior colliculus

Yaneri A Ayala et al. Front Neural Circuits. .

Abstract

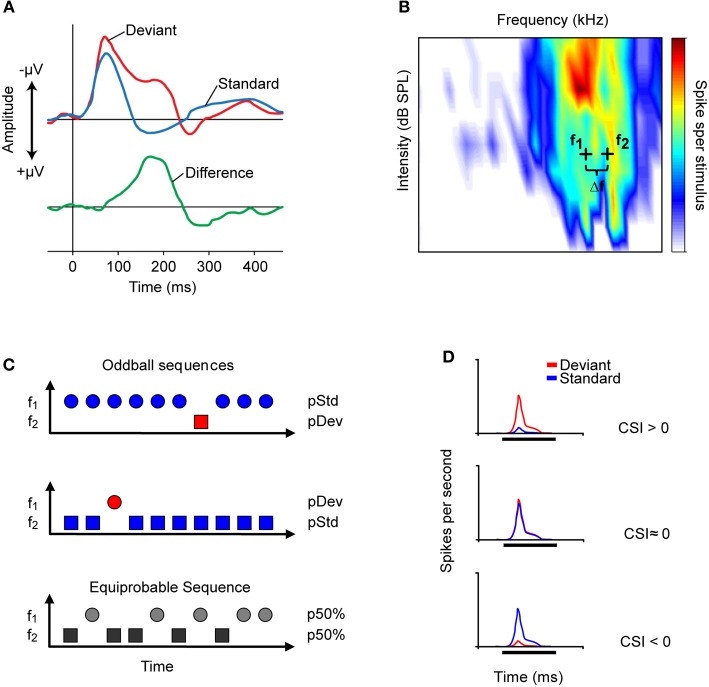
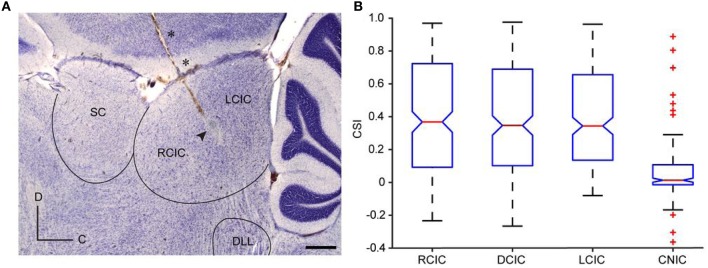
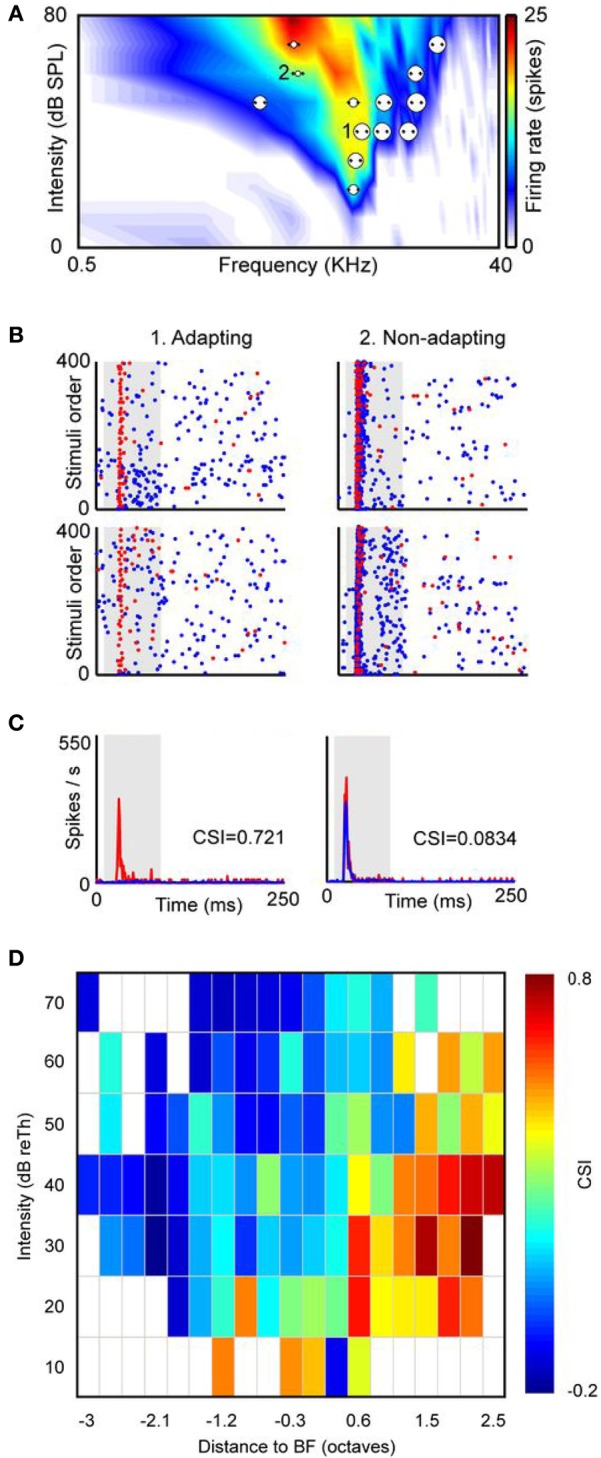
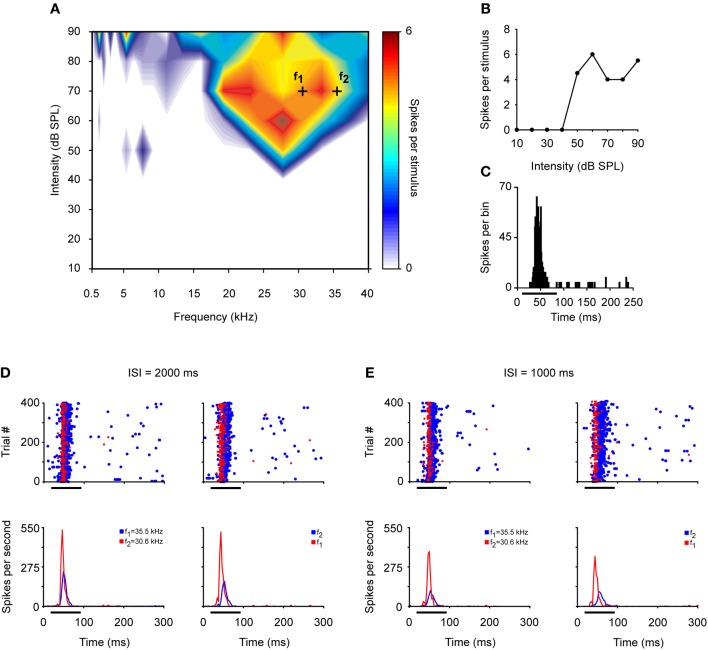
Deviancy detection in the continuous flow of sensory information into the central nervous system is of vital importance for animals. The task requires neuronal mechanisms that allow for an efficient representation of the environment by removing statistically redundant signals. Recently, the neuronal principles of auditory deviance detection have been approached by studying the phenomenon of stimulus-specific adaptation (SSA). SSA is a reduction in the responsiveness of a neuron to a common or repetitive sound while the neuron remains highly sensitive to rare sounds (Ulanovsky et al., 2003). This phenomenon could enhance the saliency of unexpected, deviant stimuli against a background of repetitive signals. SSA shares many similarities with the evoked potential known as the "mismatch negativity," (MMN) and it has been linked to cognitive process such as auditory memory and scene analysis (Winkler et al., 2009) as well as to behavioral habituation (Netser et al., 2011). Neurons exhibiting SSA can be found at several levels of the auditory pathway, from the inferior colliculus (IC) up to the auditory cortex (AC). In this review, we offer an account of the state-of-the art of SSA studies in the IC with the aim of contributing to the growing interest in the single-neuron electrophysiology of auditory deviance detection. The dependence of neuronal SSA on various stimulus features, e.g., probability of the deviant stimulus and repetition rate, and the roles of the AC and inhibition in shaping SSA at the level of the IC are addressed.

Keywords: GABA-mediated inhibition; auditory; change detection; corticofugal modulation; frequency deviance; mismatch negativity; non-lemniscal pathway.


Figures

Figure 1
Figure 1
Auditory change detection is studied by recording the evoked potentials of populations of neurons or the responses of single-units. (A) Schematic representation of the evoked potential known as the mismatch negativity (MMN) recorded through an electroencephalogram. The MMN is associated with the detection of deviant auditory events. It is measured as the difference (green line) between the potential elicited by a sequentially repeated stimulus (standard, blue line), and that elicited by a sound “deviating” in any of its attributes (deviant, red line). The peak of the MMN wave usually occurs at 150–200 ms from the onset of the deviant stimulus. (B) Frequency response area (FRA, combination of frequencies and intensities capable of evoking a response) of an IC neuron. Based on the FRA, the experimenter chooses a pair of frequencies (f1 and f2, black crosses) with a fixed physical separation (Δf) and at the same level to present in the oddball paradigm. Usually, in studies of the IC, a Δf of 0.058, 0.144, or 0.53 octaves is used. (C) Representation of the oddball paradigm used to study the detection of frequency deviance. In one oddball sequence (top), one frequency (f1) is presented as the standard stimulus with a high probability of occurrence (blue symbol), while the second (f2) is the rarely occurring deviant stimulus (red symbol), interspersed randomly among the standards. In a second oddball sequence (middle), the relative probabilities of the two stimuli are reversed, with f2 as the standard (blue) and f1 as the deviant (red). As a control (bottom), both frequencies are presented with the same probability of occurrence [equiprobable condition; p (f1) = p (f2) = 50%]. (D) The common-SSA index (CSI) is a widely used metric to quantify the extent of SSA in the neuronal responses. The three PSTHs represents the response to deviant (red) and to standard (blue) tone of neurons exhibiting different values of CSI. The CSI compares the responses to deviant and to standard stimuli from the two oddball sequences by normalizing the responses in terms of spikes per stimulus (see text). The normalization corrects for the different number of presentations of the standard and deviant stimuli in each sequence. The possible values of the CSI range from +1 to −1, with positive values indicating that the response magnitude to the deviant is higher than that to the standard stimulus (upper PSTH); zero indicating that the two stimuli elicit equal responses (middle PSTH); and negative values indicating that the response to the standard stimulus is greater than that to the deviant stimulus (bottom PSTH).
Figure 2
Figure 2
Anatomical location of SSA in the IC. (A) Photomicrography showing a sagittal section of the IC with a typical electrode track (asterisks) and the electrolytic lesion generated (arrowhead). Scale bar = 500 μm. C, caudal; D, dorsal. (B) Box plot with the median value (red line) of CSI sorted by anatomic regions. The blue box delimits the 25th and 75th percentile and dashed lines show the most extreme data points not considered outliers. Red crosses indicate outliers. Cortical regions (RCIC, DCIC, and LCIC) are significantly different from the CNIC (Kruskal–Wallis test, p < 0.001). Reproduced from Duque et al. (2012).
Figure 3
Figure 3
SSA is not homogeneously distributed within the frequency response area of IC neurons. (A) Example of a neuron with a broad V-shaped response area and the distribution of the several pairs of frequencies presented under the oddball paradigm (dots). Each pair of dots is associated to a circle the size of which is proportional to the level of CSI evoked. An example of an adapting pair of frequencies (i.e., frequencies that elicited SSA) is marked as 1 and another example of a non-specifically adapting pair of frequencies is marked as 2. (B) Dot raster plots obtained with the adapting pair (left panels) and with the non-specifically adapting (right panels) pair of frequencies. The blue dots represent spikes evoked by the standard stimulus (90% probability), while the red dots represent those evoked by the deviant stimulus (10% probability). Stimulus presentations are accumulated in the temporal domain along the vertical axis. In the adapting examples red dots are more visible because of the specific decrease of the response to the standard stimulus. The upper panels are the ones obtained when f1 was the standard tone and f2 was the deviant, and the bottom panels represent the response when the relative probabilities were inversed, that is, f1 was the deviant and f2 the standard. (C) Averaged PSTH for both frequencies when deviant (red) or standard (blue). CSI values obtained in each pair of frequencies are showed as insets in the PSTH. The shaded backgrounds in the dot raster and PSTH plots indicate the duration of the stimulus. (D) Distribution of the CSI values sorted relatively to the best frequency (BF) and the threshold (Th) of the response area of a sample of IC neurons (almost 80% are from the cortical region, n = 124). Higher CSI values are confined to the high-frequency edge and at low sound intensities. Reproduced from Duque et al. (2012).
Figure 4
Figure 4
Example of an IC neuron that exhibits SSA at low repetition frequencies. (A) Broad frequency response area displayed in color code according to the strength of the response. Black crosses represent a frequency pair—f1 (30.6 kHz) and f2 (35.5 kHz)—with a physical separation of 0.216 octaves (Δf = 0.15) at 70 dB SPL. (B) The neuron exhibits a non-monotonic rate-level function at its best frequency (27.1 kHz). (C) PSTH of the accumulated responses to all the frequencies (0.5–40 kHz) and intensities (10–90 dB SPL) presented (1 ms bins). (D) Top panels. Dot rasters of the response to oddball sequences of 400 stimulus presentations with a repetition rate of 0.5 Hz (ISI = 2000 ms). The frequencies used as the deviant stimulus (probability of 10%, red dots) and the standard or repetitive stimulus (probability of 90%, blue dots) are reversed in the left and right panels. The bottom panels show the corresponding normalized PSTHs to deviant (red line) and standard (blue line) stimuli. (E) Response to the oddball sequences presented at a higher repetition rate of 1Hz (ISI = 1000 ms). Format same as for panel (D).
Figure 5
Figure 5
IC neurons exhibit SSA even at very low repetition rates. (A) Population PSTHs of the IC neuronal responses to a deviant (red line) and to a standard (blue line) stimulus presented at different repetition rates; 0.5 (ISI = 2000 ms), 1 (ISI = 1000 ms), and 2 Hz (ISI = 500 ms). The physical separations between frequencies were grouped into Δf ≤ 0.2 (≤ 0.288 octaves) (top panels) and Δf > 0.2 (bottom panels). The firing rates of individual neurons were averaged and normalized to account for the different number of stimulus presentations due to the different probabilities of the tones (deviant; 10%, standard; 90%). The insets shown in the right upper quadrants of each graph correspond to the averaged difference between the responses to the deviant and standard stimuli (green lines). The horizontal black bars indicate the duration of the stimulus. (B) Scatter plots of the first spike latency (FSL) of the neuronal responses evoked by f1 and f2 when they were the deviant (FSLdev) or the standard (FSLstd) stimulus according to their frequency separation (Δf ≤ 0.2 and and Δf > 0.2) and across different repetition rates (0.5, 1, and 2 Hz). (C) Box plots of the population FSL indicating that even at very low repetition rates the FSLs evoked by the deviant tone (red boxes) are shorter than those evoked by the standard stimulus (blue boxes). (Signed-Rank Test; **p < 0.01, ***p < 0.001).
Figure 6
Figure 6
Evoked local field potentials (LFP) recorded in the DCIC. (A) An average LFP is a waveform with a relatively small positive deflection (DP) followed by a large negative deflection (DN). Together, the two deflections are about 40 ms in total duration. (B,C) Evoked LFPs in response to a tone burst presented as standard stimulus (Std, solid line) or deviant stimulus (Dev, dotted line) in a pair of oddball sequences with probabilities of occurrence of the deviant of 10% (panel B) or 30% (panel C). Data were obtained for pairs of tones (f1 = 2.25 kHz and f2 = 3.24 kHz.) separated by a Δf = 0.37 and presented at 1, 2, 4 and 8 Hz. The BF of the recording site was 2.7 kHz. An amplitude-based, frequency-specific, stimulus-specific adaptation index [SSAIAm(fX)], along with the peak latencies of the responses evoked by the sound as standard and deviant stimuli, is shown at the top of each graph. Reproduced from Patel et al. (2012).
Figure 7
Figure 7
Effect of cortical deactivation on SSA exhibited by IC neurons. (A) Mean population PSTHs from IC recordings (n = 82) in response to tones presented as standard (blue) or deviant (red) before and during cooling the ipsilateral AC. The difference between the two is plotted in green. Deactivation of the auditory cortex does not eliminate the deviant saliciency in the averaged signal. (B) Population of neurons which showed no significant change in SSA during cooling, red circles indicate significant SSA, those in gray indicate non-significant CSI values. The solid line connected with square symbols indicates the mean CSI values for the three conditions. (C) Population which shows a decrease in SSA during cooling. Note that on cooling some neurons cease to show significant SSA. (D) Population which shows an increase in SSA during cooling. Note that on cooling some neurons which previously did not show significant SSA now become significant. Figure layout in (C) and (D) is the same as in (A). Reproduced from Anderson and Malmierca (2013).
Figure 8
Figure 8
Example of an IC neuron which shows a decrease in its adaptive properties with cooling. (A) Frequency response areas recorded before (left), during (middle), and after (right) cooling. Black asterisks indicate the frequencies used in the oddball paradigm, firing rate (spikes/sec) indicated by the color scale which applies to all response areas in this figure. (B) Raster plots showing response to f1 (lower frequency) as deviant (red circles) and f2 (higher frequency) as standard (blue triangles). (C) Raster plots showing response to f1 as standard (blue triangles) and f2 as deviant (red circles). (D) PSTH showing mean response to standard (blue) and deviant (red) stimuli. CSI values for each period are superimposed onto the relevant PSTH. Reproduced from Anderson and Malmierca (2013).
Figure 9
Figure 9
Example of an IC neuron which shows stimulus-specific adaptation under normal conditions and increased SSA during the period of cortical cooling. (A) Frequency response areas recorded before (left), during (middle) and after (right) cooling of AC. Black asterisks indicate the frequencies used in the oddball paradigm and the firing rate (spikes/sec) are indicated by the same colour scale that appears in Figure 8A. (B) Raster plots showing response to f1 (lower frequency) as deviant (red circles) and f2 (higher frequency) as standard (blue triangles). (C) Raster plots showing response to f1 as standard (blue triangles) and f2 as deviant (red circles). (D) PSTH showing mean response to standard (blue) and deviant (red) stimuli. CSI values for each period are superimposed onto the relevant PSTH. Reproduced from Anderson and Malmierca (2013).
Figure 10
Figure 10
Effect of the blockade of GABAA receptors on the response magnitude for deviant and for standard stimuli. (A) Dot rasters showing the effect of gabazine blockade of GABAA receptors on the responses of a neuron with SSA. The frequencies tested in the oddball paradigm were 14 kHz and 19 kHz (Δf = 0.3, 0.43 octaves). The insets show a PSTH of the response (3 ms bin size); the horizontal black bar indicates the duration of the stimulus. Before the application of gabazine, this neuron responded much more strongly to both frequencies when they were presented as the deviant than when they were presented as the standard stimulus, resulting in a CSI of 0.965. The application of gabazine for 12 min increased the response to both types of stimuli, but the relative increment was larger for the standards, causing the CSI to drop to 0.480. Fifteen minutes after the end of gabazine application, the neuron's response recovered to the control level, and the CSI increased to 0.926. (B) Evolution of the response magnitude of the neuron (mean spikes per trial) shown in (A) in response to standards (blue lines) and deviants stimulus (red lines). Note that the changes are similar for both frequencies (asterisk and circles) and the main differences are due to the probability condition. The shaded background represents the application of gabazine, which starts at T = 0. The arrows indicate the times corresponding to the dot rasters in (A). (C) Evolution of CSI during the experiment. The symbols indicate the time at the end of a testing oddball sequence, so all times at or before 0 represent recordings completed before the start of the injection. (D) Effect of gabazine on response magnitude in the population of neurons. Gabazine increased the response (spikes per trial) of almost all neurons recorded, but the effect was different for standards (blue diamonds) than for deviants (red circles). Each symbol corresponds to one of the pair of stimuli for each neuron. Colored symbols indicate that the effect of gabazine was significant (Bootstrapping, 95% ci). Gray symbols represent changes that were not statistically significant. Reproduced from Pérez-González et al. (2012).
Figure 11
Figure 11
Effect of the blockade of GABAA receptors on the time course of adaptation and a model of SSA modulation by inhibition. (A,B; D,E) Average discharge across the population of neurons for each position (trial) in the oddball sequence, separately for standard (A,D) and deviant (B,E) stimuli. The minimally adapting neurons (A–C; CSI < 0.5 in the control condition) and the highly adapting ones (D,E; CSI.0.5 in the control condition) were analyzed separately. Then the time course of habituation in the control condition and during application of gabazine was compared. The data for standard stimuli were fitted by a double exponential function (black lines), and the data for deviant stimuli, by a linear function. The insets show a magnified view of the normalized functions during the first 50 trials. Note the different ordinate scales for standard and deviant. (C,F) Ratio of gabazine/control for each type of stimulus during gabazine application. Reproduced from Pérez-González et al. (2012).
Figure 12
Figure 12
The iceberg effect. (A) Schematic representation of a model of the iceberg effect indicating that in the absence of inhibition, neurons respond to deviants (orange) and standards (light blue) with high firing rates, and thus the deviant to standard ratio is small. (B) Inhibition reduces the responses to both deviants (red) and standards (dark blue) increasing the deviant to standard ratio and thus enhancing SSA. The dashed line in (A), delimit the amount of activity (bottom area of the histograms) that decreases due to inhibition. Reproduced from Pérez-González et al. (2012).

References

    1. Anderson L. A., Christianson G. B., Linden J. F. (2009). Stimulus-specific adaptation occurs in the auditory thalamus. J. Neurosci. 29, 7359–7363 10.1523/JNEUROSCI.0793-09.2009 - DOI - PMC - PubMed
    1. Anderson L. A., Malmierca M. S. (2013). The effect of auditory cortical deactivation on stimulus-specific adaptation in the inferior colliculus of the rat. Eur. J. Neurosci. 37, 52–62 10.1111/ejn.12018 - DOI - PubMed
    1. Antunes F. M., Malmierca M. S. (2011). Effect of auditory cortex deactivation on stimulus-specific adaptation in the medial geniculate body. J. Neurosci. 31, 17306–17316 10.1523/JNEUROSCI.1915-11.2011 - DOI - PMC - PubMed
    1. Antunes F. M., Nelken I., Covey E., Malmierca M. S. (2010). Stimulus-specific adaptation in the auditory thalamus of the anesthetized rat. PLoS ONE 5:e14071 10.1371/journal.pone.0014071 - DOI - PMC - PubMed
    1. Astikainen P., Ruusuvirta T., Wikgren J., Penttonen M. (2006). Memory-based detection of rare sound feature combinations in anesthetized rats. Neuroreport 17, 1561–1564 10.1097/01.wnr.0000233097.13032.7d - DOI - PubMed