. 2013 Jan 10:6:121.
doi: 10.3389/fncir.2012.00121. eCollection 2012.

Sub-millisecond closed-loop feedback stimulation between arbitrary sets of individual neurons

Affiliations

Sub-millisecond closed-loop feedback stimulation between arbitrary sets of individual neurons

Jan Müller et al. Front Neural Circuits. .

Abstract

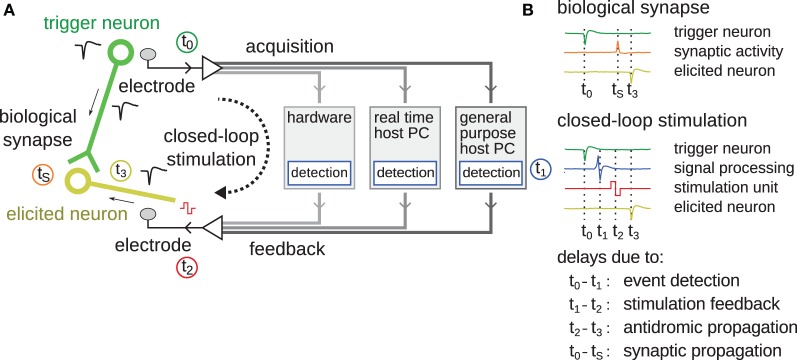
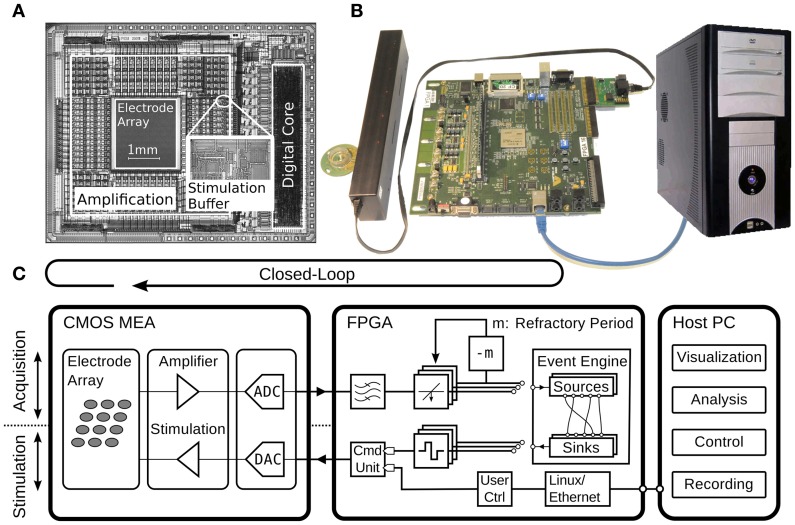
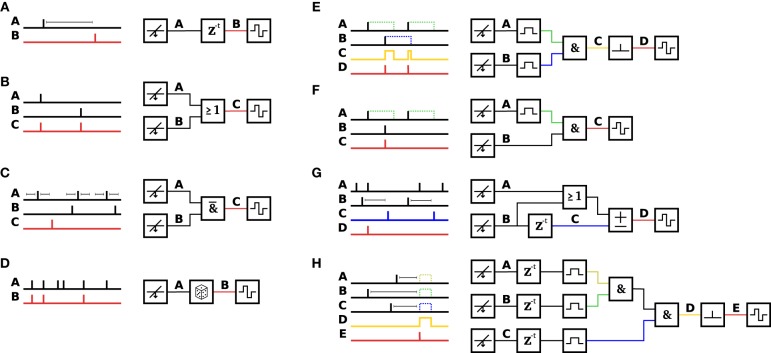
We present a system to artificially correlate the spike timing between sets of arbitrary neurons that were interfaced to a complementary metal-oxide-semiconductor (CMOS) high-density microelectrode array (MEA). The system features a novel reprogrammable and flexible event engine unit to detect arbitrary spatio-temporal patterns of recorded action potentials and is capable of delivering sub-millisecond closed-loop feedback of electrical stimulation upon trigger events in real-time. The relative timing between action potentials of individual neurons as well as the temporal pattern among multiple neurons, or neuronal assemblies, is considered an important factor governing memory and learning in the brain. Artificially changing timings between arbitrary sets of spiking neurons with our system could provide a "knob" to tune information processing in the network.

Keywords: LTD; STDP; acausal stimulation; closed-loop; high-density microelectrode array; sub-millisecond.


Figures

Figure 1
Figure 1
Schematic overview of latencies in feedback stimulation systems. (A) The different components making up a closed-loop feedback stimulation system are shown. The green circle represents the “trigger neuron” whose action potential initiates the start of the loop. The green line represents an axon connecting to synapses of the elicited neuron drawn in yellow. The black dashed arrow shows the closed-loop feedback stimulation path. Between data acquisition and stimulation feedback, different components, over which the feedback-loop can be closed, are possible, including digital signal-processing hardware, a real-time host PC, or a general purpose host PC. The time points t0-3 and tS correspond to different events as listed in (B), such as the occurrence of the spike; its detection after signal-processing; the stimulation feedback; and the antidromic propagation of an action potential back into the soma of the elicited neuron. At time tS, the synapse activates due to pre-synaptic activity of the trigger neuron. The color of the traces corresponds to the color of the timings of t0-3, S and schematically shows the timeline of the respective signals.
Figure 2
Figure 2
Overview of the presented closed-loop system, implemented with a CMOS-MEA, an FPGA, and a host PC. (A) Micrograph of the CMOS-MEA highlighting the electrode array, amplification and stimulation units, and the digital core with an inset showing a close-up of the stimulation buffer. (B) Photograph of the CMOS-MEA plugged into the custom printed-circuit board, which is connected through an LVDS link to the Xilinx Virtex II pro FPGA board from Digilent Inc., Pullman, USA. The host PC running data acquisition and visualization software is connected to the FPGA through Ethernet. (C) Schematic diagram of the setup. The diagram shows the acquisition (upper part) and stimulation path (lower part). The feedback stimulation loop is closed around the CMOS-MEA and the FPGA. The components are described in detail in the text.
Figure 3
Figure 3
Example configurations of the event engine. Stitching together the appropriate set of modules allows the event engine to be configured to match a variety of patterns in order to trigger feedback stimulation. Different minimal examples are shown. (A) A DELAY element is inserted after a DETECTION module to trigger STIMULATION after a programmable delay. This configuration, with the delay set to zero, was used for the experiments shown in Figures 5, 7. (B) Either an event on channel A OR an event on channel B triggers stimulation. (C) In a programmable time window before and after an event on channel A, there may not be any event on channel B in order to trigger stimulation (trace C). (D) A RAND module propagates or discards the events, in this case with a probability of ½. (E) Events on channel A and channel B are fed through SPREAD modules into an AND module, which outputs events (on trace C), when both inputs are active. The intermediate trace C is fed into a SPREAD-1 module to trigger stimulation at the onset of the event. (F) When the event on channel B happens subsequently to an event on channel A, an event C is generated (G) An ACCU module is set to increment, when either an event on channel A OR channel B happened, and to decrement, when a delayed event from channel B (trace C) arrived. In this example, the ACCU threshold is set to three events. Once the threshold is reached, the internal counter gets reset to zero. When the three input events happen shortly after each other, a stimulation event gets emitted. As shown in the example, the delayed channel B (trace C) decrements the accumulator and thus delays or prohibits crossing of the threshold. (H) All modules can be combined together to achieve almost arbitrarily complex pattern matching. For example, this configuration was used to match the pattern of Figure 6. The formula describing this pattern is: STIMULATION(1, SPREAD-1(AND(AND(SPREAD(2 ms, A), SPREAD(2 ms, B)), SPREAD(2 ms, C)))).
Figure 4
Figure 4
Identification of directly evocable action potentials. (A) Data recorded in response to repeated stimulation of one electrode (black cross) from the whole 2 × 1.75 mm2 sensor area of the CMOS-MEA (each pixel is one electrode). Recording electrode configurations were scanned across the array in sets of 126 electrodes at a time. For every configuration, data were recorded for 12 ms after stimulation onset. The amplitude of the negative voltage peak within these 12 ms is color-coded and clipped at –100 μV. Blue indicates the detection of directly evoked somatic action potentials. (B) Example traces from 11 somas and the stimulation pulse are shown on the right. Traces from 30 stimulation trials are overlaid, with the median trace highlighted in black. The stimulation artifact was blanked prior to recording. Numbers are ordered by increasing distance from the stimulation site.
Figure 5
Figure 5
Feedback stimulation performance. One hundred and twenty-eight traces from a closed-loop stimulation sequence are aligned at the stimulation onset-time and overlaid. Traces in red show the trigger spikes with the median over all trigger traces shown in bold red. The stimulation artifact is grayed-out for better visual clarity. The traces in black show spikes, elicited in all but four cases after stimulation. The median over all elicited traces is shown in bold white. The antidromic propagation delay for the elicited spikes was around 0.85 ms. The different timings, detection delay, stimulation delay, and antidromic propagation delay sum up to the full loop delay of 1.25 ms.
Figure 6
Figure 6
Pattern-matching feedback stimulation. Electrode traces were recorded from neurons sitting on three different electrodes N1–N3 while performing pattern matching. The pattern was matched 22 times within 12 min, all overlaid and drawn in light-gray color. One arbitrary pattern is highlighted with black traces. The 12 ms before and 4 ms after stimulation pulse are shown. The orange, green, and blue colored boxes represent the spread-out-windows set in the event engine. A yellow box of arbitrary width is drawn around the elicited activity of neuron NE. Above the traces, negative peak times are marked with black vertical bars, showing spikes clustered within the colored boxes. The figure on the right shows electrode locations and the timings making up the pattern to match as well as the antidromic propagation delay of 2 ms to the elicited neuron.
Figure 7
Figure 7
Cross-correlation analysis. Three descriptive cases of changes in correlated firing between trigger neurons and elicited neurons. Spontaneous activity was recorded 1 h before and 1 h after the application of closed-loop feedback stimulation. Periods, where the difference exceeded a confidence bound (see text), were assigned to be significant and are indicated with an orange bar. The 95% confidence intervals are indicated with black dashed lines. Cross-correlation is computed based on trains with 9000–13000 spikes per neuron. (A) Relative probability remained constant, but the timing between trigger neuron and elicited neuron changed and became more synchronous. (B) The elicited neuron became more likely to fire in concert with the trigger neuron. (C) Relative timing within a network burst changed.
Figure 8
Figure 8
Schematic of an acausal stimulation sequence. (A) Spontaneous activity before application of the closed-loop. Shown spike traces are the median waveform of several spikes aligned at the negative peak. Top: Spike trace of the trigger neuron, A, in green. Middle: Example spike trace of a correlated neuron, B, drawn in yellow. The time delay between the plotted spikes of neuron A and neuron B was chosen to align with the maximum peak of the cross-correlation curve. Bottom: Cross-correlation curve of spike-times of neuron B with respect to neuron A. 95% confidence intervals are drawn with dotted red lines. Cross-correlations were computed with trains having 2000–3000 spikes. Significantly elevated correlated activity of neuron B can be detected around 2.4 ± 0.4 ms after neuron A fired an action potential. (B) Same situation as in (A) but with a closed-loop feedback stimulation applied. Due to the low-latency loop, the time delay of the yellow spikes with respect to the green ones was reduced by about 1.3 ms. For neuron A, the trace was zeroed at the start of the stimulation pulse. (C) Same as (A) but after the application of the closed-loop feedback stimulation. The cross-correlation no longer shows a significant peak for latencies larger than zero. The time delay between the plotted spikes of neuron A and neuron B was again chosen to align with the maximum peak of the cross-correlation. (D) Geometric sketch of the situation. The trigger neuron A and its axon are shown in green and the elicited neuron B in yellow. (E) Comparison of the two cross-correlation curves before (black) and after (red) the acausal stimulation with their 95% confidence intervals.

Similar articles

Cited by

References

    1. Abeles M., Gerstein G. L. (1988). Detecting spatiotemporal firing patterns among simultaneously recorded single neurons. J. Neurophysiol. 60, 909–924 - PubMed
    1. Azin M., Guggenmos D. J., Barbay S., Nudo R. J., Mohseni P. (2011). A battery-powered activity-dependent intracortical microstimulation ic for brain-machine-brain interface. IEEE J. Solid-State Circ. 46, 731–745
    1. Bakkum D. J., Chao Z. C., Potter S. M. (2008a). Long-term activity-dependent plasticity of action potential propagation delay and amplitude in cortical networks. PLoS ONE 3:e2088 10.1371/journal.pone.0002088 - DOI - PMC - PubMed
    1. Bakkum D. J., Chao Z. C., Potter S. M. (2008b). Spatio-temporal electrical stimuli shape behavior of an embodied cortical network in a goal-directed learning task. J. Neural Eng. 5, 310–323 10.1088/1741-2560/5/3/004 - DOI - PMC - PubMed
    1. Berdondini L., Imfeld K., Maccione A., Tedesco M., Neukom S., Koudelka-Hep M., et al. (2009). Active pixel sensor array for high spatio-temporal resolution electrophysiological recordings from single cell to large scale neuronal networks. Lab Chip 9, 2644–2651 10.1039/b907394a - DOI - PubMed