. 2013 Jan 11:4:9.
doi: 10.3389/fnsyn.2012.00009. eCollection 2012.

Intrinsic variability in Pv, RRP size, Ca(2+) channel repertoire, and presynaptic potentiation in individual synaptic boutons

Affiliations

Intrinsic variability in Pv, RRP size, Ca(2+) channel repertoire, and presynaptic potentiation in individual synaptic boutons

Pablo Ariel et al. Front Synaptic Neurosci. .

Abstract

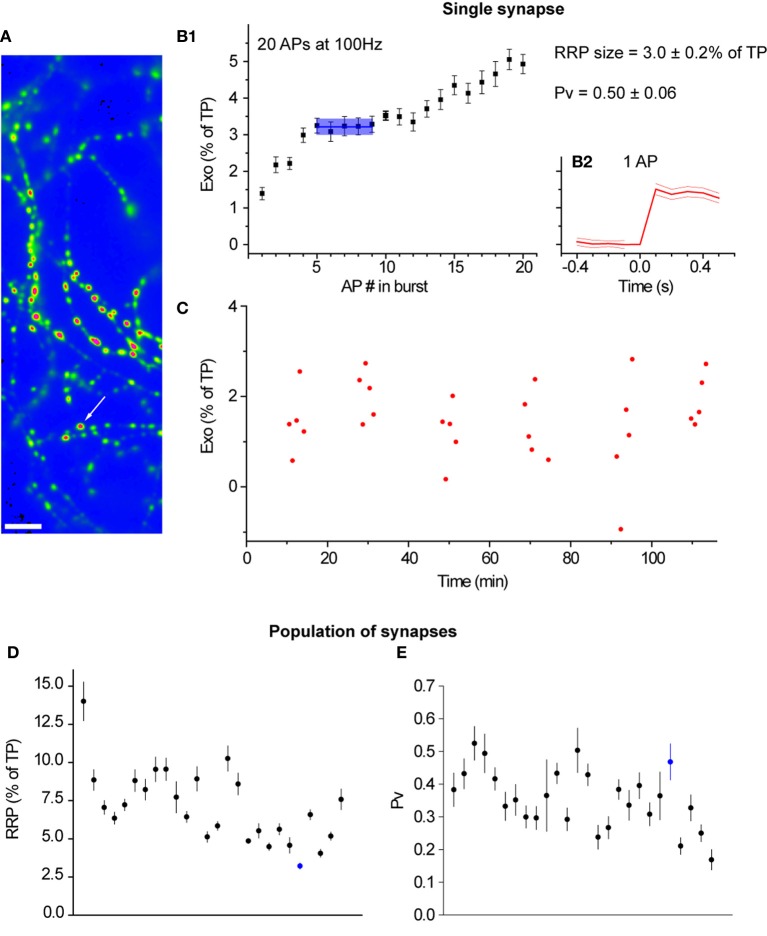
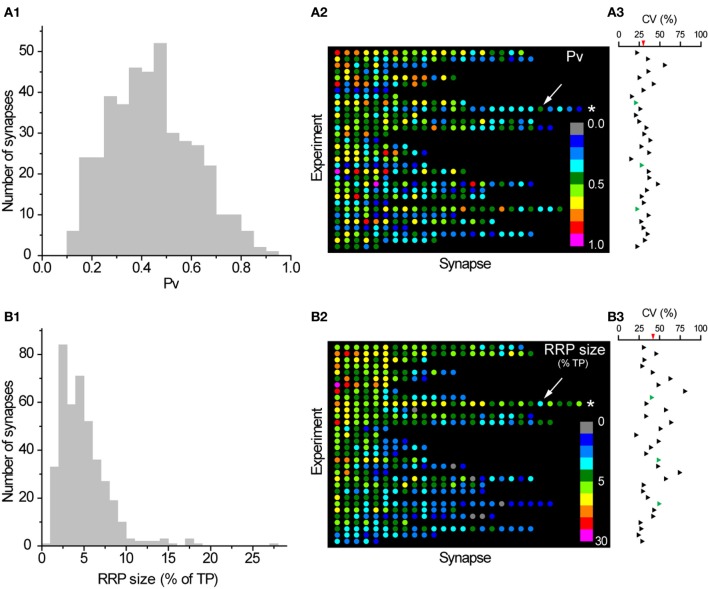
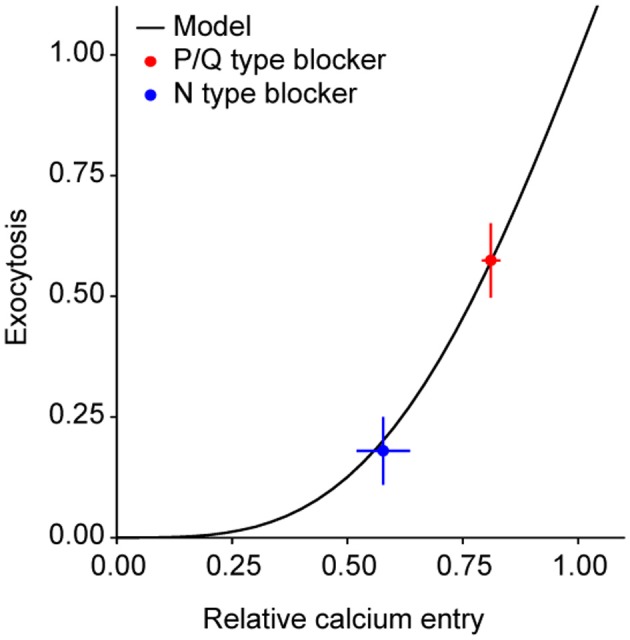
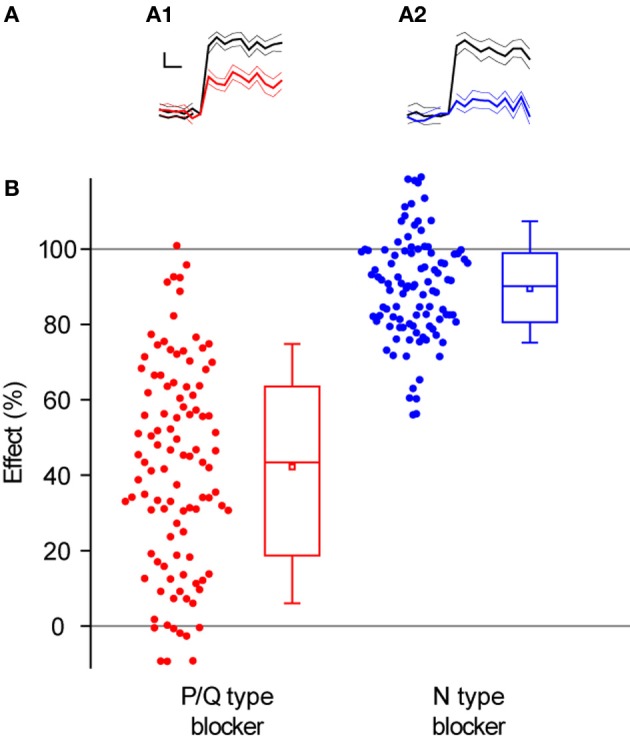
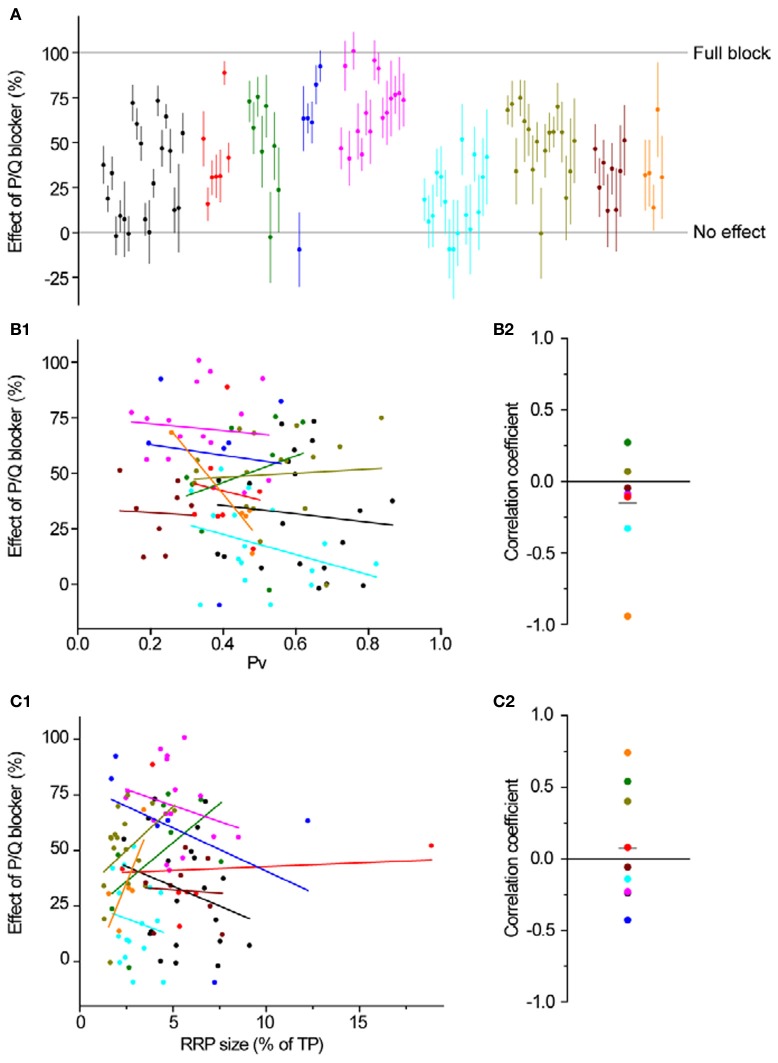
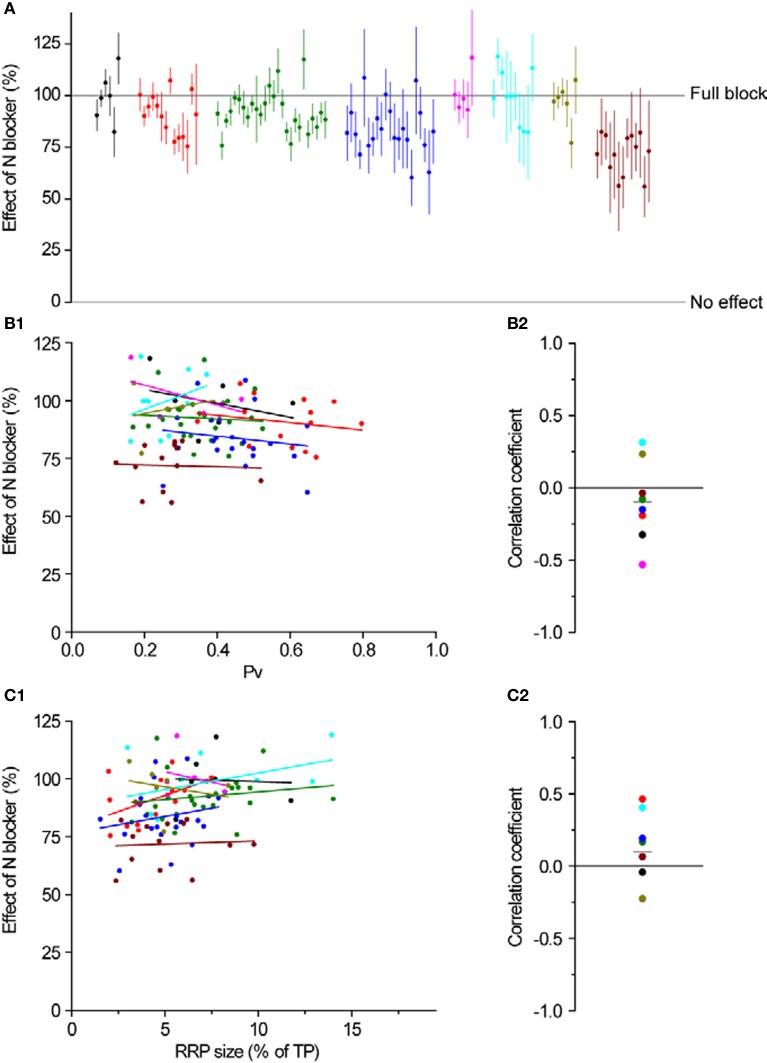
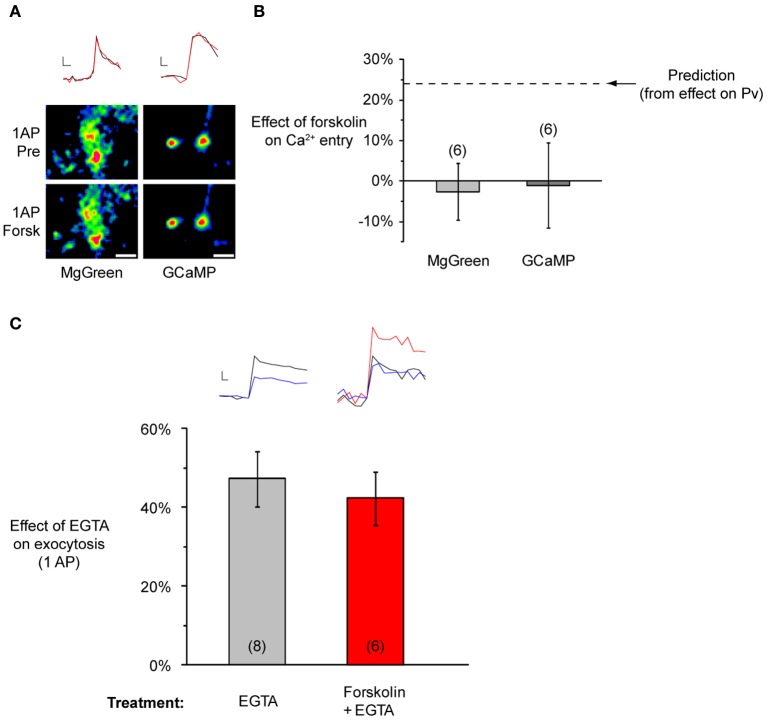
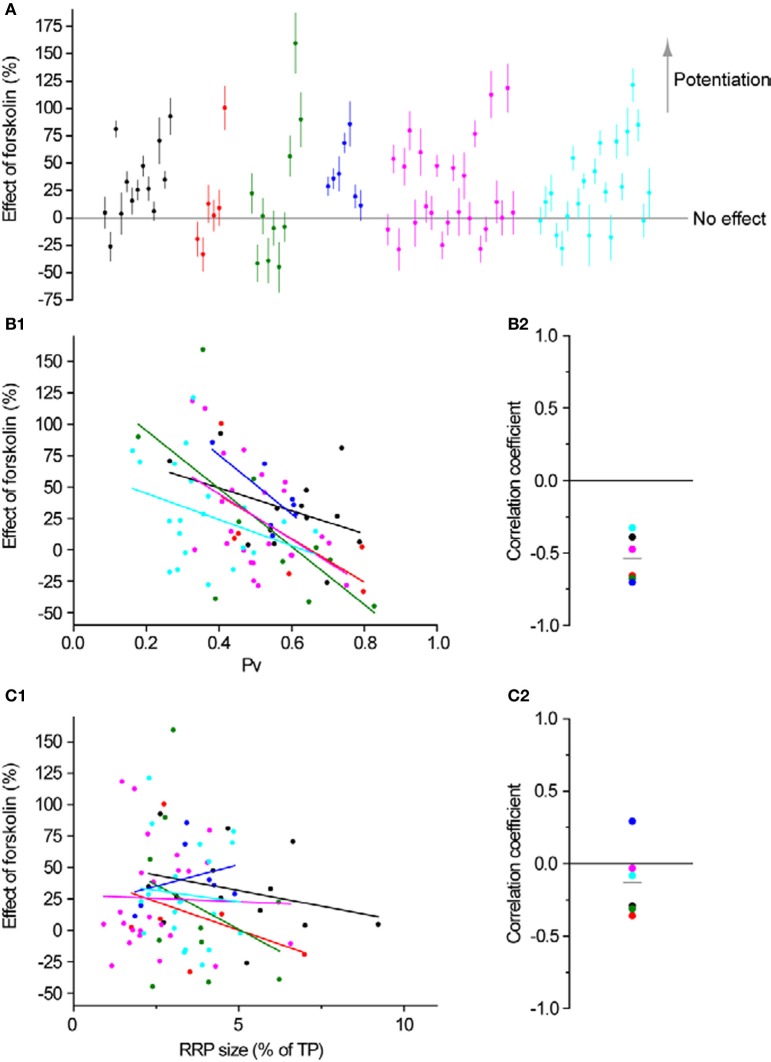
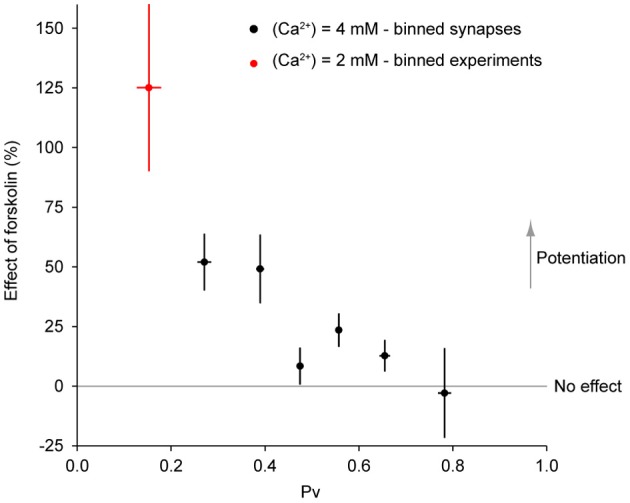
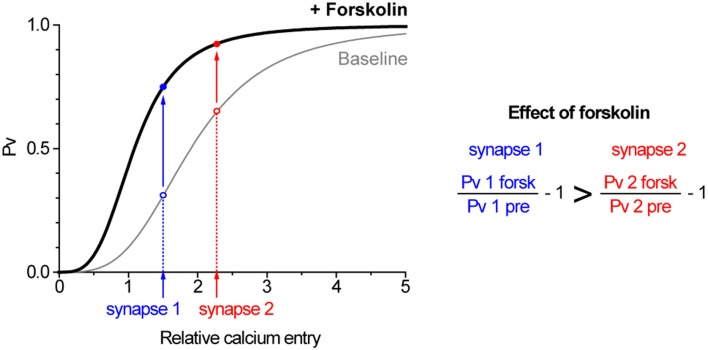
The strength of individual synaptic contacts is considered a key modulator of information flow across circuits. Presynaptically the strength can be parsed into two key parameters: the size of the readily releasable pool (RRP) and the probability that a vesicle in that pool will undergo exocytosis when an action potential fires (Pv). How these variables are controlled and the degree to which they vary across individual nerve terminals is crucial to understand synaptic plasticity within neural circuits. Here we report robust measurements of these parameters in rat hippocampal neurons and their variability across populations of individual synapses. We explore the diversity of presynaptic Ca(2+) channel repertoires and evaluate their effect on synaptic strength at single boutons. Finally, we study the degree to which synapses can be differentially modified by a known potentiator of presynaptic function, forskolin. Our experiments revealed that both Pv and RRP spanned a large range, even for synapses made by the same axon, demonstrating that presynaptic efficacy is governed locally at the single synapse level. Synapses varied greatly in their dependence on N or P/Q type Ca(2+) channels for neurotransmission, but there was no association between specific channel repertoires and synaptic efficacy. Increasing cAMP concentration using forskolin enhanced synaptic transmission in a Ca(2+)-independent manner that was inversely related with a synapse's initial Pv, and independent of its RRP size. We propose a simple model based on the relationship between Pv and calcium entry that can account for the variable potentiation of synapses based on initial probability of vesicle fusion.

Keywords: exocytosis; imaging; pHluorin; readily releasable pool; release probability; synapse.


Figures

Figure 1
Figure 1
Pv and RRP size can be measured precisely at many individual synapses in parallel. (A) Field of boutons in a representative experiment. The image is the difference in fluorescence before and after the application of 50 mM NH4Cl and is smoothed for presentation purposes only. The arrow marks the synapse shown in detail in the rest of the figure. Scale bar = 5 μm. (B1) Cumulative exocytosis in response to 20 APs at 100 Hz for the indicated synapse (n = 12 trials). The blue line indicates the RRP size. The light blue shading indicates the region where a plateau, indicative of exhaustion of the RRP, was detected using our methods, along with the SE in the RRP size (see Materials and Methods). (B2) Exocytosis in response to a single action potential. The thick red line indicates an average over 30 trials. The thin red lines show the SE of this average. The vertical scale is the same as in (B1) and is aligned with that panel for convenience. (C) Responses to single APs for the indicated synapse. Note the stability in the response throughout almost 2 h of imaging. (D) RRP size and (E) Pv respectively for 26 synapses in this experiment that passed our filtering criteria (see Materials and Methods). Each point corresponds to an individual synapse. Synapses are ordered in both panels according to their single AP responses (as fraction of TP) from highest (left) to lowest (right). The synapse marked in blue is the one analyzed in (B1), (B2), and (C).
Figure 2
Figure 2
Large variation in Pv and RRP size between individual synapses. (A1) Histogram of Pv across synapses (a synapse with 1.1 ± 0.2 was excluded for convenience of presentation). (A2) Color map of Pv values in all synapses included in our analysis. Each row in this plot represents a single experiment and each dot within that row a single synapse from that experiment. Synapses are colored according to their Pv with cold colors representing low Pv values and warm colors representing high Pv values. The inset shows the Pv color scale. Synapses within each experiment are ranked according to their average response to a single AP (as % of TP) from left (highest) to right (lowest). Experiments are ordered according to their average synaptic response to a single AP from top (highest) to bottom (lowest). The asterisk highlights the experiment shown in Figure 1 and the arrow indicates the synapse shown in more detail in Figures (1B,C). (A3) The CVs in Pv values for each experiment are shown aligned with the corresponding row in (A2). The average CV in Pv across experiments is shown as a red triangle in the scale bar. Three experiments where all synapses belonged to the same axon are shown in green. (B1–B3) Histogram, color map, and CVs within each experiment of RRP size (as % TP), analogous to (A1–A3). Synapses in (B2) are ordered identically to (A2) so a dot in the equivalent position on the color maps represents the same synapse, while equivalent rows represent the same experiment. Note that the scaling of colors coding RRP sizes is logarithmic.
Figure 3
Figure 3
P/Q and N-type Ca2+ channels do not differ in their coupling to primed synaptic vesicles. Exocytosis as a function of the relative Ca2+ entry in response to 1 AP. The model is from a fit to exocytosis vs. Ca2+ entry data in a previous publication [Figure 2C in Ariel and Ryan (2010)]. For convenience, exocytosis and Ca2+ have been renormalized to the expected values for 1 AP at 4 mM extracellular Ca2+. Note the good agreement between the model and the data in the presence of toxins.
Figure 4
Figure 4
Block of P/Q-type Ca2+ channels leads to weaker and more variable decrease of exocytosis than block of N-type Ca2+ channels. (A) Representative single synapse responses to 1 AP stimulus before and after the application of toxins that block Ca2+ channel subtypes. (A1) Response to 1 AP before (black) and after (red) applying ω-agatoxin IVA (effect of toxin = 45 ± 12%). (A2) Response to 1 AP before (black) and after (blue) applying of ω-conotoxin GVIA (effect of toxin = 81 ± 11%). Each trace in (A1) and (A2) is an average of 30 trials with the thinner lines representing the SEs. Traces are normalized to the size of the response before applying the corresponding toxin and shown on the same scale. Scale bar: 0.2 s and 20% of pre-toxin response. (B) Effect of P/Q and N-type Ca2+ channel blockers across all synapses. The effect of a toxin is defined as the percentage decrease in single AP responses. Each dot corresponds to one synapse. Box whisker plots show the median (line), mean (point), 25–75 percentile (box), and 10–90 percentile (whisker) ranges (n = 103 synapses from 9 experiments for P/Q-type blocker, 101 synapses from 8 experiments for N-type blocker).
Figure 5
Figure 5
P/Q-type Ca2+ channel distribution is independent of Pv and RRP size. (A) The effect of ω-agatoxin IVA on exocytosis in response to a single AP. Different colors represent individual experiments, while each dot shows the effect of the blocker on a single synapse (with its SE). Experiments are ordered according to their responses to an individual AP from highest (left) to lowest (right). Within an experiment, synapses are also sorted from most (left) to least responsive (right). (B1,B2) Effect of a P/Q blocker is independent of Pv. (B1) Each dot is a synapse and the coloring scheme is the same as in (A). Lines represent best fits for each experiment, colored accordingly. (B2) Correlation coefficients of the effect of P/Q block with Pv for were not significantly different from 0 (one-sample, two-tailed t-test against null hypothesis μ = 0, P = 0.21, t-value = −1.36). Each dot represents the value of the correlation coefficient for 1 experiment, with colors consistent with the rest of the figure. The gray line represents the average correlation coefficient across experiments. (C1,C2) Effect of a P/Q blocker is independent of RRP size. Coloring and symbols are analogous to (B1) and (B2). Correlation coefficients of the effect of P/Q block with RRP size for each experiment were not significantly different from 0 (one-sample, two-tailed t-test against null hypothesis μ = 0, P = 0.60, t-value = 0.55).
Figure 6
Figure 6
N-type Ca2+ channel distribution is independent of Pv and RRP size. (A) The effect of ω-conotoxin GVIA on exocytosis in response to a single AP. Different colors represent individual experiments, while each dot shows the effect of the blocker on a single synapse (with its SE). Experiments are ordered according to their responses to an individual AP from highest (left) to lowest (right). Within an experiment, synapses are also sorted from most (left) to least responsive (right). (B1,B2) Effect of an N blocker is independent of Pv. (B1) Each dot is a synapse and the coloring scheme is the same as in (A). Lines represent best fits for each experiment, colored accordingly. (B2) Correlation coefficients of the effect of N block with Pv for each experiment were not significantly different from 0 (one-sample, two-tailed t-test against null hypothesis μ = 0, P = 0.36, t-value = −0.98). Each dot represents the value of the correlation coefficient for 1 experiment, with colors consistent with the rest of the figure. The gray line represents the average correlation coefficient across experiments. (C1,C2) Effect of an N blocker is independent of RRP size. Coloring and symbols are analogous to (B1) and (B2). Correlation coefficients of the effect of N block with RRP size for each experiment were not significantly different from 0 (one-sample, two-tailed t-test against null hypothesis μ = 0, P = 0.32, t-value = 1.08).
Figure 7
Figure 7
Forskolin does not affect calcium entry or coupling between Ca2+ and primed vesicles. (A) Representative experiments showing no effect of forskolin on Ca2+ entry. Top: Sample traces from a MgGreen (left) or GCaMP3 (right) experiment before (black) and after forskolin (red). Scale bar MgGreen: 20% of baseline peak, 25 ms. Scale bar GCaMP3: 20% baseline peak, 50 ms. Bottom: Representative responsive regions from each experiment. Each set of images corresponds to a subset of responsive regions included in the analysis. Images are averages of single AP difference images (n = 10 trials for MgGreen, n = 30 trials for GCaMP3), smoothed for presentation purposes only. Scale bar = 2 μm. (B) No effect on single AP Ca2+ entry, measured with MgGreen or GCAMP3 with 2 mM extracellular Ca2+. The dashed line indicates the predicted effect if forskolin's action on Pv were entirely through an increase in Ca2+ entry. (C) Forskolin does not change the effect of EGTA on single AP exocytosis (EGTA-AM applied for 90 s at 100 μM and washed for 10 min). Inset at top left: Sample traces from a single experiment before (black) and after a pulse of EGTA-AM (blue). Inset at top right: Sample traces from a single experiment in baseline conditions (black), after forskolin (red), and after adding pulse of EGTA-AM to the forskolin solution (blue). Scale bar MgGreen: 20% of pre forskolin peak, 10 ms.
Figure 8
Figure 8
Synapses are differentially modulated by forskolin according to their baseline Pv. (A) Effect of forskolin on exocytosis in response to a single AP. Different colors represent individual experiments, while each dot shows the effect of the drug on a single synapse with its SE. Experiments are ordered according to their responses to an individual AP from highest (left) to lowest (right). Within an experiment, synapses are also sorted from most (left) to least responsive (right). (B1,B2) Effect of forskolin is negatively correlated with Pv. (B1) Each dot is a synapse and the coloring scheme is the same as in (A). Lines represent best fits for each experiment, colored accordingly. (B2) There is a negative correlation between the effect of forskolin and Pv (one-sample two-tailed t-test against null hypothesis μ = 0 for Pearson correlation coefficients, P = 0.0004, t-value = −8.17). Each dot represents the value of the correlation coefficient for 1 experiment, with colors consistent with the rest of the figure. The gray line represents the average correlation coefficient across experiments. (C1,C2) Effect of forskolin is independent of RRP size. Coloring and symbols are analogous to (B1) and (B2). Correlation coefficients of the effect of forskolin with RRP size for each experiment were not significantly different from 0 (one-sample two-tailed t-test against null hypothesis μ = 0, P = 0.25, t-value = −1.31).
Figure 9
Figure 9
The effect of forskolin on exocytosis in response to a single action potential is negatively correlated with Pv. Combined data with 4 mM extracellular Ca2+ (Figure 8B1, binned across synapses) and 2 mM extracellular Ca2+ (see text, binned across experiments) shows an inverse relationship between initial Pv and the effect of forskolin (ρ = −0.88, P = 0.009).
Figure 10
Figure 10
A simple model can explain how forskolin has a greater effect on synapses with lower Pv. The graph illustrates two synapses with differing Ca2+ entry in response to single AP (synapse 2 > synapse 1) in which primed vesicles have the same fusogenicity (gray curve). When forskolin is applied, the fusogenicity of primed vesicles increases equally in both synapses (black curve, shifted left) such that they increase their Pv (solid arrows). However, synapse 1, with an initially lower Pv, exhibits a larger increase. The baseline curve is the measured Hill relationship between Ca2+ and exocytosis (Ariel and Ryan, 2010), whereas the effect of forskolin is modeled as a leftward shift due to a 50% reduction in the Km of that relationship (see Discussion).

References

    1. Ariel P., Ryan T. A. (2010). Optical mapping of release properties in synapses. Front. Neural Circuits 4:18 10.3389/fncir.2010.00018 - DOI - PMC - PubMed
    1. Ariel P., Ryan T. A. (2012). New insights into molecular players involved in neurotransmitter release. Physiology (Bethesda) 27, 15–24 10.1152/physiol.00035.2011 - DOI - PMC - PubMed
    1. Armbruster M., Ryan T. A. (2011). Synaptic vesicle retrieval time is a cell-wide rather than individual-synapse property. Nat. Neurosci. 14, 824–826 10.1038/nn.2828 - DOI - PMC - PubMed
    1. Balaji J., Ryan T. A. (2007). Single-vesicle imaging reveals that synaptic vesicle exocytosis and endocytosis are coupled by a single stochastic mode. Proc. Natl. Acad. Sci. U.S.A. 104, 20576–20581 10.1073/pnas.0707574105 - DOI - PMC - PubMed
    1. Branco T., Marra V., Staras K. (2010). Examining size-strength relationships at hippocampal synapses using an ultrastructural measurement of synaptic release probability. J. Struct. Biol. 172, 203–210 10.1016/j.jsb.2009.10.014 - DOI - PMC - PubMed

LinkOut - more resources