. 2011;5(1):364-380.
doi: 10.1214/10-AOAS389SUPP.

LATENT RANK CHANGE DETECTION FOR ANALYSIS OF SPLICE-JUNCTION MICROARRAYS WITH NONLINEAR EFFECTS

Affiliations

LATENT RANK CHANGE DETECTION FOR ANALYSIS OF SPLICE-JUNCTION MICROARRAYS WITH NONLINEAR EFFECTS

Jonathan Gelfond et al. Ann Appl Stat. 2011.

Abstract

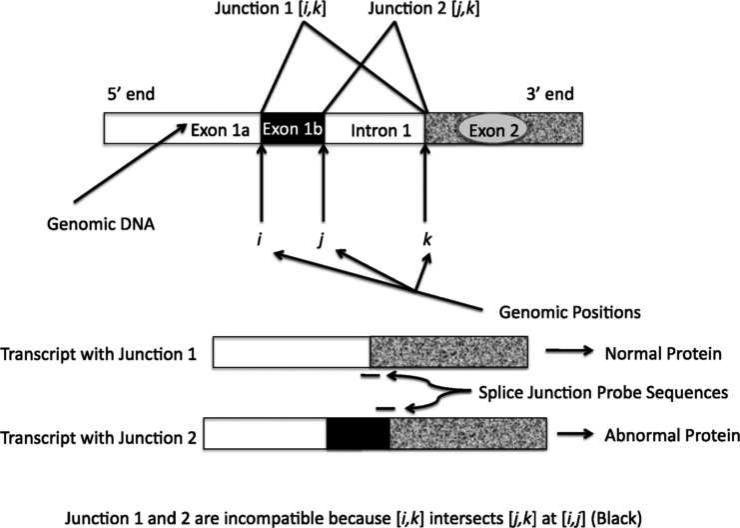
Alternative splicing of gene transcripts greatly expands the functional capacity of the genome, and certain splice isoforms may indicate specific disease states such as cancer. Splice junction microarrays interrogate thousands of splice junctions, but data analysis is difficult and error prone because of the increased complexity compared to differential gene expression analysis. We present Rank Change Detection (RCD) as a method to identify differential splicing events based upon a straightforward probabilistic model comparing the over- or underrepresentation of two or more competing isoforms. RCD has advantages over commonly used methods because it is robust to false positive errors due to nonlinear trends in microarray measurements. Further, RCD does not depend on prior knowledge of splice isoforms, yet it takes advantage of the inherent structure of mutually exclusive junctions, and it is conceptually generalizable to other types of splicing arrays or RNA-Seq. RCD specifically identifies the biologically important cases when a splice junction becomes more or less prevalent compared to other mutually exclusive junctions. The example data is from different cell lines of glioblastoma tumors assayed with Agilent microarrays.


Figures

Fig. 1
Fig. 1
Schematic of splicing process, incompatible junctions and junction probes. The gene is shown at the top. The splicing process has two possibilities. First, remove exon 1b (Black) and intron 1. The fusion between exons 1a and 2 results in Junction 1. Second, only remove intron 1 while retaining exon 1b. The fusion between exons 1b and 2 results in Junction 2. The retention of exon 1b is translated into an abnormal protein, and higher fluorescence of the Junction 2 probe relative to the Junction 1 probe indicates this abnormality.
Fig. 2
Fig. 2
(A) Example of sigmoidal response of microarray Intensity: Two incompatible isoforms A and B present in 1:2 a ratio at high (++) and low (+) levels of overall gene expression. Notice that the intensity difference between the two isoforms is narrowed considerably in lower concentration despite the constant concentration ratio of 2:1. Models assuming linearity could falsely estimate that the ratio of isoforms had narrowed from 2:1 to closer to 1:1. (B) Rank Changes of isoform intensity are invariant under monotonic transformation. There are two incompatible isoforms A and B present in normal (N), cancer (C). Isoform A is more prevalent in cancer, while isoform B is more prevalent in normal. The proposed method identifies such changes in prevalence rankings of isoforms. The mean intensities are shown on the vertical axis as μtj.
Fig. 3
Fig. 3
Difference vs Average plot for splice junctions of theVIM gene. Each point is the average value of a specific junction. The horizontal axis is the estimate of the mean junction intensity 12(μ^Cj+μ^Nj), and the vertical axis is the estimate of the mean junction differences (μ^Cjμ^Nj). Note the substantial nonlinear effect apparent in the parabolic trend. This invalidates algorithms based upon linearity such as ANSOVA likely resulting in false positives.
Fig. 4
Fig. 4
A hypothetical experiment demonstrating that the posterior ranks of the means provide more evidence compared to the ranks of the raw observations. The 95% HPDs for the posterior means are drawn as ellipses. In both cases, the prevalence of Junction 2 is greater than Junction 1. In case 1, there are only 2 observations, but the posterior distribution strongly favors higher rank for Junction 1. However, this frequency of observed ranks would randomly occur 25% of the time. In case 2, there is > 95% posterior probability that Junction 2 has higher mean than Junction 1, even though the observed relative frequency that Junction 2 is greater than Junction 1 is only 75%. The accuracy of the evidence from the posterior depends upon parametric assumptions.
Fig. 5
Fig. 5
Splicing Probability vs differential expression Log Fold Change. (A) The ANOSVA model estimate of local false discovery rate for differential splicing (–log10 Posterior Probability of No DSE) has a strong dependency on differential expression fold change (| log Fold Change|). A spline curve is shown in red, and the mean –log10 lFDR of differential splicing is in blue. This indicates that the higher fold change for differential expression implies higher probability of differential splicing. The nonlinear effects within the microarray confound the hypotheses about splicing and differential expression. (B) The RCD model estimate for differential splicing probability has little dependency on overall changes in expression. A spline curve is shown in red, and the mean –log10 posterior probability of no differential splicing is in blue.

References

    1. Celotto A, Graveley B. Alternative splicing of the Drosophila Dscam pre-mRNA is both temporally and spatially regulated. Genetics. 2001;159:599–608. - PMC - PubMed
    1. Cheung HC, Baggerly KA, Tsavachidis S, Bachinski LL, Neubauer VL, Nixon TJ, Aldape KD, Cote GJ, Krahe R. Global analysis of aberrant pre-mRNA splicing in glioblastoma using exon expression arrays. BMC Genomics. 2008;9 article 216. - PMC - PubMed
    1. Cline M, Blume J, Cawley S, Clark T, Hu J, Lu G, Salomonis N, Wang H, Williams A. ANOSVA: A statistical method for detecting splice variation from expression data. Bioinformatics. 2005;21:I107–I115. - PubMed
    1. Cuperlovic-Culf M, Belacel N, Culf AS, Ouellette RJ. Microarray analysis of alternative splicing. Omics-A Journal of Integrative Biology. 2006;10:344–357. - PubMed
    1. Gaidatzis D, Jacobeit K, Oakeley E, Stadler M. Overestimation of alternative splicing caused by variable probe characteristics in exon arrays. Nucleic Acids Res. 2009;37:e107. - PMC - PubMed

LinkOut - more resources