

Health impacts of the July 2010 heat wave in Québec, Canada
- PMID: 23336593
- PMCID: PMC3554487
- DOI: 10.1186/1471-2458-13-56
Health impacts of the July 2010 heat wave in Québec, Canada
Abstract
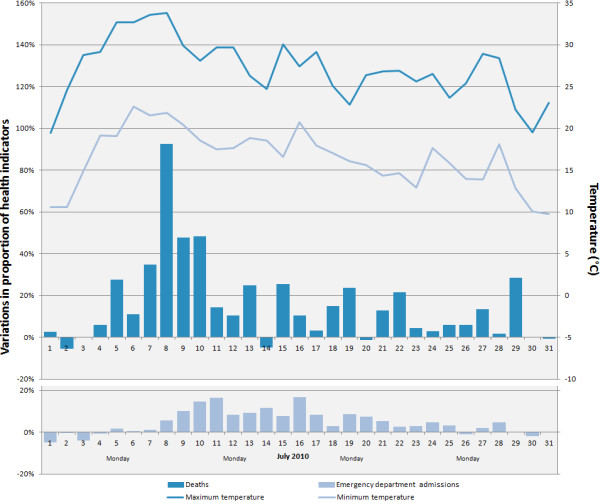
Background: One of the consequences of climate change is the increased frequency and intensity of heat waves which can cause serious health impacts. In Québec, July 2010 was marked by an unprecedented heat wave in recent history. The purpose of this study is to estimate certain health impacts of this heat wave.
Methods: The crude daily death and emergency department admission rates during the heat wave were analyzed in relation to comparison periods using 95% confidence intervals.
Results: During the heat wave, the crude daily rates showed a significant increase of 33% for deaths and 4% for emergency department admissions in relation to comparison periods. No displacement of mortality was observed over a 60-day horizon.
Conclusions: The all-cause death indicator seems to be sufficiently sensitive and specific for surveillance of exceedences of critical temperature thresholds, which makes it useful for a heat health-watch system. Many public health actions combined with the increased use of air conditioning in recent decades have contributed to a marked reduction in mortality during heat waves. However, an important residual risk remains, which needs to be more vigorously addressed by public health authorities in light of the expected increase in the frequency and severity of heat waves and the aging of the population.
Figures
References
-
- Intergovernmental Panel on Climate Change. Special report on managing the risks of extreme events and disasters to advance climate change adaptation: summary for policymakers. Cambridge University Press, Cambridge, UK; 2012. p. 19.
-
- Chaouki N. Climate Change & Health. World Health Organisation, Rabat; 2009. p. 34.
-
- Canada's top ten weather stories for 2010. [ http://www.ec.gc.ca/meteo-weather/default.asp?lang = En&n = 53E29740-1]
-
- Martel B, Giroux J-X, Gosselin P, Chebana F, Ouarda TBMJ, Charron C. Indicateurs et seuils météorologiques pour les systèmes de veille-avertissement lors de vagues de chaleur au Québec. Institut national de santé publique du Québec, Québec; 2010. p. 65.
Publication types
MeSH terms
LinkOut - more resources
Full Text Sources
Other Literature Sources
