. 2013 Jan 21;10(1):7.
doi: 10.1186/2045-8118-10-7.

Live cell imaging techniques to study T cell trafficking across the blood-brain barrier in vitro and in vivo

Affiliations

Live cell imaging techniques to study T cell trafficking across the blood-brain barrier in vitro and in vivo

Caroline Coisne et al. Fluids Barriers CNS. .

Abstract

Background: The central nervous system (CNS) is an immunologically privileged site to which access for circulating immune cells is tightly controlled by the endothelial blood-brain barrier (BBB) located in CNS microvessels. Under physiological conditions immune cell migration across the BBB is low. However, in neuroinflammatory diseases such as multiple sclerosis, many immune cells can cross the BBB and cause neurological symptoms. Extravasation of circulating immune cells is a multi-step process that is regulated by the sequential interaction of different adhesion and signaling molecules on the immune cells and on the endothelium. The specialized barrier characteristics of the BBB, therefore, imply the existence of unique mechanisms for immune cell migration across the BBB.

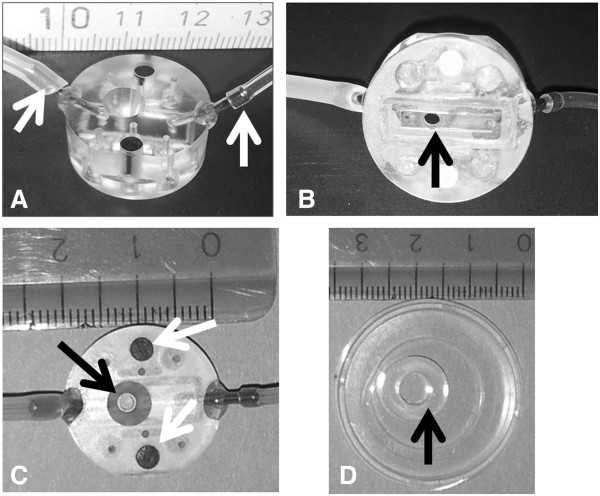
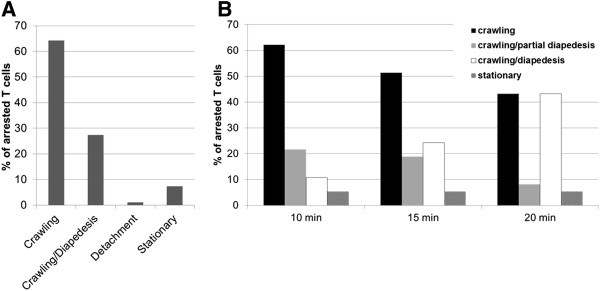
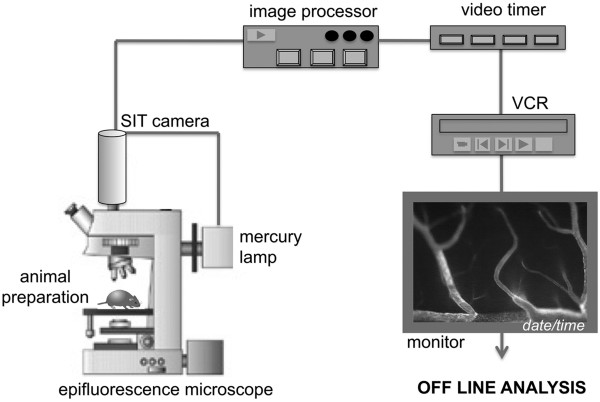
Methods and design: An in vitro mouse BBB model maintaining physiological barrier characteristics in a flow chamber and combined with high magnification live cell imaging, has been established. This model enables the molecular mechanisms involved in the multi-step extravasation of T cells across the in vitro BBB, to be defined with high-throughput analyses. Subsequently these mechanisms have been verified in vivo using a limited number of experimental animals and a spinal cord window surgical technique. The window enables live observation of the dynamic interaction between T cells and spinal cord microvessels under physiological and pathological conditions using real time epifluorescence intravital imaging. These in vitro and in vivo live cell imaging methods have shown that the BBB endothelium possesses unique and specialized mechanisms involved in the multi-step T cell migration across this endothelial barrier under physiological flow. The initial T cell interaction with the endothelium is either mediated by T cell capture or by T cell rolling. Arrest follows, and then T cells polarize and especially CD4+ T cells crawl over long distances against the direction of flow to find the rare sites permissive for diapedesis through the endothelium.

Discussion: The sequential use of in vitro and in vivo live cell imaging of T cells interacting with the BBB allows us to delineate the kinetics and molecular determinants involved in multistep extravasation of encephalitogenic T cells across the BBB.


Figures

Figure 1
Figure 1
The in vitro flow chamber. The flow chamber is shown from the side (A), from the base (B) and from the top (C). White arrows in panel A show the inlet and outlet tubes. Black arrows in panels B and C show the field of view. A rectangle within the thin silicon mat visible in panel B surrounds the inflow and the outflow and restricts medium flow to a small chamber 2 mm wide and 0.25 mm high. White arrows in panel C show the magnets embedded into the flow chamber to fix the chamber via a metal ring opposed on the base of the culture dish. The cloning ring shown with a diameter of 0.6 cm in image D restricts the surface area of brain endothelial cells to 0.28 cm2. Scale is in cm.
Figure 2
Figure 2
The migratory phenotype of T cells. Representative experiments of T cell interactions with TNF-α stimulated pMBMECs in vitro under flow conditions during a period of 15 minutes (2A) or for 3 different time periods of 10, 15 or 20 minutes (2B). The behavior of each arrested T cell was analyzed by eye in an offline analysis of the time-lapse videos and assigned to one category and expressed in percentage of initially arrested T cells. Arrested T cells that crawled into or out of the FOV during the recording time were excluded from the analysis. “Crawling”: T cells that polarized and crawled at least two T cell diameter distance but did not diapedese across the endothelium. “Crawling/partial diapedesis”: T cells that polarized, crawled and started but did not complete diapedesis during the indicated time period. “Crawling/Diapedesis”: T cells that polarized and crawled until they finally crossed the endothelial cell monolayer. “Detachment”: T cells that detached during the evaluation period. “Stationary”: T cells that did not polarize and remained stationary. 2A: Experiment imaged with 10x objective. A total of 64 cells were categorized. 2B: Experiment imaged with 20x objective. A total of 37 cells were categorized.
Figure 3
Figure 3
Experimental setup of the intravital fluorescence videomicroscopy workstation. The animal preparation under anesthesia is placed under an epifluorescence microscope, coupled with a mercury lamp connected to a low-light-imaging silicon-intensified target (SIT) camera that includes an image processor, associated videotimer, a digital videocassette recorder (VCR) and a video monitor. For later off-line analysis, real time videos were recorded using a digital videocassette.A: Evaluation of the initial contact fraction (%) of OT-I CD8+ T cells with the post capillary venules (20–60 μm diameter) of the spinal cord microvasculature of mice with EAE B: Shows the evaluation of capture and rolling fractions (%) of OT-I CD8+ T cells with the post capillary venules (20–60 μm diameter) of the spinal cord white matter microvasculature of mice afflicted with MOG35-55-induced EAE.
Figure 4
Figure 4
Quantification of OT-I CD8+T cell interactions with the spinal cord microvasculature in vivo. A: Evaluation of the initial contact fraction (%) of OT-I CD8+ T cells with the post capillary venules (20–60 μm diameter) of the spinal cord microvasculature of mice with EAE. Each dot represents 1 venule. All values show the median with the interquartile range of n = 22 analyzed post-capillary venules from 3 mice for rat IgG2b condition, n = 18 analyzed post-capillary venules from 5 mice for anti- α4β7 condition, n = 18 analyzed post-capillary venules from 6 mice for anti- β7 condition and n = 23 analyzed post-capillary venules from 4 mice for anti-α4 condition. B: Shows the evaluation of capture and rolling fractions (%) of OT-I CD8+ T cells with the post capillary venules (20–60 μm diameter) of the spinal cord white matter microvasculature of mice afflicted with MOG35-55-induced EAE. N = 22 analyzed post-capillary venules from 3 mice for rat IgG2b condition, n = 18 analyzed post-capillary venules from 5 mice for anti- α4β7 condition, n = 18 analyzed post-capillary venules from 6 mice for anti-β7 condition and n = 23 analyzed post-capillary venules from 4 mice for anti-α4 condition. Statistical significance was determined by the Mann–Whitney U-Test.
Figure 5
Figure 5
Quantification of OT-I CD8+T cell firm adhesion to the post capillary venules of the spinal cord microvasculature of C57BL/6 mice during EAE. Permanently adhering OT-I T cells were counted 10 min, 30 min and 1 hour after cell infusion. Each dot represents the number of adherent OT-I T cells/field of view (FOV). The numbers of mice analyzed at t = 10 min for each condition was n = 8 for rat IgG2b, n = 6 for anti-α4β7, n = 6 for anti-β7 and n = 8 for anti-α4. At t = 30, n = 8 for rat IgG2b, n = 6 for anti-α4β7, n = 6 for anti-β7 and n = 4 for anti-α4. At time t = 1 h, the number of mice was n = 7 for rat IgG2b, n = 5 for anti-α4β7, n = 5 mice for anti-β7 and n = 5 for anti-α4. Data are presented as mean values +/− standard deviation (SD). Mann–Whitney U-Test was used for comparisons between different data sets. Asterisks indicate significant differences (*P < 0.05, and ***P < 0.005), n.s.: not significant.

References

    1. Engelhardt B, Ransohoff RM. Capture, crawl, cross: the T cell code to breach the blood–brain barriers. Trends Immunol. 2012;33:579–589. doi: 10.1016/j.it.2012.07.004. - DOI - PubMed
    1. Lassmann H. Chronic relapsing experimental allergic encephalomyelitis: its value as an experimental model for multiple sclerosis. J Neurol. 1983;229:207–220. doi: 10.1007/BF00313549. - DOI - PubMed
    1. Nourshargh S, Hordijk PL, Sixt M. Breaching multiple barriers: leukocyte motility through venular walls and the interstitium. Nat Rev Mol Cell Biol. 2010;11:366–378. doi: 10.1038/nrm2889. - DOI - PubMed
    1. Ley K, Laudanna C, Cybulsky MI, Nourshargh S. Getting to the site of inflammation: the leukocyte adhesion cascade updated. Nat Rev Immunol. 2007;7:678–689. doi: 10.1038/nri2156. - DOI - PubMed
    1. Steiner O, Coisne C, Cecchelli R, Boscacci R, Deutsch U, Engelhardt B, Lyck R. Differential roles for endothelial ICAM-1, ICAM-2, and VCAM-1 in shear-resistant T cell arrest, polarization, and directed crawling on blood–brain barrier endothelium. J Immunol. 2010;185:4846–4855. doi: 10.4049/jimmunol.0903732. - DOI - PubMed