. 2013 Jan 21;200(2):203-18.
doi: 10.1083/jcb.201211119.

Elevated polar ejection forces stabilize kinetochore-microtubule attachments

Affiliations

Elevated polar ejection forces stabilize kinetochore-microtubule attachments

Stuart Cane et al. J Cell Biol. .

Abstract

Chromosome biorientation promotes congression and generates tension that stabilizes kinetochore-microtubule (kt-MT) interactions. Forces produced by molecular motors also contribute to chromosome alignment, but their impact on kt-MT attachment stability is unclear. A critical force that acts on chromosomes is the kinesin-10-dependent polar ejection force (PEF). PEFs are proposed to facilitate congression by pushing chromosomes away from spindle poles, although knowledge of the molecular mechanisms underpinning PEF generation is incomplete. Here, we describe a live-cell PEF assay in which tension was applied to chromosomes by manipulating levels of the chromokinesin NOD (no distributive disjunction; Drosophila melanogaster kinesin-10). NOD stabilized syntelic kt-MT attachments in a dose- and motor-dependent manner by overwhelming the ability of Aurora B to mediate error correction. NOD-coated chromatin stretched away from the pole via lateral and end-on interactions with microtubules, and NOD chimeras with either plus end-directed motility or tip-tracking activity produced PEFs. Thus, kt-MT attachment stability is modulated by PEFs, which can be generated by distinct force-producing interactions between chromosomes and dynamic spindle microtubules.


Figures

Figure 1.
Figure 1.
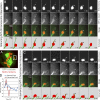
NOD-mCherry–expressing cells do not form a well-defined metaphase plate. (A–D) Two-color confocal imaging of GFP–α-tubulin (green)– and NOD-mCherry (red)–expressing S2 cells. (A) Selected frames from a time lapse of a cell with a pair of sister chromatids that are attached to the same pole (arrow). The aberrant attachment state persists and anaphase onset (AO) ensues without error correction. See Video 1. (B and C) Chromosomes move away from the poles but fail to align along a well-defined metaphase plate, particularly in cells expressing high levels of NOD-mCherry. See Video 2. (D) Selected micrographs from a time lapse of a NOD-mCherry–expressing cell as it progresses through mitosis. A mixture of attachment states are established within the first 10 min of nuclear envelope breakdown and persist until the cell enters anaphase with uncorrected syntelic attachments, resulting in chromosome mis-segregation and multiple nuclei. See Video 3. Bars, 10 µm.
Figure 2.
Figure 2.
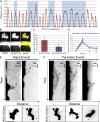
NOD-mCherry expression stabilizes syntelic attachments. (A, B, E, and F) Two-color confocal imaging of Ndc80-GFP (green)– and NOD-mCherry (red)–expressing S2 cells. (A) Selected frames from a confocal time lapse of a cell with both bioriented (B) and syntelic (S) attachments (approximate pole positions are marked with asterisks). Note that the syntelic attachments persist for the duration of the time lapse. See Video 4. (B) Selected confocal Z-sections showing a combination of syntelic and bioriented kinetochore pairs in the same cell. The mCherry fluorescence intensity for each cell was quantified from the maximum intensity projection of the Z-sections (rightmost panel). (C) Plotting the percentage of syntelic attachments versus NOD-mCherry fluorescence reveals that NOD-mCherry stabilizes syntelic attachments in a dose-dependent fashion (n = 60 cells). Inset shows the mean percentage of syntelic attachments found in monopolar spindles assembled in the absence of Klp61F. (D) Syntelic stabilization by NOD-mCherry requires the motor domain of NOD (NOD, n = 57 cells; motorless NOD, n = 70 cells). (E and F) Maximum intensity projections of representative NOD-mCherry– and motorless NOD-mCherry–expressing cells with comparable expression levels (highlighted in D). Error bar represents the SEM. Bars, 10 µm.
Figure 3.
Figure 3.
KLP3A localization and Aurora B localization and activity are not compromised in NOD-expressing cells. (A, C, and E) Representative maximum projections of tubulin, DAPI (blue), KLP3A (red; A), phospho–histone H3–serine 10 (red; C) or phospho–Aurora B (red; E), and NOD (green) for high and low/no NOD-expressing cells. (B, D, and F) Quantification of KLP3A (n = 102 cells; B), phospho–histone H3 (Serine 10; n = 31 cells; D), or phospho–Aurora B (n = 73 cells; F) signals relative to DAPI intensities for high and low/no NOD-expressing cells. There was not a statistically significant difference in levels of KLP3A, phospho–Aurora B, or phospho-H3 (Ser10) between high and no/low NOD-expressing cells. Two-tailed p-values are shown. Error bars represent the SEM. Bars, 10 µm.
Figure 4.
Figure 4.
NOD-mCherry–induced syntelic kt-MT attachments are stable and exhibit reduced levels of Mad1. (A) Maximum projection of two-color confocal Z-sections from a NOD-mCherry–expressing cell with syntelic attachments (S1–S4) and bioriented chromosomes with amphitelic attachments (A1–A3). (B) Quantification of k-fiber fluorescence intensity of the amphitelic (A1–A3) and syntelic attachments (S1–S4) highlighted in A. The tubulin fluorescence presented in the bar graph is the integrated fluorescence intensity per micrometer of k-fiber. (C) Flow chart outlining the cold stability assay used to probe syntelic k-fiber stability. (D) Micrographs of no/low NOD-mCherry– and high NOD-mCherry–expressing control and cold-treated cells. Note that both syntelic (S) and bioriented (B) chromosomes retain their k-fibers equally after cold treatment. (E) Quantification of tubulin fluorescence intensity for no/low NOD-mCherry– and high NOD-mCherry–expressing cells for control and cold-treated cells. (F) Flow chart outlining the protocol used to examine Mad1 reduction at syntelic attachments. (G) Spinning disk confocal imaging of NOD-mCherry– and Mad1-YFP–expressing cells before and after a 15-min colchicine treatment to depolymerize the spindle microtubules. The fold increase (58× and 8×) in Mad1 levels after the colchicine treatment is shown for each cell. Error bars represent the SEM. Bars, 10 µm.
Figure 5.
Figure 5.
NOD-dependent chromatin stretching events are associated with two different types of microtubule–chromatin interactions. (A) A whole cell two-color confocal image of a GFP–α-tubulin (green–) and NOD-mCherry (red)–expressing S2 cell with the chromosome shown in B and C highlighted (white box). (B and C) Selected frames from confocal time-lapse imaging of chromatin stretching events. The chromosome is attached to the pole through kinetochore microtubules (bottom left corner, arrow). (B) An example of a chromatin stretching event extending along a microtubule that makes a glancing interaction with the chromosome. The chromatin is stretched toward the plus end before it is retracted coincident with the depolymerizing microtubule. (C) A chromatin stretching event that is associated with a polymerizing microtubule–chromosome interaction. Note that the chromatin stretches along with the polymerizing microtubule before pausing and then rapidly retracting, causing the microtubule to buckle. The separation between the plus end of the microtubule and the stretched chromatin at t = 15 s is a consequence of sequential imaging. (D) A plot of velocity versus time for the two stretch events shown in B and C. The positive values represent extension velocities and the negative values reflect recoil velocities. Closed arrowheads denote the leading edges of stretched chromatin and open arrowheads mark the microtubule plus ends. See Video 5. Bars: (A) 10 µm; (B and C) 1 µm.
Figure 6.
Figure 6.
Two types of chromatin stretch events occur in NOD-mCherry–expressing cells. (A) Plot of distance versus time (5-s intervals) for 21 separate chromatin stretching events. Persistent stretch events are highlighted in blue. (B) NOD-mCherry stretches contain phospho-H3 (Serine 10)–positive chromatin. NOD is red and phospho-H3 is green in the merged image. (C) The mean extension velocities of rapid and persistent stretch events. (D) Chromatin in rapid events extends at ∼10 µm/min, whereas extension in persistent events starts at ∼8 µm/min and slows over time to ∼2 µm/min. (E and F) Kymographs of rapid and persistent stretch events imaged by spinning disk confocal microscopy with high temporal resolution (1.5–2-s intervals). Whole cell images are shown below each kymograph highlighting the stretch event that is represented in the kymograph. In the first image, the open arrowhead marks the periphery of the chromosome and the solid arrow marks the edge of the stretch event. Stretches are highlighted in subsequent images with solid arrows. (E) Rapid events exhibit rapid and uniform extension and recoil velocities. (F) Persistent stretch events exhibit variable extension and recoil velocities over time. Bars show standard deviation. Bars: (B, top; and E and F, bottom) 5 µm; (B, bottom) 2.5 µm; (E and F, top) 1 µm (horizontal) and 10 s (vertical).
Figure 7.
Figure 7.
High spatial and temporal resolution imaging reveals that NOD-mCherry associates with the ends of polymerizing microtubules. (A) Selected frame (top) and maximum projection of 50 frames (bottom) from a confocal time lapse of an EB1-GFP (green)– and NOD-mCherry (red)–expressing S2 cell. See Video 6. (B–D) Kymographs of NOD-mCherry and EB1-GFP. (B and C) The extension phases of two rapid stretch events that colocalize with EB1-GFP comets are shown. The kymograph in C is from Video 7. (D) A NOD-mCherry spot that is propelled through the cytoplasm colocalizes with an EB1-GFP comet. See Video 8. (E–G) NOD-mCherry tracks on dynamic microtubules. See Video 9. (E) Selected frame from a confocal time lapse of a GFP–α-tubulin (green)– and NOD-mCherry (red)–expressing mitotic S2 cell showing a NOD-mCherry fragment localized at the microtubule plus end. The fragment is considerably smaller than the syntelically attached chromosome 4 located below it. (F) Line scan of the highlighted region shown in E. (G) Kymographs of NOD-mCherry and GFP–α-tubulin during a tracking event. NOD-mCherry (red) tracks the growing, shortening, and paused plus end of the microtubule (green). Bars: (A and E) 10 µm; (B–D and G) 1 µm (horizontal) and 10 s (vertical).
Figure 8.
Figure 8.
Syntelic attachments are stabilized by NOD chimeras that possess either plus end–directed motility or tip-tracking activity. (A) Schematic diagrams of full-length NOD-mCherry and EB1- and kinesin-1-NOD-mCherry. (B) Maximum intensity projection of a GFP–α-tubulin (green)– and EB1-NOD-mCherry (red)–expressing S2 cell showing enrichment of EB1-NOD on chromosomes and the presence of misaligned chromosomes. (C) Maximum intensity projection of a cell expressing Ndc80-GFP (green) and EB1-NOD-mCherry (red) with syntelic (S) and bioriented (B) attachments. (D) Kymograph of a rapid EB1-NOD–mediated chromatin stretch event. (E) Plot of percentage of syntelic attachments versus mCherry fluorescence for EB1-NOD cells. EB1-NOD-mCherry overexpression stabilizes syntelic attachments at a significantly lower frequency than wild-type NOD-mCherry (NOD, n = 57 cells; EB1-NOD, n = 71 cells). (F) Maximum intensity projection of a GFP–α-tubulin (green)– and kinesin-1-NOD-mCherry (red)–expressing cell showing aberrant spindle morphology. (G) Maximum intensity projection of an Ndc80-GFP (green)– and kinesin-1-NOD-mCherry (red)–expressing S2 cell with a mixture of syntelic (S) and bioriented (B) attachments. (H) Kymograph of a persistent kinesin-1-NOD–mediated chromatin stretch event. (I) Plot of percentage of syntelic attachments versus mCherry fluorescence for kinesin-1-NOD cells. Kinesin-1-NOD-mCherry overexpression induces a dose-dependent increase in the percentage of syntelic attachments that rises more slowly and plateaus at a lower percentage of syntelics than the corresponding increase seen for wild-type NOD-mCherry (NOD, n = 57 cells; kinesin-1-NOD, n = 72 cells). (J) The percentage of syntelic attachments in high-expressing cells (defined as >5.0e6 A.U) for NOD-, kinesin-1-NOD-, and EB1-NOD-mCherry–expressing cells. Two-tailed p-values are <0.0005. Error bars are the SEM. Curves were fit with a hyperbolic function. R values are 0.66 (EB1-NOD), 0.7 (kinesin-1-NOD), and 0.86 (NOD). Bars: (B and F) 10 µm; (C and G) 5 µm; (D and H) 1 µm (horizontal) and 10 s (vertical). See Video 10.
Figure 9.
Figure 9.
NOD chimeras with either plus end–directed motility or tip tracking activity produce PEFs. (A) Distance between the monopole center and Ndc80-stained kinetochores. The distance between kinetochores and monopole centers decreased by 30% in the absence of NOD and was rescued in NOD-depleted cells by inducing either EB1-NOD-mCherry or kinesin-1-NOD-mCherry (control, n = 283 kinetochore pairs; NOD RNAi, n = 302; NOD RNAi + EB1-NOD-mCherry, n = 293; NOD RNAi + kinesin-1-NOD-mCherry, n = 383). Error bars are SEM. (B) Representative maximum projection images for each condition. Monopoles were generated in each condition by depleting Klp61F. The chimeric NOD-mCherry protein is shown only in black and white. In the merged images DNA is blue, Ndc80 is red, and microtubules are green. (C) Histograms of the distribution of pole–kinetochore measurements for the four experimental conditions each fit with a Gaussian function (black lines). The dashed line extending through the histograms marks the mean pole–kinetochore distance in control RNAi-treated cells. Two-tailed p-values are shown. Bar, 10 µm.
Figure 10.
Figure 10.
Models for PEF-based modulation of error correction around spindle poles and sources of PEF production. (A) A model of PEF gradients across the metaphase spindle predicts that as a chromosome approaches a spindle pole it will experience progressively higher levels of PEF-mediated kt-MT stabilization because of elevated tension at kinetochores. (B) Model for generation of PEFs that oppose kinetochore-mediated pulling forces to create tension at kinetochores. We propose that chromosome-associated proteins with either plus end–directed motility or end tracking activity can generate PEFs.

Similar articles

Cited by

References

    1. Adams R.R., Maiato H., Earnshaw W.C., Carmena M. 2001. Essential roles of Drosophila inner centromere protein (INCENP) and aurora B in histone H3 phosphorylation, metaphase chromosome alignment, kinetochore disjunction, and chromosome segregation. J. Cell Biol. 153:865–880 10.1083/jcb.153.4.865 - DOI - PMC - PubMed
    1. Afshar K., Barton N.R., Hawley R.S., Goldstein L.S. 1995a. DNA binding and meiotic chromosomal localization of the Drosophila nod kinesin-like protein. Cell. 81:129–138 10.1016/0092-8674(95)90377-1 - DOI - PubMed
    1. Afshar K., Scholey J., Hawley R.S. 1995b. Identification of the chromosome localization domain of the Drosophila nod kinesin-like protein. J. Cell Biol. 131:833–843 10.1083/jcb.131.4.833 - DOI - PMC - PubMed
    1. Akiyoshi B., Sarangapani K.K., Powers A.F., Nelson C.R., Reichow S.L., Arellano-Santoyo H., Gonen T., Ranish J.A., Asbury C.L., Biggins S. 2010. Tension directly stabilizes reconstituted kinetochore-microtubule attachments. Nature. 468:576–579 10.1038/nature09594 - DOI - PMC - PubMed
    1. Antonio C., Ferby I., Wilhelm H., Jones M., Karsenti E., Nebreda A.R., Vernos I. 2000. Xkid, a chromokinesin required for chromosome alignment on the metaphase plate. Cell. 102:425–435 10.1016/S0092-8674(00)00048-9 - DOI - PubMed

MeSH terms