. 2013 Feb 11;210(2):355-74.
doi: 10.1084/jem.20120363. Epub 2013 Jan 21.

Wiskott-Aldrich syndrome protein-mediated actin dynamics control type-I interferon production in plasmacytoid dendritic cells

Affiliations

Wiskott-Aldrich syndrome protein-mediated actin dynamics control type-I interferon production in plasmacytoid dendritic cells

Francesca Prete et al. J Exp Med. .

Abstract

Mutations in Wiskott-Aldrich syndrome (WAS) protein (WASp), a regulator of actin dynamics in hematopoietic cells, cause WAS, an X-linked primary immunodeficiency characterized by recurrent infections and a marked predisposition to develop autoimmune disorders. The mechanisms that link actin alterations to the autoimmune phenotype are still poorly understood. We show that chronic activation of plasmacytoid dendritic cells (pDCs) and elevated type-I interferon (IFN) levels play a role in WAS autoimmunity. WAS patients display increased expression of type-I IFN genes and their inducible targets, alteration in pDCs numbers, and hyperresponsiveness to TLR9. Importantly, ablating IFN-I signaling in WASp null mice rescued chronic activation of conventional DCs, splenomegaly, and colitis. Using WASp-deficient mice, we demonstrated that WASp null pDCs are intrinsically more responsive to multimeric agonist of TLR9 and constitutively secrete type-I IFN but become progressively tolerant to further stimulation. By acute silencing of WASp and actin inhibitors, we show that WASp-mediated actin polymerization controls intracellular trafficking and compartmentalization of TLR9 ligands in pDCs restraining exaggerated activation of the TLR9-IFN-α pathway. Together, these data highlight the role of actin dynamics in pDC innate functions and imply the pDC-IFN-α axis as a player in the onset of autoimmune phenomena in WAS disease.


Figures

Figure 1.
Figure 1.
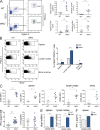
Characterization of pDCs cells in spleen and peripheral blood of WAS patients. Spleen sections are obtained from WAS patients (A–E) and HDs (F) and stained for BDCA-2+ (A–D, brown), CD3 (D, blue), and MxA (E and F). Similarly to control cases, the spleen content of BDCA-2+ cells in WAS patients is extremely variable (WAS#2 in A, WAS#1 in B; G). BDCA-2+ cells show a typical PDC morphology (WAS#2 in C) and are regularly distributed mainly in T cell area (WAS#2 in D). E and F illustrate two cases of MxA score 4 (WAS#1) and score 2 (HD#2). Bars: (A, B, and D–F) 200 µm; (C) 33 µm. (G) The number of pDCs (CD303+ cells) in spleen sections was quantified automatically as described in Materials and methods. Horizontal bars indicate the mean value.
Figure 2.
Figure 2.
Characterization of pDCs in peripheral blood of WAS patients. (A) IFN-α induction in pDCs by serum from WAS patients. pDCs isolated from HDs were incubated with 50% serum from WAS, SLE, JIA patients, or HDs for 24 h. IFN-α in supernatant was measured by ELISA. Values of IFN-α supernatants were subtracted from the values of IFN-α in corresponding sera assayed in parallel without cells. Horizontal bars indicate the mean value. Data were analyzed with Mann-Whitney test. *, P < 0.05; **, P < 0.01. (B and C) mRNA was extracted from PBMCs of seven WAS patients and five HDs. Data show expression of three IFN-α transcripts (B) and five type-I IFN–inducible genes (C). Horizontal bars indicate the mean value. Horizontal dashed line indicates the normalized HD mean value. (D) The percentage of pDCs in PBMCs of 15 pediatric WAS patients and 10 age-matched HDs was calculated by dividing the number of lineage-negative/BDCA-2+/CD4+ cells by the number of total live cells. Horizontal bars indicate mean values. (E) Relative IFN-α production by PBMCs from five WAS patients and eight HDs 24 h after stimulation with CpG ODN2216. Relative IFN-α production was calculated by dividing CpG ODN2216-induced IFN-α production by the percentage of pDCs. Adult patient is indicated by #. ELISA and real-time PCR data were analyzed with Mann-Whitney test. *, P < 0.05; **, P < 0.01.
Figure 3.
Figure 3.
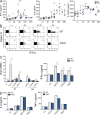
Analysis of the pDC compartment in WASp-deficient mice. (A) Frequency and absolute numbers of pDCs in adult WKO mice. FACS dot plots show pDCs gating strategies, and numbers in quadrants refer to percentage of PDCA-1+/Siglec-H+/B220+ cells. Graphs show frequency and absolute number of pDCs in the spleen and LN of WT and WKO animals. n = 8–11 mice per group from three independent experiments. (B) Proliferation of pDCs in vivo. WT and WKO adult mice were fed BrdU in the drinking water for 7 d. Representative FACS plots showing the percentages of BrdU+ pDCs in spleen, LN, and BM. Results are from two experiments with four mice per group. (C) The expression of maturation markers (CD86, CD40, and MHC-II) was measured by FACS on pDCs in different organs. The mean fluorescence intensity (MFI) in individual mice is indicated. Data are representative of two experiments (n = 4–8 mice per group) of four performed. (D) The levels of IFN-α and IL-6 in the sera of untreated mice were evaluated by ELISA. n = 13–14 WT mice and 13–19 WKO mice. (E) Data show the relative expression of Ifna4 mRNA in pDCs isolated from the spleen and LN of WT and WKO mice. ΔCTs were obtained by normalizing target gene to the housekeeping β-actin. Values are shown as the 2ΔCT × 103. n = 4 mice per group in at least four independent experiments. (F) WT and WKO splenic pDCs were plated at 3 × 10⁵/well and the spontaneous release of IFN-α was measured by ELISA 24 h later. Data are from three independent experiments, each with six mice per group. A–C, Mann-Whitney test; D–F, Student’s t test; error bars indicate SEM. *, P < 0.05; **, P < 0.01; ***, P < 0.001.
Figure 4.
Figure 4.
Progressive exhaustion of the TLR9/IFN-α in WKO mice. (A) WT and WKO adult (>6 wk) mice were injected intravenously with 10 µg CpG-A in complex with the cationic lipid DOTAP. Serum levels of IFN-α, IL-6, and IL-12p40 were measured by ELISA at 2, 6, 10, and 24 h after injection. n = 4–9 mice per group in three independent experiments. (B) Dot plots showing IFN-α intracellular staining in the spleen of WT and WKO mice isolated at different time points after injection. Numbers represents the percentage of cells in the respective quadrant. Data are representative of one of three experiments performed each with three mice per group. (C) Gene transcription and protein release in splenic pDCs sorted from WT and WKO adult mice. Cells were stimulated ex vivo with CpG-A, CpG-B, and R837 (15 µg/ml). The relative expression of Ifna4 transcripts was evaluated by qRT–PCR at 4 and 24 h. The target mRNA was normalized to β-actin mRNA. Values are shown as the 2ΔCT × 103. The levels of IFN-α (C, right), IL-6, and IL-12p40 (D) were measured in cell culture supernatants after 16 h. Results are representative of four (CpG-A and CpG-B in C) and three (R837 in C and D) independent experiments. A, Mann-Whitney test; C and D, Student’s t test; error bars indicate SEM. *, P < 0.05; **, P < 0.01; ***, P < 0.001.
Figure 5.
Figure 5.
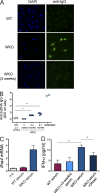
WKO serum induces IFN-α secretion by pDCs. (A) The presence of IgG anti-dsDNA autoantibodies in sera was analyzed by immunostaining of NIH3T3 cells. Diluted sera from control (WT), WKO (>6 mo), and young WKO (3 wk) mice were incubated with NIH3T3 cells, and the anti-nuclear reactivity was detected using FITC-conjugated anti-IgG antibody (right). Nuclei were visualized by DAPI staining (left). Representative images from one out of four sera tested/group are shown. Bar, 36 µM. (B) Levels of IgG anti-dsDNA autoantibodies were evaluated by ELISA in sera (1:800 dilution) from 3-wk-old, 3–4-mo-old, and 6–7-mo-old WKO mice. As positive and negative controls, SLE-prone NZW/NZB F1 mice (6 mo old) and WT mice (4–7 mo old) were used, respectively. Each dot represents an individual animal. Horizontal bars indicate medians. (C) 3.5 × 10⁵ WT BM–derived pDCs (BM-pDCs) were stimulated with sera from WT or WKO mice for 7 h. Relative expression of Ifna4 transcripts were evaluated by qRT-PCR. Data are representative of sera from n = 4 mice per group in two independent experiments. (D) 3.5 × 10⁵ WT BM-pDCs were stimulated with sera from the indicated groups of animals (pooled sera of four animals per group) treated or not with DNase I. Secretion of IFN-α was measured by ELISA at 24 h. Data are expressed as the values in experimental wells subtracted of the values in control wells (dilutions of sera without cells). B and D, Mann-Whitney test; error bars indicate SEM. *, P < 0.05.
Figure 6.
Figure 6.
Cell-intrinsic role of WASp-mediated actin dynamics in limiting IFN-α production in pDCs. (A) Responses to TLR9 and TLR7 agonists in naive pDCs from young WKO mice. 3 × 10⁵ pDCs isolated from the spleen of young (3 wk) WT or WKO mice were stimulated ex vivo with 10 µg/ml CpG-A or CpG-B and 5 µg/ml R837. Bars show IFN-α, IL-6, and TNF protein levels determined by ELISA in cell culture supernatant. Results are from two (R837) to five (CpG-A and CpG-B) independent experiments each with six mice per group. (B) pDCs were stimulated with 20 µg/ml CpG-A for 5 h in the presence of brefeldin A. Intracellular staining was performed with antibodies against IFN-α and TNF. The plots are from one representative experiment of three performed. (C) Splenic pDCs from young WT or WKO mice were incubated with sera from WT (n = 4) or WKO (n = 4) adult mice. Data show the levels of IFN-α in cell culture supernatants subtracted of the values in control wells without cells. Data are representative of two experiments with six mice per group. (D and E) BM-pDCs or BM-cDCs were nucleofected with siRNA control (si-irr) or WASp-specific (si-WASp) RNA oligos. (D) 3 × 10⁵ control or WASp-silenced BM-pDCs were stimulated with 15 µg/ml CpG-A or CpG-B. IFN-α and IL-6 protein levels were determined by ELISA. Results are from four experiments. (E) 3 × 10⁵ control or WASp-silenced BM-cDCs were stimulated with 15 µg/ml CpG-B. IL-12p40 and IL-6 protein levels were determined by ELISA. Results are representative of three experiments. (F) 3 × 10⁵ BM-pDCs were preincubated with 1 µg/ml cytochalasin-d (Cyto-d), 0.1 µg/ml latrunculin-A or control medium, washed and stimulated with 5 µg/ml CpG-A for 5 h. Bars show concentrations of IFN-α and IL-6 protein in cell culture supernatants. Data are representative of two (latrunculin-A) to six (cytochalasin-d) independent experiments. Levels of IL-6 (G) and IL-12p40 (H) induced by CpG-B in Cyto-D–treated pDCs and Cyto-D–treated cDCs upon stimulation with 15 µg/ml CpG-A and CpG-B, respectively. One representative experiment out of three with similar results is shown. A, D, and E, Student’s t test; F, Mann-Whitney test; error bars indicate SEM. *, P < 0.05; **, P < 0.01; ***, P < 0.001.
Figure 7.
Figure 7.
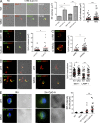
CpG-A induces tyrosine phosphorylation of WASp and its localization in EE. (A) WT BM-pDCs were stimulated with 20 µg/ml CpG-A and whole cell lysates were Western blotted with anti-phospho paxillin, anti-phospho Pyk2, and anti-phospho Src antibodies. (B) WT BM-pDCs were lysed after the indicated times of stimulation with CpG-A. WASp was immunoprecipitated from the cell lysates and the anti-WASp immunoprecipitates were Western blotted with anti total phospho-tyrosine and anti-WASp antibodies. (C) WT or WKO splenic pDC were labeled with antibodies against WASp to assess staining specificity (bars, far left panels, 33 µm). WT splenic pDCs from adult mice were left untreated or stimulated with CpG-A for 30 min, fixed, and labeled with antibodies against WASp and the EE marker EEA-1. Representative single confocal z-planes (middle) are shown. Bars, 3 µm. (D) The index of colocalization (Pearson’s coefficient) between WASp and EEA-1 staining was measured on 9 and 10 resting and stimulated cells, respectively. Red horizontal bars indicate the median. Mann-Whitney test.
Figure 8.
Figure 8.
WASp controls CpG-A accumulation and EE size in pDCs. (A) Splenic pDCs from young WT and WKO mice were stimulated with 20 µg/ml CpG-A FITC for 30 min or left untreated (NS). Shown are representative confocal images of CpG-A and EEA-1 merged with DIC images. The quantification of EE volumes and CpG-A volumes on 3D reconstructed z-sections is shown on the right. For EE volumes, n = 85, 19, 63, and 25 for WT(NS), WT(CpG-A), WKO(NS), and WKO(CpG-A), respectively. Mean and SEM are indicated, Mann-Whitney test. For CpG-A volumes, n = 74 and n = 77 cells were analyzed in WT and WKO, respectively. Horizontal bars show mean values. ***, P = 0.0008, Mann-Whitney. (B) Splenic WT pDCs were pretreated with cytochalasin-d (or control medium) for 30 min, washed, and exposed to CpG-A FITC for 30 min. Confocal images show representative example of CpG-A and EEA-1 staining merged with DIC images. The volume of intracellular CpG-A vesicles was quantified on >30 cells per condition. Bars show mean values, P = 0.034, Mann-Whitney. (C) BM-PDCs treated with control or WASp-specific siRNA (si-IRR and si-WASp) were incubated with CpG-A-cy5 and immunostained with anti–EEA-1 antibodies. Representative single confocal planes are shown. The plot shows the quantification of CpG-A containing vesicles measured on 3D reconstructed images. Data were collected from 50 si-irr– and 50 si-WASp–treated cells. Horizontal bars show mean values. **, P = 0.0021, Mann-Whitney test. (D) Splenic pDCs isolated from young mice were incubated with 20 µg/ml CpG-A FITC for 1 h. Confocal images of CpG-A and EEA-1 (left) and LAMP-1 (right) staining merged with DIC images are shown. The graph represents Pearson’s correlation coefficients that were calculated for CpG-A and EEA-1 or CpG-A and LAMP-1 on 3D reconstituted z-sections. Data are from n = 74 WT and n = 41 WKO cells for EEA-1 (**, P = 0.0037), and from n = 116 WT and n = 72 WKO cells for LAMP-1 (***, P = 0.0005, Mann-Whitney t test). Horizontal bars represent median. (E) Splenic pDCs from young mice were incubated with 10 µg/ml CpG-A for 2 h, fixed, and labeled with antibodies against IRF-7. Representative images are of resting and stimulated WT and WKO cells. The quantification shows the ratio between the mean fluorescence intensity in cytoplasm versus nucleus calculated on 4 and 25 resting and stimulated cells, respectively, in each group. Horizontal bars show mean values. **, P = 0.0017, Mann-Whitney test. Bars, 3 µm.
Figure 9.
Figure 9.
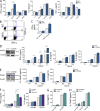
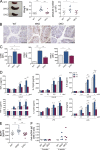
Partial rescue of autoimmune disease in IFNAR/WASp double KO mice. (A) Representative spleens from 3-mo-old WT, WKO, and DKO mice. Graphs represent spleen wet weight (in grams) and total splenocytes counts (n = 7–10 animals per group). (B) Formalin-fixed sections of large bowel are from 4-mo-old WT (left), WKO (middle), and DKO (right) mice and stained for anti-CD3. Compared with WT, WKO, and, to a lesser extent, DKO, show increased mucosal infiltration of CD3+ T cells. Sections are counterstained with Mayer’s hematoxylin. Bar, 200 µm. (C) Mean fluorescence intensity (MFI) of CD86, CD40, and MHC-I expressed by cDC (CD11chi) at steady state were measured by FACS in spleens of WT, WKO, and DKO mice. Data are from three independent experiments, each with two to four mice per group. (D) 3 × 10⁵ WT, WKO, and DKO BM-cDCs were incubated with increasing doses of CpG-B (top) or LPS (bottom). The levels of TNF, IL-12p40, and IL-6 were measured by ELISA in 4-h cell culture supernatants. Data are from two independent experiments, each with two to four mice per group. (E) The levels of BAFF were compared in the sera of WT (n = 10), WKO (n = 9), and DKO (n = 11) animals in absence of any prior stimulation. Error bars indicate SEM. Statistics were calculated by one-way ANOVA followed by Bonferroni’s post hoc test. (F) Levels of IgG anti-dsDNA autoantibodies were evaluated by ELISA in sera from WT, WKO, and DKO mice at 2 and 4 mo of age (n = 4 mice per group). Horizontal bars show median. *, P < 0.05; **, P < 0.01; ***, P < 0.001.

References

    1. Agrawal H., Jacob N., Carreras E., Bajana S., Putterman C., Turner S., Neas B., Mathian A., Koss M.N., Stohl W., et al. 2009. Deficiency of type I IFN receptor in lupus-prone New Zealand mixed 2328 mice decreases dendritic cell numbers and activation and protects from disease. J. Immunol. 183:6021–6029 10.4049/jimmunol.0803872 - DOI - PMC - PubMed
    1. Altfeld M., Fadda L., Frleta D., Bhardwaj N. 2011. DCs and NK cells: critical effectors in the immune response to HIV-1. Nat. Rev. Immunol. 11:176–186 10.1038/nri2935 - DOI - PMC - PubMed
    1. Andreansky S., Liu H., Turner S., McCullers J.A., Lang R., Rutschman R., Doherty P.C., Murray P.J., Nienhuis A.W., Strom T.S. 2005. WASP- mice exhibit defective immune responses to influenza A virus, Streptococcus pneumoniae, and Mycobacterium bovis BCG. Exp. Hematol. 33:443–451 10.1016/j.exphem.2004.12.006 - DOI - PubMed
    1. Astrakhan A., Ochs H.D., Rawlings D.J. 2009. Wiskott-Aldrich syndrome protein is required for homeostasis and function of invariant NKT cells. J. Immunol. 182:7370–7380 10.4049/jimmunol.0804256 - DOI - PMC - PubMed
    1. Badour K., Zhang J., Shi F., McGavin M.K., Rampersad V., Hardy L.A., Field D., Siminovitch K.A. 2003. The Wiskott-Aldrich syndrome protein acts downstream of CD2 and the CD2AP and PSTPIP1 adaptors to promote formation of the immunological synapse. Immunity. 18:141–154 10.1016/S1074-7613(02)00516-2 - DOI - PubMed

Publication types

MeSH terms