. 2013 Apr 1;591(7):1967-85.
doi: 10.1113/jphysiol.2012.236604. Epub 2013 Jan 21.

Taste responses in mice lacking taste receptor subunit T1R1

Affiliations

Taste responses in mice lacking taste receptor subunit T1R1

Yoko Kusuhara et al. J Physiol. .

Abstract

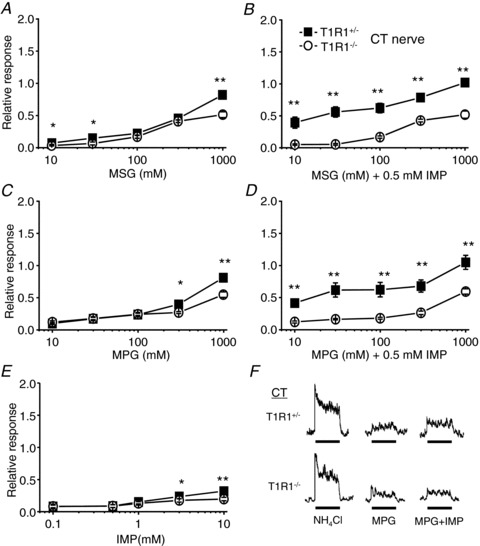
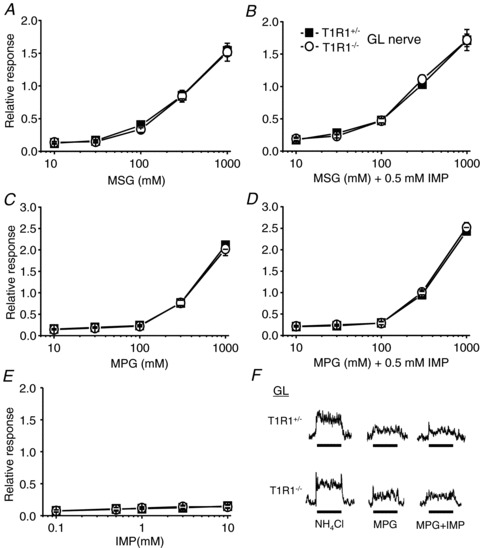
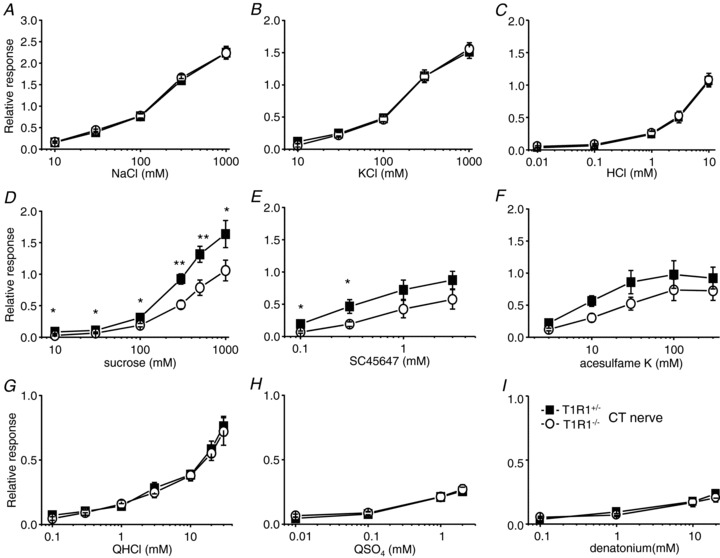
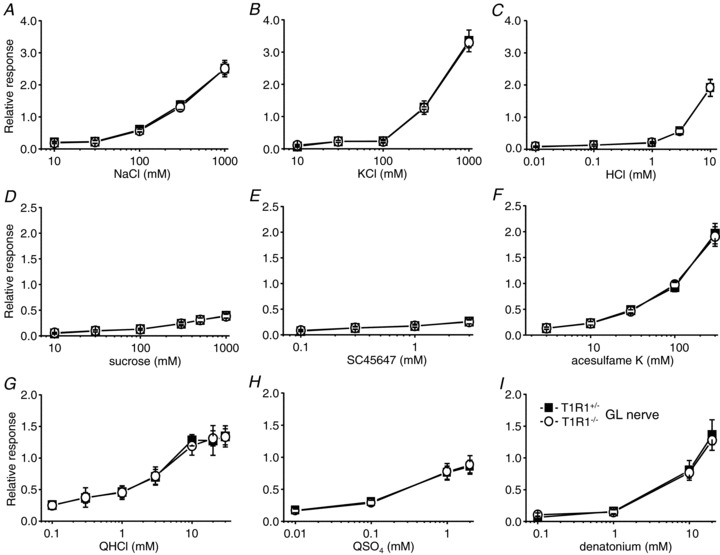
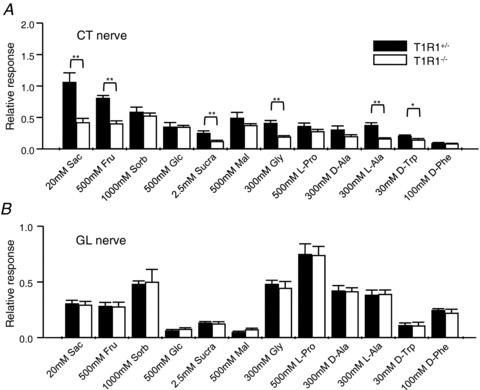
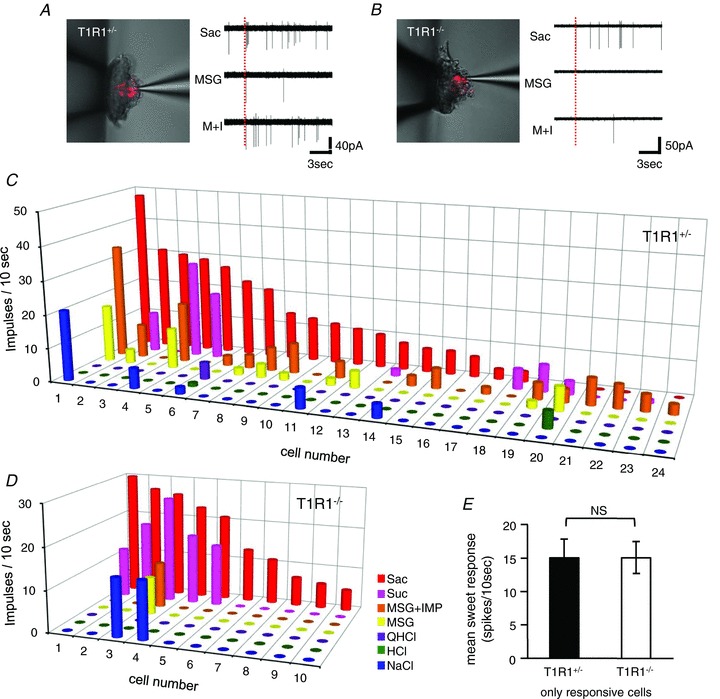
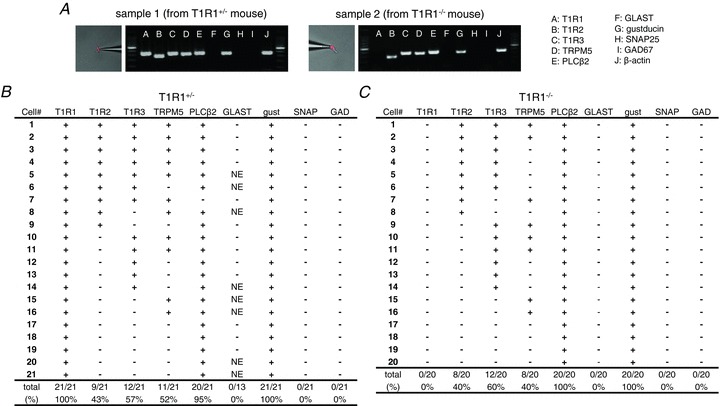
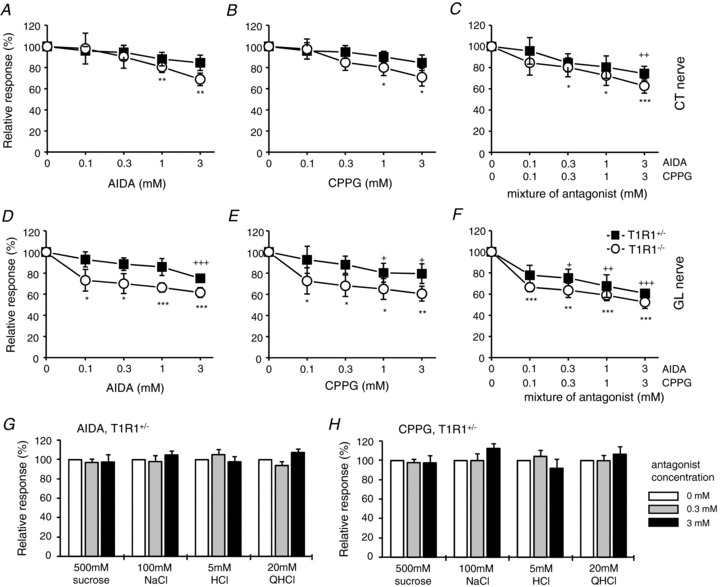
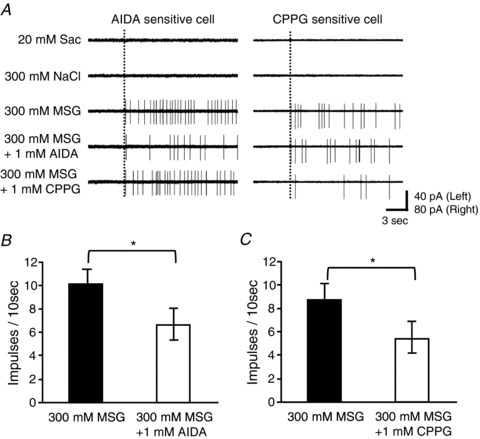
The T1R1 receptor subunit acts as an umami taste receptor in combination with its partner, T1R3. In addition, metabotropic glutamate receptors (brain and taste variants of mGluR1 and mGluR4) are thought to function as umami taste receptors. To elucidate the function of T1R1 and the contribution of mGluRs to umami taste detection in vivo, we used newly developed knock-out (T1R1(-/-)) mice, which lack the entire coding region of the Tas1r1 gene and express mCherry in T1R1-expressing cells. Gustatory nerve recordings demonstrated that T1R1(-/-) mice exhibited a serious deficit in inosine monophosphate-elicited synergy but substantial residual responses to glutamate alone in both chorda tympani and glossopharyngeal nerves. Interestingly, chorda tympani nerve responses to sweeteners were smaller in T1R1(-/-) mice. Taste cell recordings demonstrated that many mCherry-expressing taste cells in T1R1(+/-) mice responded to sweet and umami compounds, whereas those in T1R1(-/-) mice responded to sweet stimuli. The proportion of sweet-responsive cells was smaller in T1R1(-/-) than in T1R1(+/-) mice. Single-cell RT-PCR demonstrated that some single mCherry-expressing cells expressed all three T1R subunits. Chorda tympani and glossopharyngeal nerve responses to glutamate were significantly inhibited by addition of mGluR antagonists in both T1R1(-/-) and T1R1(+/-) mice. Conditioned taste aversion tests demonstrated that both T1R1(-/-) and T1R1(+/-) mice were equally capable of discriminating glutamate from other basic taste stimuli. Avoidance conditioned to glutamate was significantly reduced by addition of mGluR antagonists. These results suggest that T1R1-expressing cells mainly contribute to umami taste synergism and partly to sweet sensitivity and that mGluRs are involved in the detection of umami compounds.


Figures

Figure 1
Figure 1. Concentration–response relationships of chorda tympani (CT) nerve responses for umami taste stimuli
Responses to monosodium glutamate (MSG; A), MSG + 0.5 mm inosine monophosphate (IMP; B), monopotassium glutamate (MPG; C), MPG + 0.5 mm IMP (D) and IMP (E) in T1R1+/− (filled rectangles; n= 5–10) and T1R1−/− mice (open circles; n= 5–16) are shown. Chorda tympani nerve responses were normalized to the response to 100 mm NH4Cl. Values indicated are means ± SEM. Statistical differences were analysed by two-way ANOVA tests (see Table 2) and Student's t test (*P < 0.05, **P < 0.01). F, sample recordings of CT nerve responses to 100 mm NH4Cl, 100 mm MPG and 100 mm MPG + 0.5 mm IMP in T1R1+/− (top traces) and T1R1−/− mice (bottom traces). Bars indicate taste stimulation (30 s).
Figure 2
Figure 2. Concentration–response relationships of glossopharyngeal (GL) nerve responses for umami taste stimuli
Responses to MSG (A), MSG + 0.5 mm IMP (B), MPG (C), MPG + 0.5 mm IMP (D) and IMP (E) in T1R1+/− (filled rectangles; n= 5–13) and T1R1−/− mice (open circles; n= 5–14) are shown. Glossopharyngeal nerve responses were normalized to the response to 100 mm NH4Cl. Values indicated are means ± SEM. There were no statistically significant differences in two-way ANOVA tests (see Table 2). F, sample recordings of GL nerve responses to 100 mm NH4Cl, 100 mm MPG and 100 mm MPG + 0.5 mm IMP in T1R1+/− (top traces) and T1R1−/− mice (bottom traces). Bars indicate taste stimulation (60 s).
Figure 3
Figure 3. Concentration–response relationships of CT nerve responses for various taste stimuli
Responses to NaCl (A), KCl (B), HCl (C), sucrose (D), SC45647 (E), acesulfame K (F), quinine hydrochloride (QHCl; G), quinine sulfate (QSO4; H) and denatonium (I) in T1R1+/− (filled rectangles; n= 5–12) and T1R1−/− mice (open circles; n= 6–16) are shown. Chorda tympani nerve responses were normalized to the response to 100 mm NH4Cl. Values indicated are means ± SEM. Statistical differences were analysed by two-way ANOVA tests (see Table 2) and Student's t test (*P < 0.05, **P < 0.01).
Figure 4
Figure 4. Concentration–response relationships of GL nerve responses for various taste stimuli
Responses to NaCl (A), KCl (B), HCl (C), sucrose (D), SC45647 (E), acesulfame K (F), QHCl (G), QSO4 (H) and denatonium (I) in T1R1+/− (filled rectangles; n= 5–13) and T1R1−/− mice (open circles; n= 5–13) are shown. Glossopharyngeal nerve responses were normalized to the response to 100 mm NH4Cl. Values indicated are means ± SEM. There were no statistically significant differences in two-way ANOVA tests (see Table 2).
Figure 5
Figure 5. Gustatory nerve responses to various sweeteners in T1R1+/− and T1R1−/− mice
Chorda tympani (A) and glossopharyngeal nerve responses (B) to 20 mm saccharin (Sac), 500 mm fructose (Fru), 1000 mm sorbitol (Sorb), 500 mm glucose (Glc), 2.5 mm sucralose (Sucra), 500 mm maltose (Mal), 300 mm glycine (Gly), 500 mm l-proline (l-Pro), 300 mm d-alanine (d-Ala), 300 mm l-alanine (l-Ala), 30 mm d-tryptophan (d Trp) and 100 mm d-phenylalanine (d-Phe) in T1R1+/− (filled columns; n= 5–13) and T1R1−/− mice (open columns; n= 5–14). Gustatory nerve responses were normalized to the response to 100 mm NH4Cl. Values indicated are means ± SEM. *P < 0.05, **P < 0.01, Student's t test.
Figure 6
Figure 6. Taste responses of mCherry-expressing cells in fungiform taste buds
A and B show sample recordings from an mCherry-expressing taste cell of a T1R1+/− mouse (A) and a T1R1−/− mouse (B). Taste responses to 20 mm saccharin (Sac), 300 mm monosodium glutamate (MSG) and 300 mm MSG + 0.5 mm inosine monophosphate (M + I) are shown. Dotted lines indicate the onset of taste stimulation. C and D, response profiles of mCherry-expressing taste cells in T1R1+/− (C) and T1R1−/− mice (D). Taste responses are shown for each taste cell to 300 mm NaCl (NaCl; blue), 10 mm HCl (HCl; green), 20 mm quinine hydrochloride (QHCl; purple), 300 mm monosodium glutamate (MSG; yellow), 300 mm MSG + 0.5 mm inosine monophosphate (MSG + IMP; orange), 500 mm sucrose (Suc; magenta) and 20 mm saccharin (Sac; red). E, mean sweet response of responsive mCherry-expressing taste cells in T1R1+/− (filled column; n= 10) and T1R1−/− mice (open column; n= 20). When the cell responded to both saccharin and sucrose, the averaged response was used to calculate the mean response. Values indicated are means ± SEM. NS, P > 0.1, Student's t test.
Figure 7
Figure 7. Gene expression analysis of mCherry-expressing cells in fungiform papillae of T1R1+/− and T1R1−/− mice by single-cell RT-PCR
A, examples of single-cell RT-PCR from typical profiled cells. After harvesting single mCherry-expressing taste cells (left pictures), gene expression was analysed by multiplex single-cell RT-PCR (right pictures). Positive and negative control reactions were always run in parallel with reactions with samples (Fig. S1). B and C, summarized data from 21 and 20 mCherry-expressing cells in T1R1+/− (B) and T1R1−/− mice (C), respectively. Each row represents a single cell, and each column represents a different gene as indicated. A plus sign denotes that RT-PCR product was detected, and a minus sign denotes the lack of expression. NE denotes that expression was not examined.
Figure 8
Figure 8. The effect of metabotropic glutamate receptor (mGluR) antagonists on gustatory nerve responses to MSG
The effect of (RS)-1-aminoindan-1,5-dicarboxylic acid (AIDA; A and D), (RS)-α-cyclopropyl-4- phosphonophenylglycine (CPPG; B and E) and a mixture of AIDA and CPPG (C and F) on CT (A–C) and GL nerve responses (D–F) of T1R1+/− (filled rectangles; n= 4–10) and T1R1−/− mice (open circles; n= 4–10) to 300 mm MSG. Values indicated are means ± SEM. Statistical differences between T1R1+/− and T1R1−/− mice were analysed by two-way ANOVA tests (see Table 3) and Student's t test [no significant differences (P > 0.05) at all concentrations]. Statistical differences from control (0 mm antagonist) were analysed by Student's t test (+P < 0.05, ++P < 0.01, +++P < 0.001 for T1R1+/− mice; *P < 0.05, **P < 0.01, ***P < 0.001 for T1R1−/− mice). The effect of AIDA (G) and CPPG (H) on CT nerve responses to 500 mm sucrose, 100 mm NaCl, 5 mm HCl and 20 mm QHCl in T1R1+/− mice. There is no significant difference between the conditions with and without antagonists (n= 5–7, P > 0.05, Student's t test).
Figure 9
Figure 9. Short-term (10 s) lick responses after aversive conditioning to 300 mm MSG
Lick responses to MSG (A), sucrose (B), NaCl (C), HCl (D) and QHCl (E) in LiCl-injected (circles) and saline-injected groups (rectangles) of T1R1+/− (filled symbols; n= 5–7) and T1R1−/− mice (open symbols; n= 5). Values indicated are means ± SD. Statistical differences were analysed by ANOVA tests (see Tables 4 and 5) and Student's t test. Asterisks indicate significant differences between T1R1+/− and T1R1−/− mice in the LiCl-injected group (*P < 0.05, **P < 0.01, Student's t test).
Figure 10
Figure 10. The effect of mGluR antagonists on lick responses to MSG
Lick responses to 300 mm MSG with AIDA (A), CPPG (B) and AIDA + CPPG (C) in LiCl-injected (circles) and saline-injected groups (rectangles) of T1R1+/− (filled symbols; n= 6–7) and T1R1−/− mice (open symbols, n= 5). Values indicated are means ± SD. Statistical differences were analysed by ANOVA tests (see Tables 4 and 5) and Student's t test. Asterisks indicate significant differences between T1R1+/− and T1R1−/− mice in the LiCl-injected group (*P < 0.05, **P < 0.01, Student's t test).
Figure 11
Figure 11. The effect of mGluR antagonists on taste responses of M-type taste cells in mouse fungiform papillae
A, sample recordings of M-type taste cells in a C57BL/6N mouse showing the inhibitory effect of AIDA and CPPG. Left panel shows an AIDA-sensitive taste cell, right panel a CPPG-sensitive taste cell. Dotted lines indicate the onset of taste stimulation. B and C, summary of the effect of AIDA (B) and CPPG (C) on responses to 300 mm MSG in M-type taste cells of C57BL/6N mice. Both AIDA and CPPG significantly suppressed responses to MSG in M-type cells. Values indicated are means ± SEM (n= 5 for AIDA, n= 6 for CPPG; *P < 0.05, Student's t test).

Comment in

  • Sweet umami: the twain shall meet.
    Chaudhari N. Chaudhari N. J Physiol. 2013 Apr 1;591(7):1597. doi: 10.1113/jphysiol.2013.251611. J Physiol. 2013. PMID: 23547193 Free PMC article. No abstract available.

Similar articles

Cited by

References

    1. Behrens M, Meyerhof W, Hellfritsch C, Hofmann T. Sweet and umami taste: natural products, their chemosensory targets, and beyond. Angew Chem Int Ed Engl. 2011;50:2220–2242. - PubMed
    1. Chaudhari N, Landin AM, Roper SD. A metabotropic glutamate receptor variant functions as a taste receptor. Nature Neurosci. 2000;3:113–119. - PubMed
    1. Chaudhari N, Yang H, Lamp C, Delay E, Cartford C, Than T, Roper SD. The taste of monosodium glutamate: membrane receptors in taste buds. J Neurosci. 1996;16:3817–3826. - PMC - PubMed
    1. Damak S, Rong M, Yasumatsu K, Kokrashvili Z, Pérez CA, Shigemura N, Yoshida R, Mosinger B, Jr, Glendinning JI, Ninomiya Y, Margolskee RF. Trpm5 null mice respond to bitter, sweet, and umami compounds. Chem Senses. 2006;31:253–264. - PubMed
    1. Damak S, Rong M, Yasumatsu K, Kokrashvili Z, Varadarajan V, Zou S, Jiang P, Ninomiya Y, Margolskee RF. Detection of sweet and umami taste in the absence of taste receptor T1R3. Science. 2003;301:850–853. - PubMed

Publication types

LinkOut - more resources