

The relationship between EQ-5D, HAQ and pain in patients with rheumatoid arthritis
- PMID: 23339232
- PMCID: PMC3630395
- DOI: 10.1093/rheumatology/kes400
The relationship between EQ-5D, HAQ and pain in patients with rheumatoid arthritis
Abstract
Objective: This study aims to provide robust estimates of EQ-5D as a function of the HAQ and pain in patients with RA.
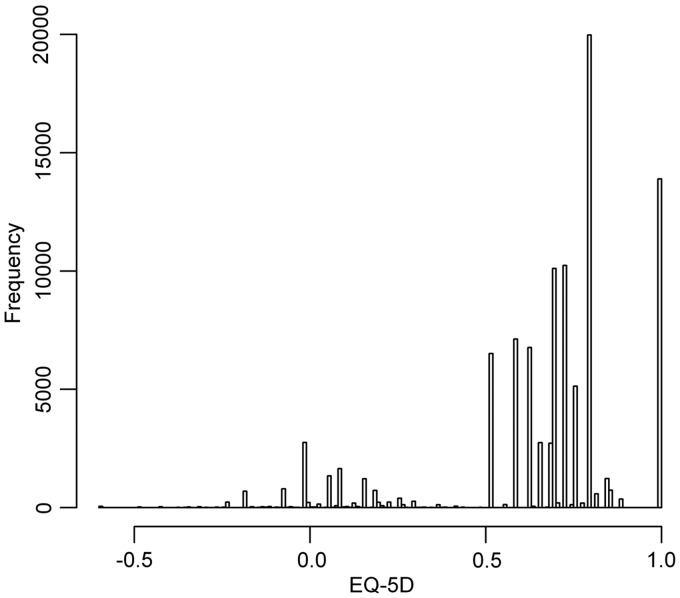
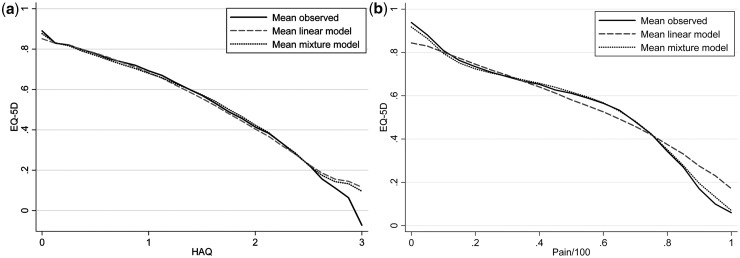
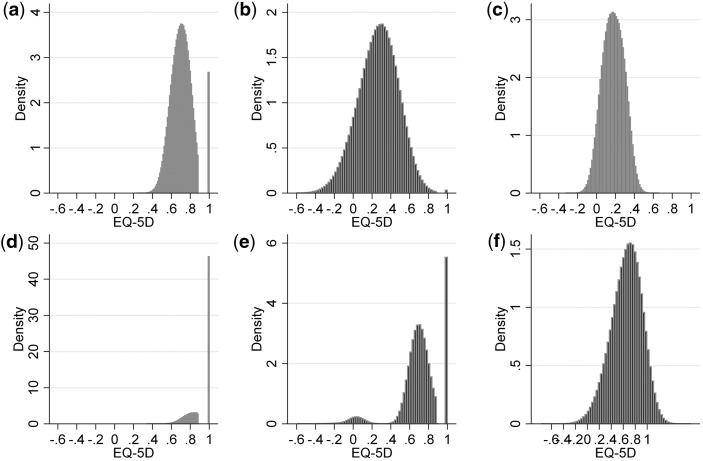
Method: Repeated observations were made of patients diagnosed with RA in a US observational cohort (n = 100 398 observations) who provided data on HAQ, pain on a visual analogue scale and the EQ-5D questionnaire. We used a bespoke statistical method based on mixture modelling to appropriately reflect the characteristics of the EQ-5D instrument and to compare this with results from standard multiple regression.
Results: EQ-5D can be predicted from summary HAQ and pain scores. We identify four different classes of respondents who differ in terms of disease severity. Unlike the multiple regression, the mixture model exhibits very good fit to the data and does not suffer from problems of bias or predict values outside the feasible range.
Conclusion: It is appropriate to model the relationship between HAQ and EQ-5D but only if suitable statistical methods are applied. Linear models underestimate the quality-adjusted life year benefits, and therefore the cost-effectiveness, of therapies. The bespoke mixture model approach outlined here overcomes this problem. The addition of pain as an explanatory variable greatly improves the estimates. Reimbursement agencies rely on these types of analyses when formulating policy on the use of new drug therapies. Clinicians as well as economists should be concerned with these issues.
Figures
References
-
- EuroQol Group. EuroQol—a new facility for the measurement of health-related quality of life. Health Policy. 1990;16:199–208. - PubMed
-
- Brazier J, Roberts J, Deverill M. The estimation of a preference-based measure of health from the SF-36. J Health Econ. 2002;21:271–92. - PubMed
-
- Torrance G, Feeny D, Furlong W, et al. Multiattribute utility function for a comprehensive health status classification system. Health Utilities Index Mark 2. Med Care. 1996;34:702–22. - PubMed
-
- Bansback NJ, Marra C, Tsuchiya A, et al. Using the health assessment questionnaire to estimate preference-based single indices in patients with rheumatoid arthritis. Arthritis Rheum. 2007;57:963–71. - PubMed
-
- Marra CA, Marion SA, Guh DP, et al. Not all ‘quality adjusted life years’ are equal. J Clin Epidemiol. 2007;60:616–24. - PubMed
Publication types
MeSH terms
LinkOut - more resources
Full Text Sources
Other Literature Sources
Medical
