

Distinct dedifferentiation processes affect caveolin-1 expression in hepatocytes
- PMID: 23339737
- PMCID: PMC3598962
- DOI: 10.1186/1478-811X-11-6
Distinct dedifferentiation processes affect caveolin-1 expression in hepatocytes
Abstract
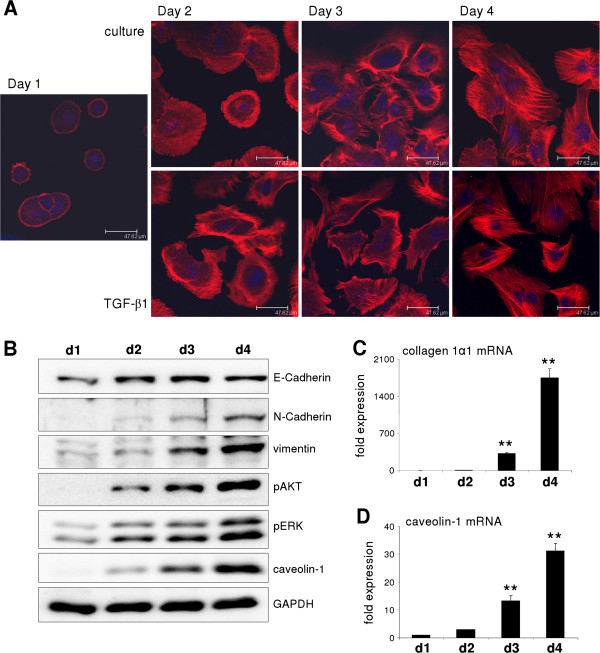
Background: Dedifferentiation and loss of hepatocyte polarity during primary culture of hepatocytes are major drawbacks for metabolic analyses. As a prominent profibrotic cytokine and potent inducer of epithelial mesenchymal transition (EMT), TGF-β contributes to these processes in liver epithelial cells. Yet, a distinction between culture dependent and TGF-β driven hepatocyte dedifferentiation has not been shown to date.
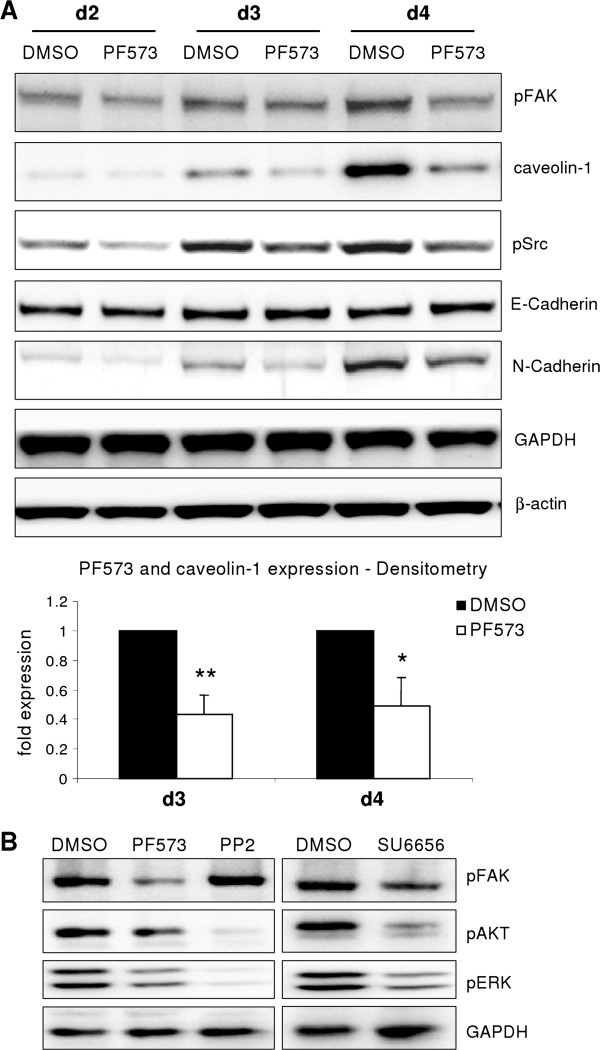
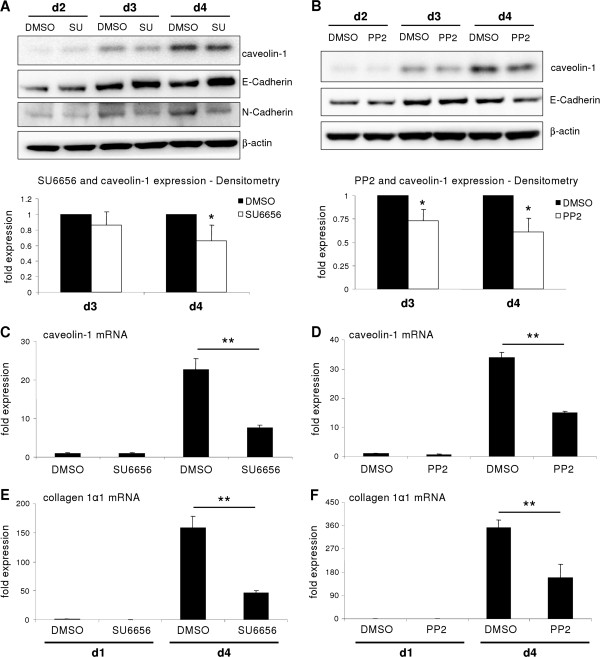
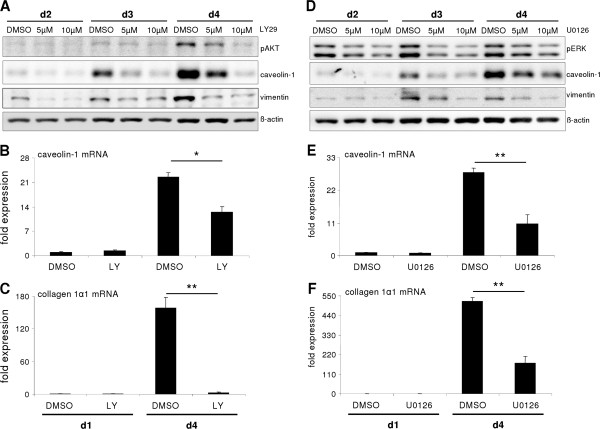
Results: Here, we show that in both settings, mesenchymal markers are induced. However, upregulation of Snai1 and downregulation of E-Cadherin are restricted to TGF-β effects, neglecting a full EMT of culture dependent hepatocyte dedifferentiation. Mechanistically, the latter is mediated via FAK/Src/ERK/AKT pathways leading to the induction of the oncogene caveolin-1 (Cav1). Cav1 was recently proposed as a new EMT marker, but our results demonstrate Cav1 is not up-regulated in TGF-β mediated hepatocyte EMT, thus limiting validity of its use for this purpose. Importantly, marking differences on Cav1 expression exist in HCC cell lines. Whereas well differentiated HCC cell lines exhibit low and inducible Cav1 protein levels - by TGF-β in a FAK/Src dependent manner, poorly differentiated cell lines display high Cav1 expression levels which are not further modulated by TGF-β.
Conclusions: This study draws a detailed distinction between intrinsic and TGF-β mediated hepatocyte dedifferentiation and elucidates cellular pathways involved. Additionally, by evaluating the regulation of the oncogene Cav1, we provide evidence to argue against Cav1 as a reliable EMT marker.
Figures
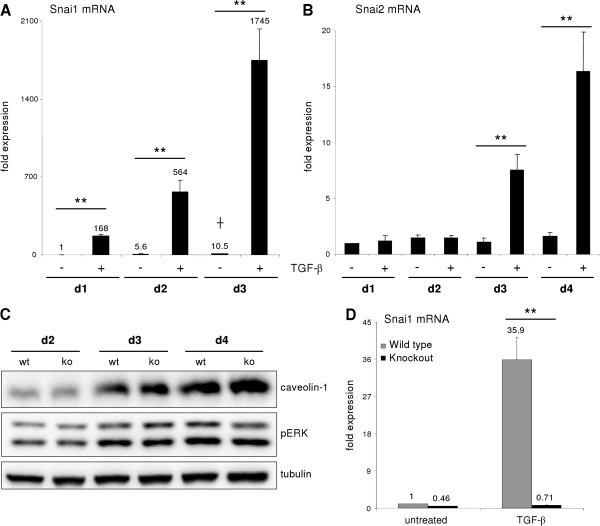
 p < 0.05 untreated d3 vs. untreated d1). (B) No change of Snai2 (Slug) expression could be detected in hepatocytes cultured for 4 days. Beginning on day 3, TGF-β did increase its expression (p ≤ 0.002 at d3 and d4 comparing expression of untreated vs. TGF-β1). (C) Dedifferentiating hepatocytes from wild type and Snai1 ko mice were analyzed for dedifferentiation events with Western blot. No alterations in ERK activation and caveolin-1 induction were observed. (D) Proof of hepatocyte specific Snai1 knockout. Basal Snai1 expression was very weak in wild type hepatocytes (based on qPCR data) and almost absent in Snai1 ko hepatocytes. Induction of Snai1 expression was triggered by TGF-β1 stimulation for 6 h. Control hepatocytes responded with strong induction, whereas Snai1 knockout hepatocytes did not induce expression (p < 0.001).
Similar articles
-
The level of caveolin-1 expression determines response to TGF-β as a tumour suppressor in hepatocellular carcinoma cells.Cell Death Dis. 2017 Oct 12;8(10):e3098. doi: 10.1038/cddis.2017.469. Cell Death Dis. 2017. PMID: 29022911 Free PMC article.
-
Extracellular matrix modulates sensitivity of hepatocytes to fibroblastoid dedifferentiation and transforming growth factor beta-induced apoptosis.Hepatology. 2009 Jun;49(6):2031-43. doi: 10.1002/hep.22880. Hepatology. 2009. PMID: 19274752
-
Caveolin-1 abrogates TGF-β mediated hepatocyte apoptosis.Cell Death Dis. 2013 Jan 17;4(1):e466. doi: 10.1038/cddis.2012.204. Cell Death Dis. 2013. PMID: 23328673 Free PMC article.
-
Cooperation of liver cells in health and disease.Adv Anat Embryol Cell Biol. 2001;161:III-XIII, 1-151. doi: 10.1007/978-3-642-56553-3. Adv Anat Embryol Cell Biol. 2001. PMID: 11729749 Review.
-
Impact of HCV Infection on Hepatocyte Polarity and Plasticity.Pathogens. 2022 Mar 10;11(3):337. doi: 10.3390/pathogens11030337. Pathogens. 2022. PMID: 35335661 Free PMC article. Review.
Cited by
-
Transcriptomic, Proteomic, and Functional Long-Term Characterization of Multicellular Three-Dimensional Human Liver Microtissues.Appl In Vitro Toxicol. 2018 Mar 1;4(1):1-12. doi: 10.1089/aivt.2017.0022. Appl In Vitro Toxicol. 2018. PMID: 32953943 Free PMC article.
-
The level of caveolin-1 expression determines response to TGF-β as a tumour suppressor in hepatocellular carcinoma cells.Cell Death Dis. 2017 Oct 12;8(10):e3098. doi: 10.1038/cddis.2017.469. Cell Death Dis. 2017. PMID: 29022911 Free PMC article.
-
Fibrillar Collagen Type I Participates in the Survival and Aggregation of Primary Hepatocytes Cultured on Soft Hydrogels.Biomimetics (Basel). 2020 Jun 25;5(2):30. doi: 10.3390/biomimetics5020030. Biomimetics (Basel). 2020. PMID: 32630500 Free PMC article.
-
TGF-β in Hepatic Stellate Cell Activation and Liver Fibrogenesis-Updated 2019.Cells. 2019 Nov 11;8(11):1419. doi: 10.3390/cells8111419. Cells. 2019. PMID: 31718044 Free PMC article. Review.
-
Caveolin-1 and -2 regulate cell motility in castration-resistant prostate cancer.Res Rep Urol. 2018 Oct 3;10:135-144. doi: 10.2147/RRU.S173377. eCollection 2018. Res Rep Urol. 2018. PMID: 30324095 Free PMC article.
References
-
- Godoy P, Hengstler JG, Ilkavets I, Meyer C, Bachmann A, Muller A, Tuschl G, Mueller SO, Dooley S. Extracellular matrix modulates sensitivity of hepatocytes to fibroblastoid dedifferentiation and transforming growth factor beta-induced apoptosis. Hepatology. 2009;49:2031–2043. doi: 10.1002/hep.22880. - DOI - PubMed
LinkOut - more resources
Full Text Sources
Other Literature Sources
Research Materials
Miscellaneous
