. 2013 Apr;33(7):1303-16.
doi: 10.1128/MCB.00858-12. Epub 2013 Jan 22.

Short-chain fatty acids stimulate angiopoietin-like 4 synthesis in human colon adenocarcinoma cells by activating peroxisome proliferator-activated receptor γ

Affiliations

Short-chain fatty acids stimulate angiopoietin-like 4 synthesis in human colon adenocarcinoma cells by activating peroxisome proliferator-activated receptor γ

Sheril Alex et al. Mol Cell Biol. 2013 Apr.

Abstract

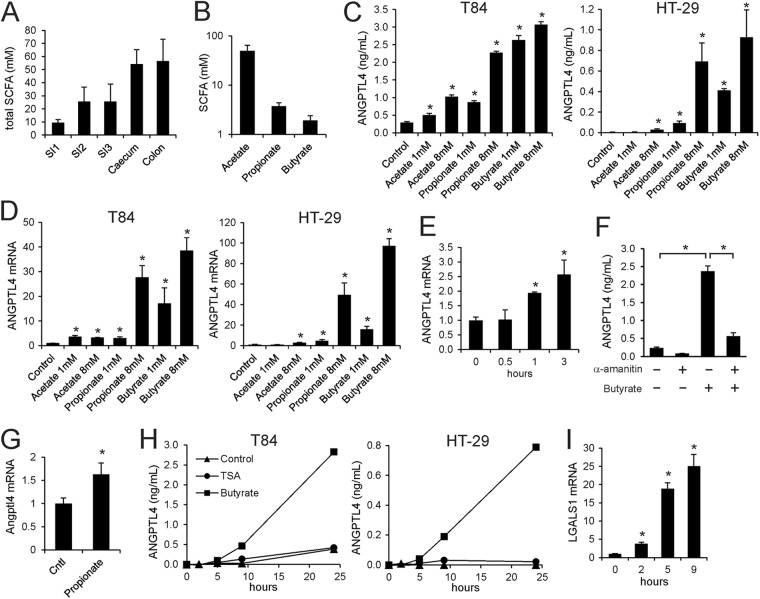
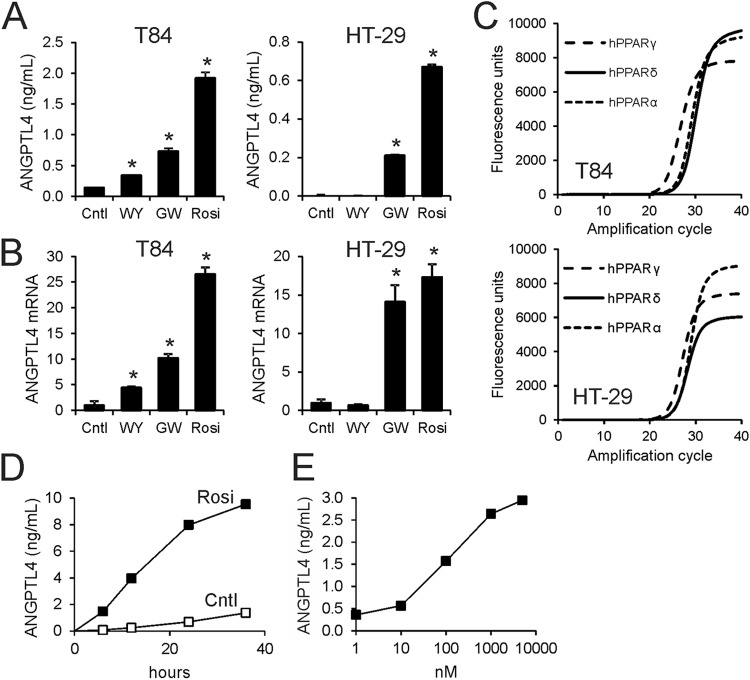
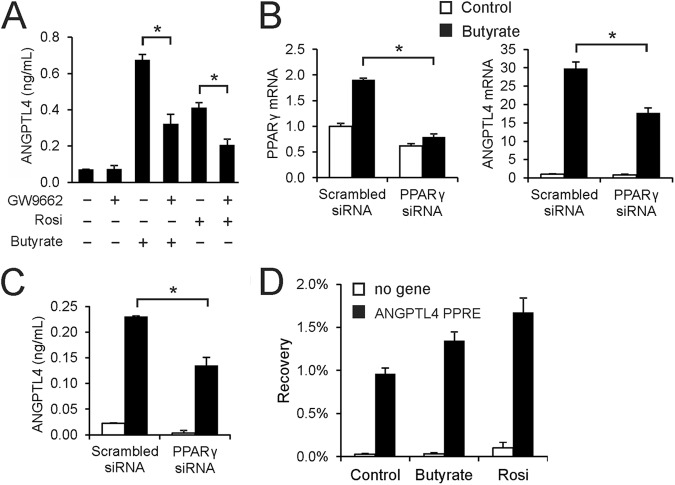
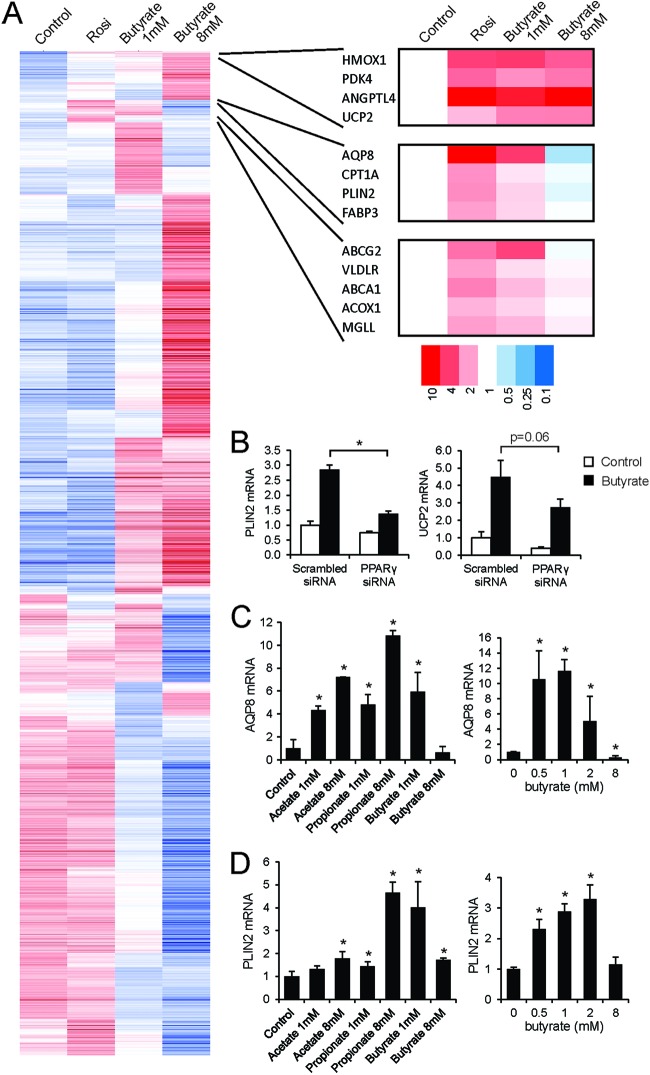
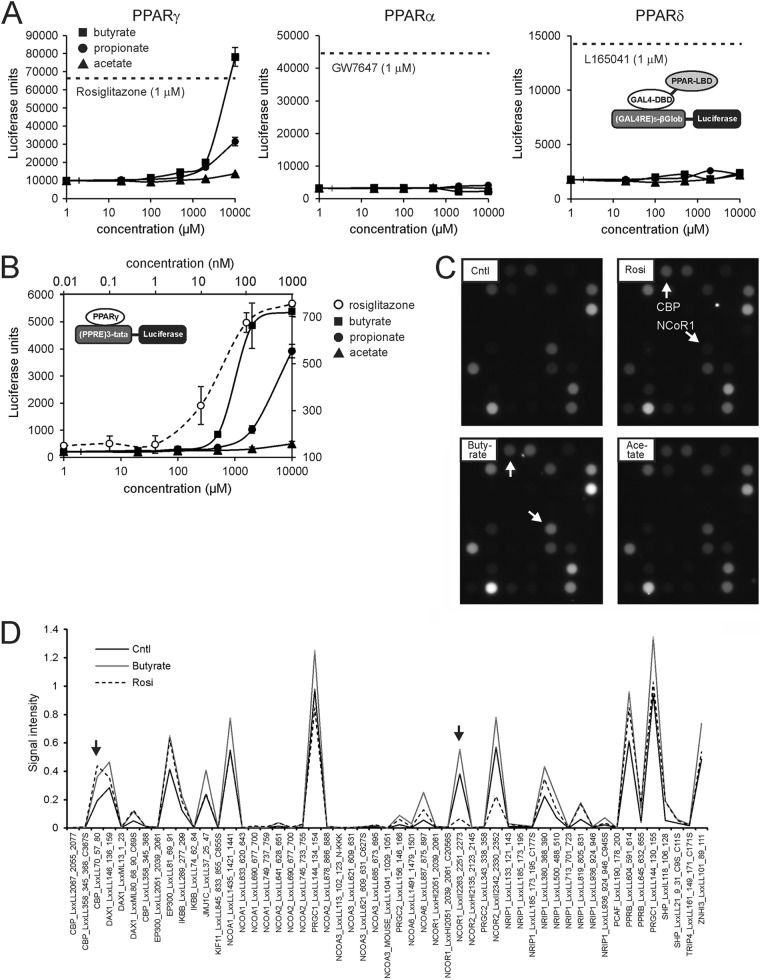
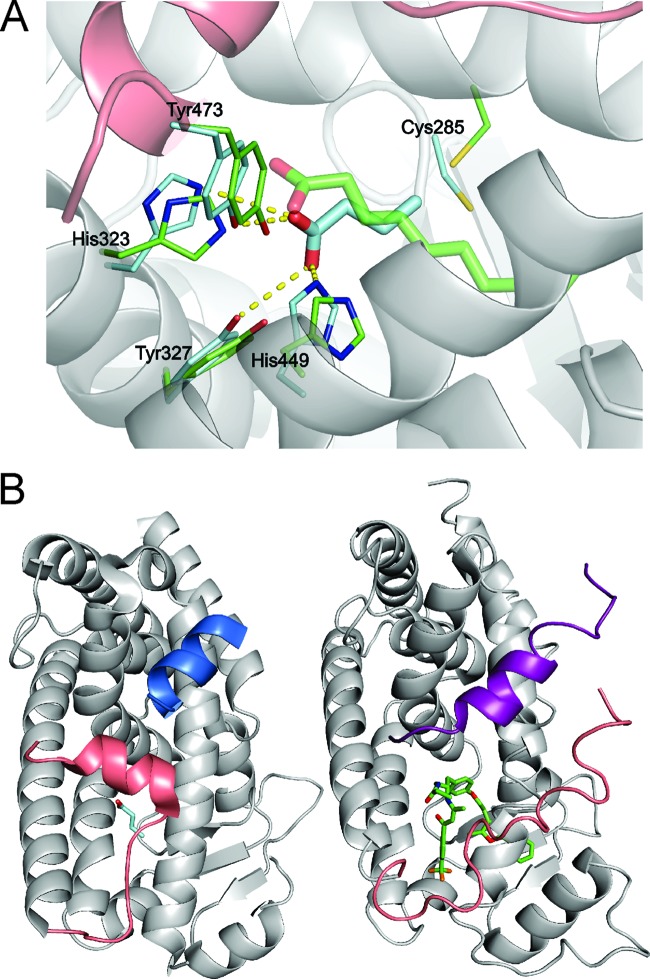
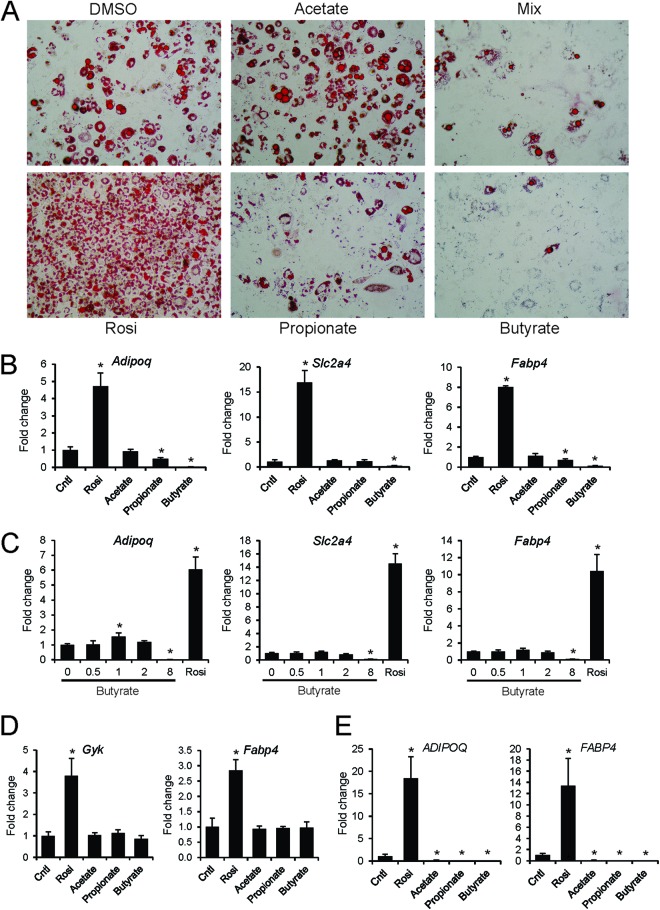
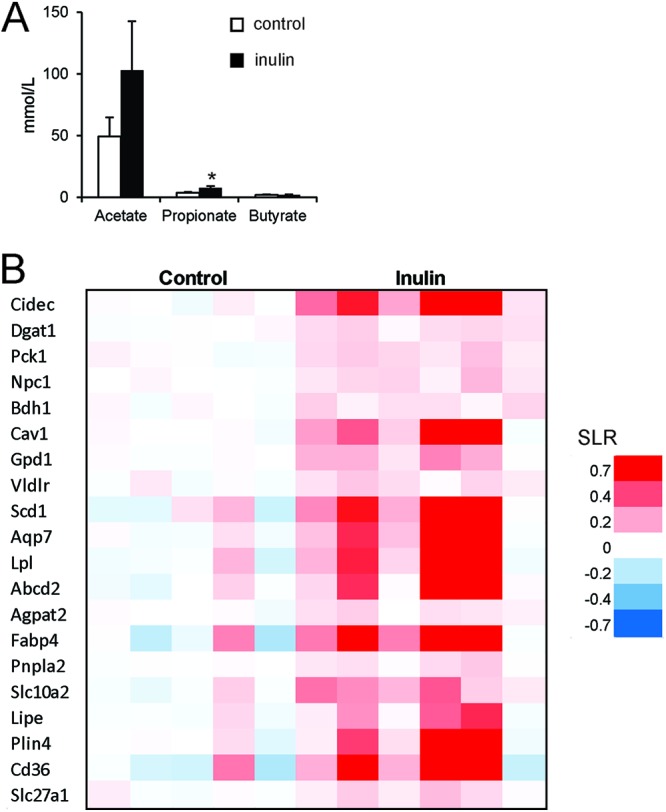
Angiopoietin-like protein 4 (ANGPTL4/FIAF) has been proposed as a circulating mediator between the gut microbiota and fat storage. Here, we show that transcription and secretion of ANGPTL4 in human T84 and HT29 colon adenocarcinoma cells is highly induced by physiological concentrations of short-chain fatty acids (SCFA). SCFA induce ANGPTL4 by activating the nuclear receptor peroxisome proliferator activated receptor γ (PPARγ), as demonstrated using PPARγ antagonist, PPARγ knockdown, and transactivation assays, which show activation of PPARγ but not PPARα and PPARδ by SCFA. At concentrations required for PPARγ activation and ANGPTL4 induction in colon adenocarcinoma cells, SCFA do not stimulate PPARγ in mouse 3T3-L1 and human SGBS adipocytes, suggesting that SCFA act as selective PPARγ modulators (SPPARM), which is supported by coactivator peptide recruitment assay and structural modeling. Consistent with the notion that fermentation leads to PPAR activation in vivo, feeding mice a diet rich in inulin induced PPAR target genes and pathways in the colon. We conclude that (i) SCFA potently stimulate ANGPTL4 synthesis in human colon adenocarcinoma cells and (ii) SCFA transactivate and bind to PPARγ. Our data point to activation of PPARs as a novel mechanism of gene regulation by SCFA in the colon, in addition to other mechanisms of action of SCFA.


Figures

Fig 1
Fig 1
Physiological concentrations of SCFA stimulate ANGPTL4 mRNA and protein secretion in colon adenocarcinoma cells. (A) Total SCFA concentration in different sections of the intestine of mice fed a low-fat diet. Errors bars represent SEM. (B) Concentration of individual SCFA in colon of mice fed a low-fat diet. Errors bars represent SEM. (C) ANGPTL4 concentration in medium of T84 and HT29 cells treated with SCFA for 24 h at the indicated concentrations. (D) ANGPTL4 mRNA in T84 and HT29 cells treated with SCFA for 24 h at the indicated concentrations. (E) Time course of induction of ANGPTL4 mRNA in T84 cells by butyrate (1 mM). (F) Inhibitory effect of α-amanitin (10 μg/ml) on induction of ANGPTL4 secretion by 1 mM butyrate in T84 cells. (G) Effect of rectal infusion of propionate on Angptl4 mRNA in epithelial scrapings of mouse colon. Errors bars represent SEM. (H) Time course of regulation of ANGPTL4 protein in medium of T84 and HT29 cells by trichostatin A (100 nM) and butyrate (8 mM). (I) Stimulatory effect of trichostatin A (100 nM) on LGALS1 mRNA in T84 cells. Error bars represent standard deviations (SD) except where indicated otherwise. An asterisk indicates a result significantly different from that of the control according to Student's t test (P < 0.05).
Fig 2
Fig 2
PPARγ potently stimulates ANGPTL4 in colon adenocarcinoma cells. Synthetic agonists for PPARα (Wy14643 [WY]; 5 μM), PPARδ (GW501516 [GW]; 1 μM), and PPARγ (rosiglitazone [Rosi]; 1 μM) stimulate ANGPTL4 secretion (A) and mRNA expression (B) in T84 and HT29 cells. Cntl, control. (C) Amplification curve of PPARα, PPARδ, and PPARγ mRNA as determined by qPCR of T84 and HT29 cells. Sizes of amplicons varied less than 10%. (D) Time course of induction of ANGPTL4 protein in medium by rosiglitazone (1 μM). (E) Dose-dependent induction of ANGPTL4 protein in medium by rosiglitazone. Unless indicated otherwise, cells were treated for 24 h. Error bars represent SD. An asterisk indicates a result significantly different from that of the control according to Student's t test (P < 0.05).
Fig 3
Fig 3
Induction of ANGPTL4 by butyrate is mediated by PPARγ. (A) Inhibitory effect of PPARγ antagonist GW9662 (5 μM) on induction of ANGPTL4 secretion in medium by rosiglitazone (10 nM) and butyrate (1 mM) in T84 cells. Effect of siRNA-mediated PPARγ knockdown (B, left) in T84 cells on butyrate-induced upregulation of ANGPTL4 mRNA (B, right) and ANGPTL4 protein in medium (C). (D) PPARγ ChIP-qPCR on selected loci in T84 cells treated with butyrate (8 mM) or rosiglitazone (1 μM) for 24 h. Bars represent the mean recovery plus ranges from two independent experiments. Error bars represent SD except when indicated otherwise. An asterisk indicates a significantly different result from that of the control according to Student's t test (P < 0.05).
Fig 4
Fig 4
Global effects of butyrate in T84 cells. T84 cells were treated with rosiglitazone (1 μM) or butyrate (1 and 8 mM) for 24 h and subjected to Affymetrix microarray analysis. (A) Hierarchical clustering based on Pearson's correlation with average linkage. (B) Effect of siRNA-mediated PPARγ knockdown in T84 cells on induction of PLIN2 and UCP2 mRNA by butyrate. AQP8 mRNA (C) and PLIN2 mRNA (D) levels were determined in T84 cells treated with SCFA for 24 h at the indicated concentrations. Error bars represent SD. An asterisk indicates a result significantly different from that of the control according to Student's t test (P < 0.05).
Fig 5
Fig 5
SCFA are agonists of PPARγ. (A) Stable GAL4-PPAR chimera reporter assay showing activation of PPARγ but not PPARα and PPARδ by SCFA at concentrations of ≥1 mM. The dotted lines represent the levels of luciferase activity reached upon incubation with synthetic PPAR agonists. Cells were treated for 24 h. Error bars represent SD. (B) Stable PPARγ reporter assay showing activation of PPARγ by SCFA at concentrations of ≥500 μM. Cells were treated for 24 h. Note the different x axis for rosiglitazone and the SCFA. Error bars represent SD. (C) A nuclear receptor PamChip assay was used to measure the interaction between PPARγ and immobilized peptides corresponding to specific coregulator-nuclear receptor binding regions in the presence and absence of rosiglitazone (1 μM), butyrate (40 mM), or acetate (40 mM). Representative images are shown. (D) Quantitation of the PamChip assay results for rosiglitazone and butyrate compared to the control. Arrows point to the same peptides as those described for panel C.
Fig 6
Fig 6
Modeling of butyrate into the PPARγ binding pocket. (A) The model reveals the complex between butyrate and PPARγ with the best HADDOCK score (butyrate is shown as cyan sticks), overlaid with the crystal structure of the decanoic acid complex with PPARγ (3U9Q, a decanoic acid, is shown as green sticks) by aligning the protein backbone atoms of the two structures (ribbon displayed for the HADDOCK model). The displayed protein side chains are shown as thin cyan or green sticks and the side chains making contacts with the docked butyrate or decanoic acid, respectively. Hydrogen bond contacts between the butyrate and the protein are shown as yellow dashed lines. (B) Comparison of the binding location for coactivator peptide PGC-1α (blue ribbon) bound to PPARγ (HADDOCK model of the PPARγ-butyrate complex, left) with the binding site for the SMRT corepressor peptide (purple ribbon) binding to PPARα (1KKQ; right) (69). In both structures, the C-terminal portion of the PPAR molecule that forms helix AF-2 is colored pink for comparison. The structures were aligned using the backbone atoms of the receptors.
Fig 7
Fig 7
Butyrate and propionate inhibit 3T3-L1 adipogenesis. (A) Oil red O staining of 3T3-L1 adipocytes at day 10 treated with SCFA (8 mM) from day 0. The mix contained 2.67 mM of each of the SCFA. (B) Expression of differentiation markers and PPARγ targets was determined by qPCR at day 4. (C) Concentration-dependent effect of butyrate on 3T3-L1 differentiation when added at day 0, as determined by expression of differentiation markers at day 4. (D) Effect of SCFA (8 mM) and rosiglitazone (1 μM) on expression of PPARγ targets in fully differentiated 3T3-L1 adipocytes. Cells were treated for 24 h. (E) Effect of SCFA (8 mM) and rosiglitazone (1 μM) added on day 1 on human SGBS adipocyte differentiation and expression of adipogenesis marker genes at day 15. Error bars represent SD. An asterisk indicates a result significantly different from that of the control according to Student's t test (P < 0.05).
Fig 8
Fig 8
Inulin feeding activates PPAR in colon. Mice were fed a diet enriched with inulin for 10 days. (A) Lumenal concentration of SCFA in the colon as determined by gas chromatography. Error bars represent SEM. (B) Gene expression changes in colon illustrated by heat map of genes belonging to the most significantly induced gene set, termed PPAR targets. SLR, signal log ratio.

References

    1. Sekirov I, Russell SL, Antunes LC, Finlay BB. 2010. Gut microbiota in health and disease. Physiol. Rev. 90: 859–904 - PubMed
    1. Backhed F, Ding H, Wang T, Hooper LV, Koh GY, Nagy A, Semenkovich CF, Gordon JI. 2004. The gut microbiota as an environmental factor that regulates fat storage. Proc. Natl. Acad. Sci. U. S. A. 101: 15718–15723 - PMC - PubMed
    1. Backhed F, Manchester JK, Semenkovich CF, Gordon JI. 2007. Mechanisms underlying the resistance to diet-induced obesity in germ-free mice. Proc. Natl. Acad. Sci. U. S. A. 104: 979–984 - PMC - PubMed
    1. Lichtenstein L, Kersten S. 2010. Modulation of plasma TG lipolysis by Angiopoietin-like proteins and GPIHBP1. Biochim. Biophys. Acta 1801: 415–420 - PubMed
    1. Yoshida K, Shimizugawa T, Ono M, Furukawa H. 2002. Angiopoietin-like protein 4 is a potent hyperlipidemia-inducing factor in mice and inhibitor of lipoprotein lipase. J. Lipid Res. 43: 1770–1772 - PubMed

Publication types

MeSH terms