

A novel approach to assess the probability of disease eradication from a wild-animal reservoir host
- PMID: 23339965
- PMCID: PMC9151828
- DOI: 10.1017/S095026881200310X
A novel approach to assess the probability of disease eradication from a wild-animal reservoir host
Abstract
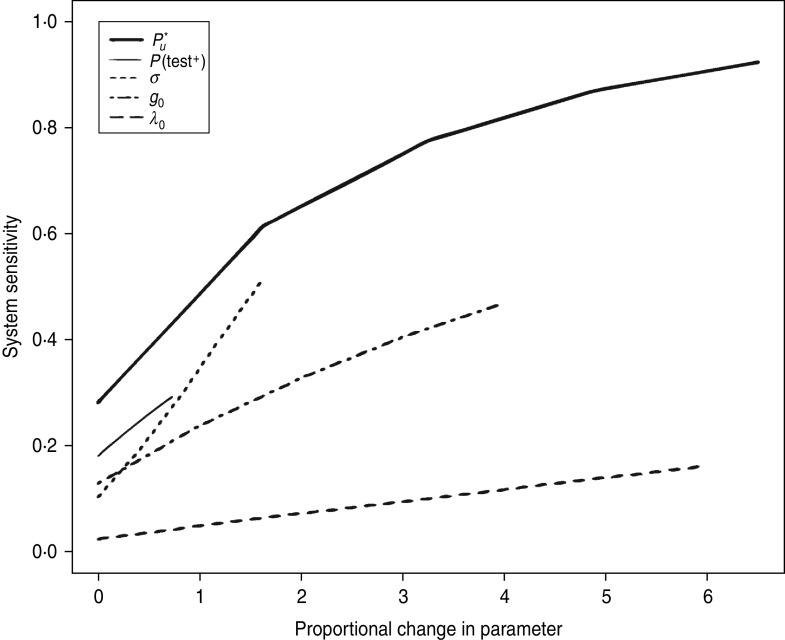
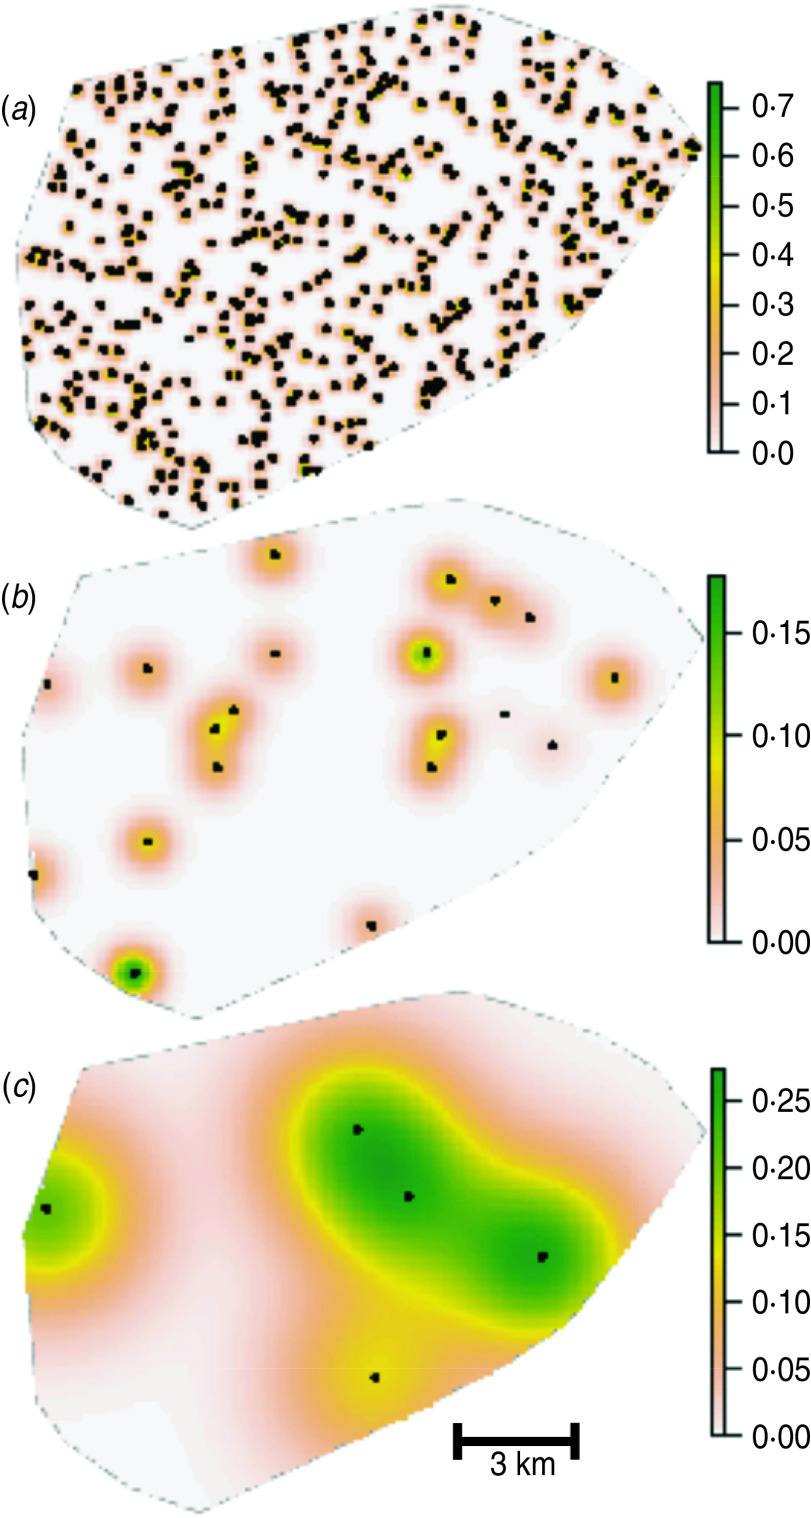
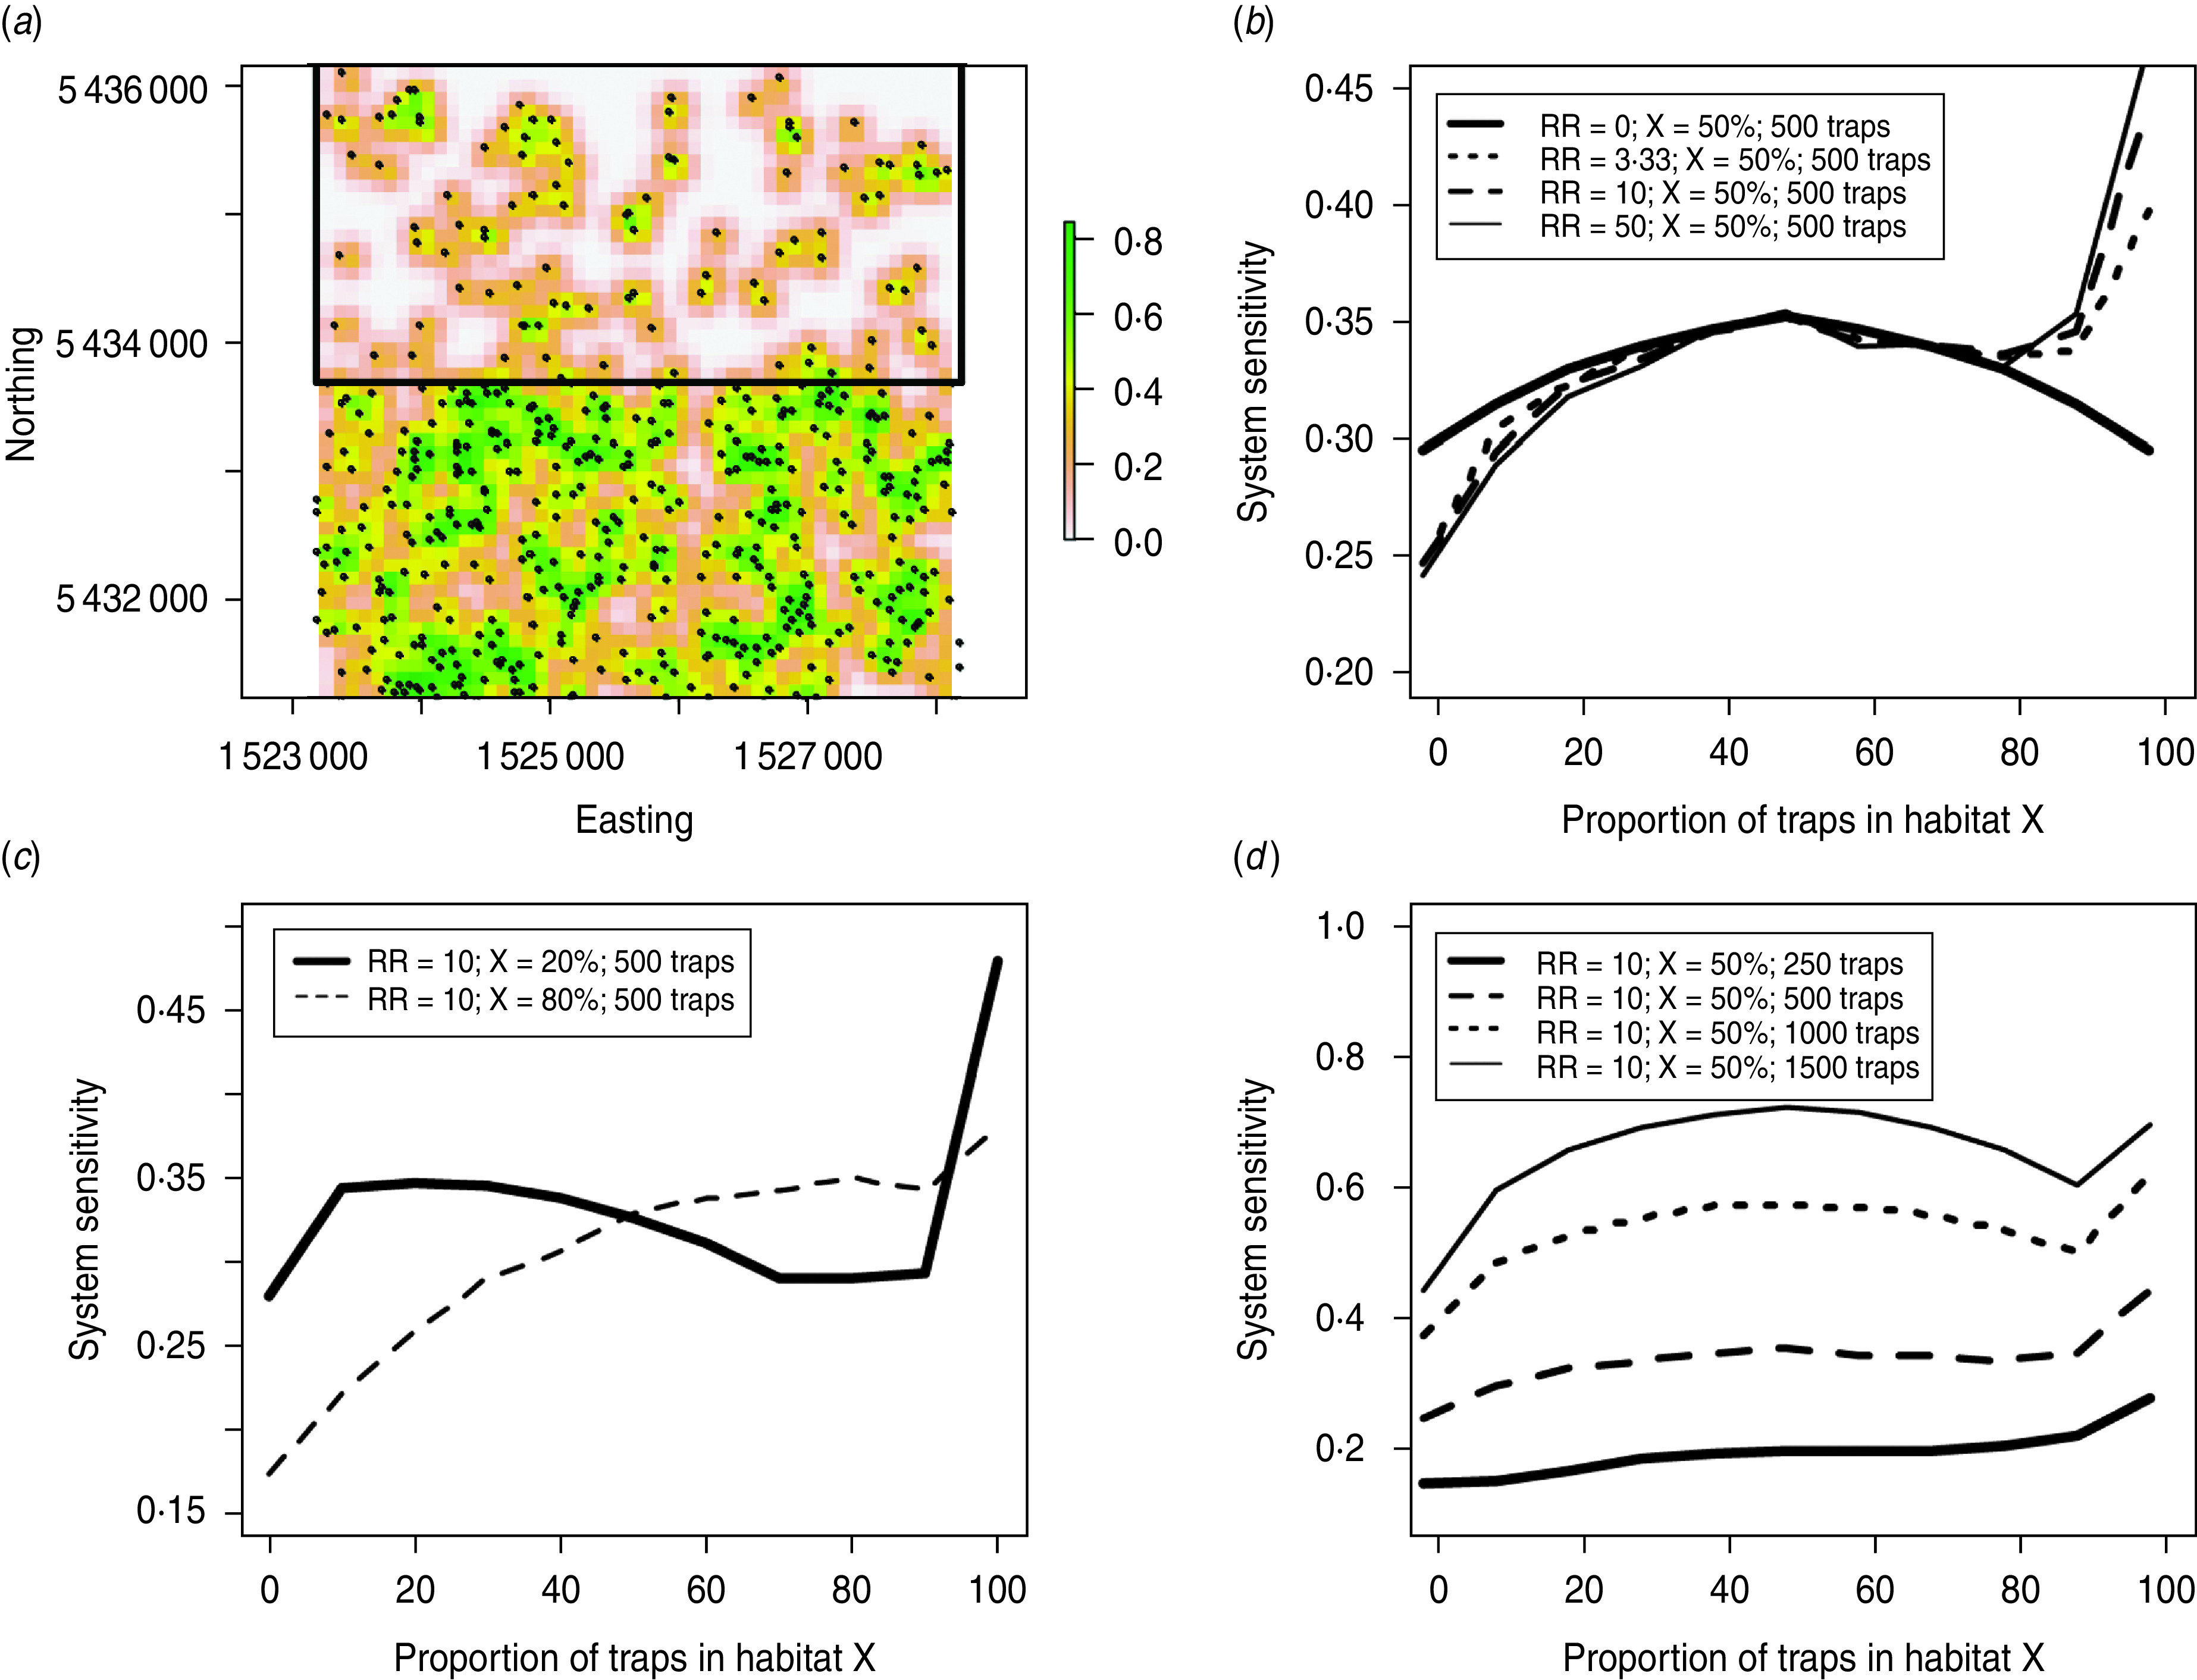
Surveying and declaring disease freedom in wildlife is difficult because information on population size and spatial distribution is often inadequate. We describe and demonstrate a novel spatial model of wildlife disease-surveillance data for predicting the probability of freedom of bovine tuberculosis (caused by Mycobacterium bovis) in New Zealand, in which the introduced brushtail possum (Trichosurus vulpecula) is the primary wildlife reservoir. Using parameters governing home-range size, probability of capture, probability of infection and spatial relative risks of infection we employed survey data on reservoir hosts and spillover sentinels to make inference on the probability of eradication. Our analysis revealed high sensitivity of model predictions to parameter values, which demonstrated important differences in the information contained in survey data of host-reservoir and spillover-sentinel species. The modelling can increase cost efficiency by reducing the likelihood of prematurely declaring success due to insufficient control, and avoiding unnecessary costs due to excessive control and monitoring.
Figures
References
-
- Gortázar C, et al. Diseases shared between wildlife and livestock: a European perspective. European Journal of Wildlife Research 2007; 53: 241–256.
-
- Artois M. Wildlife infectious disease control in Europe. Journal of Mountain Ecology 2003; 7: 89–97.
-
- Gortazar C, et al. Disease risks and overabundance of game species. European Journal of Wildlife Research 2006; 52: 81–87.
-
- Wobeser G. Disease management strategies for wildlife. Revue Scientifique et Technique de l'Office International des Epizooties 2002; 21: 159–178. - PubMed
Publication types
MeSH terms
LinkOut - more resources
Full Text Sources
Other Literature Sources
Medical
