

Contribution of OATP1B1 and OATP1B3 to the disposition of sorafenib and sorafenib-glucuronide
- PMID: 23340295
- PMCID: PMC3602278
- DOI: 10.1158/1078-0432.CCR-12-3306
Contribution of OATP1B1 and OATP1B3 to the disposition of sorafenib and sorafenib-glucuronide
Abstract
Purpose: Many tyrosine kinase inhibitors (TKI) undergo extensive hepatic metabolism, but mechanisms of their hepatocellular uptake remain poorly understood. We hypothesized that liver uptake of TKIs is mediated by the solute carriers OATP1B1 and OATP1B3.
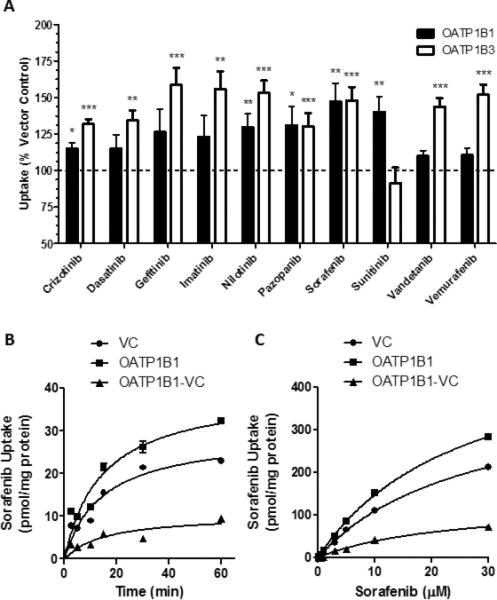
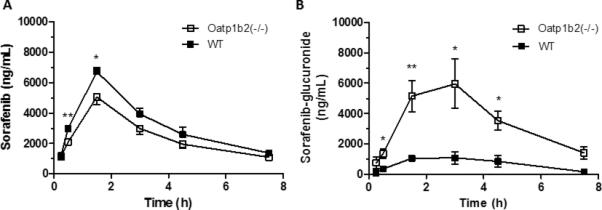
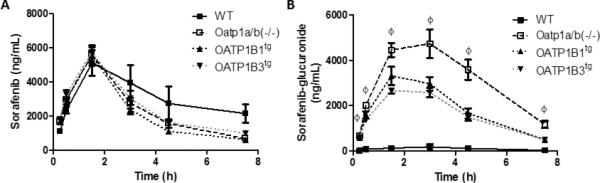
Experimental design: Transport of crizotinib, dasatinib, gefitinib, imatinib, nilotinib, pazopanib, sorafenib, sunitinib, vandetanib, and vemurafenib was studied in vitro using artificial membranes (PAMPA) and HEK293 cell lines stably transfected with OATP1B1, OATP1B3, or the ortholog mouse transporter, Oatp1b2. Pharmacokinetic studies were conducted with Oatp1b2-knockout mice and humanized OATP1B1- or OATP1B3-transgenic mice.
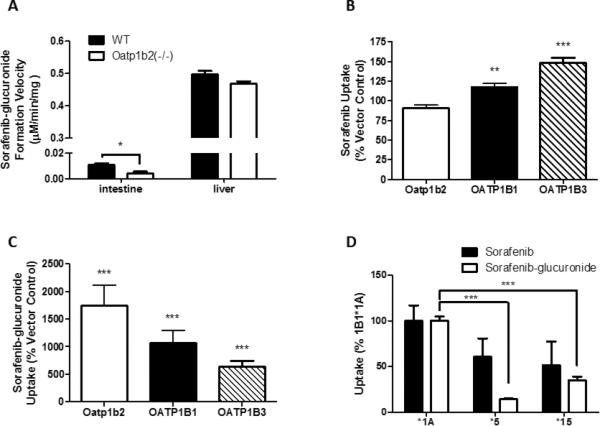
Results: All 10 TKIs were identified as substrates of OATP1B1, OATP1B3, or both. Transport of sorafenib was investigated further, as its diffusion was particularly low in the PAMPA assay (<4%) than other TKIs that were transported by both OATP1B1 and OATP1B3. Whereas Oatp1b2 deficiency in vivo had minimal influence on parent and active metabolite N-oxide drug exposure, plasma levels of the glucuronic acid metabolite of sorafenib (sorafenib-glucuronide) were increased more than 8-fold in Oatp1b2-knockout mice. This finding was unrelated to possible changes in intrinsic metabolic capacity for sorafenib-glucuronide formation in hepatic or intestinal microsomes ex vivo. Ensuing experiments revealed that sorafenib-glucuronide was itself a transported substrate of Oatp1b2 (17.5-fold vs. control), OATP1B1 (10.6-fold), and OATP1B3 (6.4-fold), and introduction of the human transporters in Oatp1b2-knockout mice provided partial restoration of function.
Conclusions: These findings signify a unique role for OATP1B1 and OATP1B3 in the elimination of sorafenib-glucuronide and suggest a role for these transporters in the in vivo handling of glucuronic acid conjugates of drugs.
Figures
Similar articles
-
Inhibition of OATP1B1 by tyrosine kinase inhibitors: in vitro-in vivo correlations.Br J Cancer. 2014 Feb 18;110(4):894-8. doi: 10.1038/bjc.2013.811. Epub 2014 Jan 7. Br J Cancer. 2014. PMID: 24398510 Free PMC article.
-
Influence of polymorphic OATP1B-type carriers on the disposition of docetaxel.Clin Cancer Res. 2012 Aug 15;18(16):4433-40. doi: 10.1158/1078-0432.CCR-12-0761. Epub 2012 Jun 18. Clin Cancer Res. 2012. PMID: 22711709 Free PMC article.
-
Characterization of organic anion transporting polypeptide (OATP)1B1 and OATP1B3 humanized rat as a translational model to study the pharmacokinetics of OATP1B substrate drugs.Drug Metab Dispos. 2025 Jul;53(7):100101. doi: 10.1016/j.dmd.2025.100101. Epub 2025 Jun 2. Drug Metab Dispos. 2025. PMID: 40554317
-
Role of the liver-specific transporters OATP1B1 and OATP1B3 in governing drug elimination.Expert Opin Drug Metab Toxicol. 2005 Oct;1(3):429-45. doi: 10.1517/17425255.1.3.429. Expert Opin Drug Metab Toxicol. 2005. PMID: 16863454 Review.
-
The impact of Organic Anion-Transporting Polypeptides (OATPs) on disposition and toxicity of antitumor drugs: Insights from knockout and humanized mice.Drug Resist Updat. 2016 Jul;27:72-88. doi: 10.1016/j.drup.2016.06.005. Epub 2016 Jun 25. Drug Resist Updat. 2016. PMID: 27449599 Review.
Cited by
-
Sunitinib Possible Sex-Divergent Therapeutic Outcomes.Clin Drug Investig. 2016 Oct;36(10):791-9. doi: 10.1007/s40261-016-0428-5. Clin Drug Investig. 2016. PMID: 27318944 Review.
-
Exposure-toxicity relationship of sorafenib in Japanese patients with renal cell carcinoma and hepatocellular carcinoma.Clin Pharmacokinet. 2014 Feb;53(2):185-96. doi: 10.1007/s40262-013-0108-z. Clin Pharmacokinet. 2014. PMID: 24135988
-
Inhibition of OATP1B1 by tyrosine kinase inhibitors: in vitro-in vivo correlations.Br J Cancer. 2014 Feb 18;110(4):894-8. doi: 10.1038/bjc.2013.811. Epub 2014 Jan 7. Br J Cancer. 2014. PMID: 24398510 Free PMC article.
-
Uptake Transporters of the SLC21, SLC22A, and SLC15A Families in Anticancer Therapy-Modulators of Cellular Entry or Pharmacokinetics?Cancers (Basel). 2020 Aug 12;12(8):2263. doi: 10.3390/cancers12082263. Cancers (Basel). 2020. PMID: 32806706 Free PMC article. Review.
-
Acute kidney injury and delayed methotrexate clearance in an adult patient with Philadelphia chromosome-positive acute lymphoblastic leukaemia treated with imatinib.Eur J Hosp Pharm. 2023 Sep;30(5):e28. doi: 10.1136/ejhpharm-2022-003453. Epub 2023 Feb 2. Eur J Hosp Pharm. 2023. PMID: 36732034 Free PMC article.
References
-
- Caraglia M, Santini D, Bronte G, Rizzo S, Sortino G, Rini GB, et al. Predicting efficacy and toxicity in the era of targeted therapy: focus on anti-EGFR and anti-VEGF molecules. Curr Drug Metab. 2011;12:944–55. - PubMed
-
- Di Gion P, Kanefendt F, Lindauer A, Scheffler M, Doroshyenko O, Fuhr U, et al. Clinical pharmacokinetics of tyrosine kinase inhibitors: focus on pyrimidines, pyridines and pyrroles. Clin Pharmacokinet. 2011;50:551–603. - PubMed
-
- Scheffler M, Di Gion P, Doroshyenko O, Wolf J, Fuhr U. Clinical pharmacokinetics of tyrosine kinase inhibitors: focus on 4-anilinoquinazolines. Clin Pharmacokinet. 2011;50:371–403. - PubMed
Publication types
MeSH terms
Substances
Grants and funding
LinkOut - more resources
Full Text Sources
Other Literature Sources
Molecular Biology Databases
