. 2013 Mar 15;19(6):1375-88.
doi: 10.1158/1078-0432.CCR-12-2858. Epub 2013 Jan 22.

Rab25 regulates invasion and metastasis in head and neck cancer

Affiliations

Rab25 regulates invasion and metastasis in head and neck cancer

Panomwat Amornphimoltham et al. Clin Cancer Res. .

Abstract

Purpose: Head and neck squamous cell carcinoma (HNSCC) is one of the 10 most common cancers with a 50% five-year survival rate, which has remained unchanged for the past three decades. One of the major reasons for the aggressiveness of this cancer is that HNSCCs readily metastasize to cervical lymph nodes that are abundant in the head and neck region. Hence, discovering new molecules controlling the metastatic process as well as understanding their regulation at the molecular level are essential for effective therapeutic strategies.

Experimental design: Rab25 expression level was analyzed in HNSCC tissue microarray. We used a combination of intravital microscopy in live animals and immunofluorescence in an in vitro invasion assay to study the role of Rab25 in tumor cell migration and invasion.

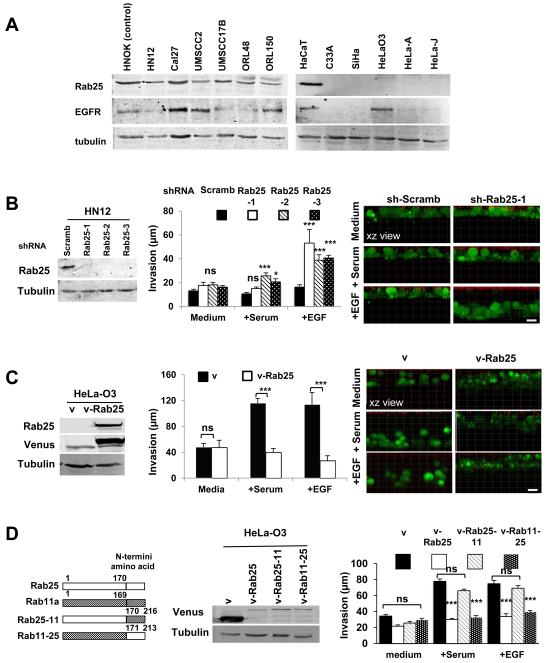
Results: In this study, we identified the small GTPase Rab25 as a key regulator of HNSCC metastasis. We observed that Rab25 is downregulated in HNSCC patients. Next, we determined that reexpression of Rab25 in a metastatic cell line is sufficient to block invasion in a three-dimensional collagen matrix and metastasis to cervical lymph nodes in a mouse model for oral cancer. Specifically, Rab25 affects the organization of F-actin at the cell surface, rather than cell proliferation, apoptosis, or tumor angiogenesis.

Conclusion: These findings suggest that Rab25 plays an important role in tumor migration and metastasis, and that understanding its function may lead to the development of new strategies to prevent metastasis in oral cancer patients.


Figures

Figure 1
Figure 1. Rab25 expression in human head and neck squamous cell carcinoma (HNSCC)
A. Representative core tissues from a human oral cancer tissue array stained using an antibody directed against human Rab25. Tissues were grouped according to the TNM classification (T1, T2, T3, T4 and Met = metastasis). Rab25 immunoreaction in more differentiated (asterisk) and less differentiated (arrowhead) cells. The insets show higher magnification of the staining pattern of cancer cells. B. Quantitative analysis of Rab25 expression from human normal and oral cancer tissue array. *** p< 0.0001; One-way ANOVA, n= number of tissue cores
Figure 2
Figure 2. Rab25 controls tumor cell invasion in a three-dimensional in vitro model
A. The protein levels of RAB25 and EGFR were determined by Western blot in a cancer cells panel using human normal oral keratinocytes as control. Tubulin was used as loading control. B, C. Invasion assay in collagen type I matrix. HN12 cells were engineered to stably express shRNA for RAB25 (sh-Rab25) or control scramble shRNA (sh-Scramb) (B, Western blot - left panels), whereas Hela-O3 cells were engineered to express venus-RAB25 (v-Rab25) or venus (v) as control (C, Western blot - left panels). D. Western blot and collagen matrix invasion assay of Hela-O3 cells expressing v, v-Rab25, vRab25-11 and vRab11-25. EGF (10 ng/ml) or serum was used as chemoattractants. The volume rendering from Z-stacks was performed using Imaris (Bitplane). The extent of invasion was assessed by measuring the distance of the cell front from the top of the matrix that was marked by fluorescent beads (red). Data represent mean ± SEM from eight random fields (ns: not statistically significant, * and ***; p<0.01 and p<0.0001 respectively; One-way ANOVA in B and D and unpaired t-test in C). Scale bars, 20 μm
Figure 3
Figure 3. Rab25 controls tongue cancer metastases in vivo
Tumor cells lines (HN12 in A; HeLa-O3 and HeLa-A in B; HeLa-O3-v; HeLa-O3-vRab25 in C and Hela-O3-v, -v-Rab25, -v-Rab25-11 and, -v-Rab11-25 in D) were transplanted into the lateral tongues of immunocompromised mice. Mice were euthanized after 60 days. Tongue primary tumors and cervical lymph nodes were removed for histopathological evaluation. Histology of whole tongue tumors and metastasis in cervical lymph node are depicted from representative tissue for each tumor cell (A. HN12 B. HeLa-O3 and C. HeLa-O3-v). Broken lines indicate the tumor mass border. High magnification insets are in the right panels. Quantitative data represent percentage of mice with tumor burden or cervical lymph nodes metastasis (LN met= lymph nodes metastasis, n = number of mice). Quantitative analysis of tumor burden and LN metastasis are shown in graphs (ns: not statistically significant, ** and *** p< 0.001 and p< 0.0001 respectively; Fisher’s exact test in A, B and C and; Chi-square test in D.
Figure 4
Figure 4. Intravital imaging of the tongue cancer model
A. Schematic drawings of the tongue holding device, animal set up for intravital imaging, and primary tumor mass growing in the tongue. B. Intravital microscopy of tongue cancer at the primary site. Hela-O3 cells expressing H2B-GFP were transplanted into the tongue submucosa. Before imaging, a 70 kDa dextran was injected systemically to reveal stromal cells. A Z-scan was performed by using two-photon microscopy (60× water immersion lens, NA 1.2, Olympus). The same area was imaged using either 750 nm (upper panels) or 930 nm (lower panels) as excitation wavelengths. Both conditions revealed tumor cells (green) and stromal cells (red). However, the excitation at 750 nm revealed the tongue parenchyma (cyan), whereas the excitation at 930 nm revealed components of the extracellular matrix and myosin filaments from the muscle fibers (cyan). Scale bars, 20 μm.
Figure 5
Figure 5. Long-term imaging of the tongue cancer
(A-F) Hela-O3 cells expressing either venus (A, B) or H2B-GFP (C-F) were transplanted into the tongue submucosa, as described in Material and Methods. A. After 7 days from the injection, the edges of the tumor were imaged on a daily basis by using two-photon microscopy (excitation wavelength of 930 nm) to reveal collagen fibers (red) and the tumor mass (green). Z-stacks were acquired at day 7 (D7), 8 (D8), and 9 (D9) by using a 25X water lens (N.A. 1.05, Olympus). 3D reconstructions (upper panels, yz view) and maximal projections of the xy view were performed by using Imaris (Bitplane) (middle and lower panels). The extracellular matrix at the surface of the tongue was used as a reference point (middle panels, arrows). Individual tumor cells were observed migrating from the tumor mass (arrowheads). Bar 50 μm. B After 14 days, the edge of the tumor was imaged as described above by performing Z-stacks for two hours at 5 min interval. Individual cells were observed leaving the tumor mass (insets, red arrowheads). Bar, 20 μm. C, D. Texas Red-dextran (70 kDa) was injected in the tongue in order to map the lymphatic vessels, and Z-scan were performed, as described above. Maximal projections show tumor cells expressing H2B-GFP (green) either in proximity (C) or inside lymphatic vessels (D). Note collagen fibers in C (cyan). E, F. Dextran (70 kDa) was intravenously injected to label blood vessels and stromal cells, and cervical lymph nodes were exposed and imaged as described above. E. Tumor cells (green) colonized a cervical lymph node: stromal cells (red) and collagen fibers (cyan). F. Tumor cells (green) are in close proximity to a blood vessel (red). Bars, 50 μm
Figure 6
Figure 6. RAB25 expression inhibits lymphatic metastasis in tongue cancer
HeLa-O3 cells expressing RFP (red) or venus-Rab25 (green) were co-transplanted into the lateral tongue of immunocompromised mice. A, B. The edges of the tumor were imaged on a daily basis by intravital two-photon microscopy, as described in Fig. 5. A. Tumor mass after 9 days (D9). B. Maximal projections of the tumor mass imaged at day 17 (D17), 18 (D18) and 19 (D19). Note that the tumor cells lacking Rab25 (red) migrate from the tumor mass that is mainly formed by cells expressing Rab25 (green). Bars, 50 μm. C. After 30 days, tumors and cervical lymph nodes were removed, fixed and processed as described in Material and Methods. Tissue cryosections were labeled with an antibody directed against Lyve-1, a marker for lymphatic vessels (cyan). Primary tumors are shown in the left and the middle panel. Note that only cell lacking Rab25 are able to invade the lymphatic vessels (middle panel) and colonize the cervical lymph node (right panel)
Figure 7
Figure 7. RAB25 expression reduces actin-rich protrusion in tumor cells
A. Intravital two-photon microscopy of tongue tumors from HeLa-O3 expressing venus (left panel) or venus-Rab25 (right panel). Cells lacking Rab25 exhibit dynamics protrusions (arrowheads and Supplementary Movie 4). B. HeLa-O3 cells expressing venus (left) or venus-Rab25 (right) were allowed to invade a 3D collagen matrix, fixed, and labeled with phalloidin. In cells lacking Rab25, actin-rich protrusions are clearly visible at the cell surface. C. Mouse tongue xenograft tissues from HeLa-O3 expressing venus (left) or venus-Rab25 (right) were stained with phalloidin (overlay) and phalloidin alone (lower panel). Broken lines indicated the approximate tumor cell borders. Arrowheads indicate the thick actin structures at cell protrusions. D. Intravital imaging of tumor cells expressing lifeactGFP in HeLa-O3 expressing RFP (left) or RFPRab25 (right) in tongue tumors. Arrowheads indicate the thick actin structures at cell protrusions. Scale Bars, 20 μm. E. Quantification of F-actin at the plasma membrane. Actin expression (phalloidin staining and Lifeact expression) from HeLa-O3 and HeLa-O3-Rab25 cells was analyzed by ImageJ software as described in the Materials and Methods. The graphs represent the pixel intensity at the plasma membrane of each cell (mean±SE) (* and ***; p<0.01 and p<0.0001 respectively; unpaired t-test). F. Collagen invasion assay of HeLa-O3-v cells stimulated with EGF (10 ng/ml) in the presented or absent of actin polymerization inhibitors (10 μM of cytochalasin D-cytoD and 1 μM of latrunculin A-latA). Cell invasion quantification was conducted as described in Fig 2. Data represent mean ± SEM from eight random fields (ns: not statistically significant, * and ***; p<0.01 and p<0.0001 respectively; One-way ANOVA)

Similar articles

Cited by

References

    1. Gale NPB, Sidransky D, Westra W, Califano J. Tumours of the hypopharynx, larynx and trachea (Epithelial precursor lesions) In: Barnes LEJ, Reichart P, Sidransky D, editors. World Health Organization Classification of Tumours Pathology & genetics Head and neck tumours International Agency for Research on Cancer (IARC) IARC Press; Lyon: 2005. pp. 140–3.
    1. Haddad RI, Shin DM. Recent Advances in Head and Neck Cancer. New England Journal of Medicine. 2008;359:1143–54. - PubMed
    1. Siegel R, Naishadham D, Jemal A. Cancer statistics, 2012. CA Cancer J Clin. 2012;62:10–29. - PubMed
    1. Valastyan S, Weinberg RA. Tumor metastasis: molecular insights and evolving paradigms. Cell. 2011;147:275–92. - PMC - PubMed
    1. Ridley AJ. Life at the Leading Edge. Cell. 2011;145:1012–22. - PubMed

Publication types

MeSH terms