

Unraveling quantum pathways using optical 3D Fourier-transform spectroscopy
- PMID: 23340430
- PMCID: PMC3562465
- DOI: 10.1038/ncomms2405
Unraveling quantum pathways using optical 3D Fourier-transform spectroscopy
Abstract
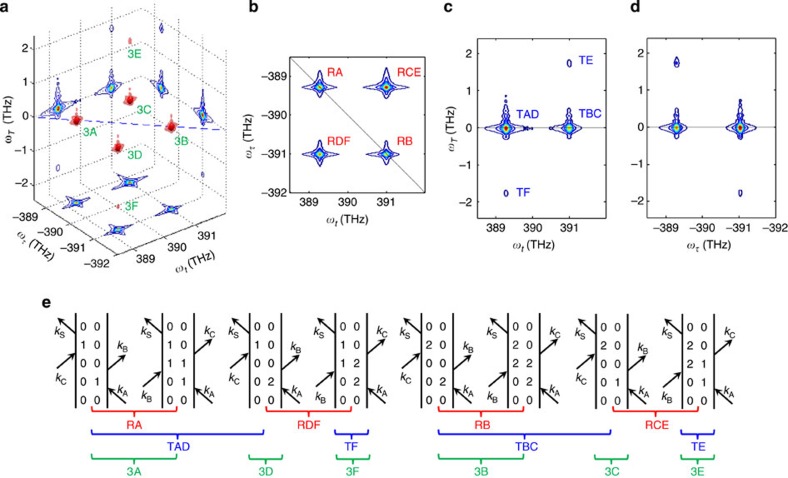
Predicting and controlling quantum mechanical phenomena require knowledge of the system Hamiltonian. A detailed understanding of the quantum pathways used to construct the Hamiltonian is essential for deterministic control and improved performance of coherent control schemes. In complex systems, parameters characterizing the pathways, especially those associated with inter-particle interactions and coupling to the environment, can only be identified experimentally. Quantitative insight can be obtained provided the quantum pathways are isolated and independently analysed. Here we demonstrate this possibility in an atomic vapour using optical three-dimensional Fourier-transform spectroscopy. By unfolding the system's nonlinear response onto three frequency dimensions, three-dimensional spectra unambiguously reveal transition energies, relaxation rates and dipole moments of each pathway. The results demonstrate the unique capacity of this technique as a powerful tool for resolving the complex nature of quantum systems. This experiment is a critical step in the pursuit of complete experimental characterization of a system's Hamiltonian.
Figures


Similar articles
-
Optical two-dimensional fourier transform spectroscopy of semiconductor quantum wells.Acc Chem Res. 2009 Sep 15;42(9):1423-32. doi: 10.1021/ar9000636. Acc Chem Res. 2009. PMID: 19555068
-
Exciton-exciton correlations revealed by two-quantum, two-dimensional fourier transform optical spectroscopy.Acc Chem Res. 2009 Sep 15;42(9):1452-61. doi: 10.1021/ar900122k. Acc Chem Res. 2009. PMID: 19691277
-
Coherent two-dimensional Fourier transform spectroscopy using a 25 Tesla resistive magnet.Rev Sci Instrum. 2019 Jun;90(6):063901. doi: 10.1063/1.5055891. Rev Sci Instrum. 2019. PMID: 31255018
-
Deconvolution of optical multidimensional coherent spectra.Sci Adv. 2018 Jun 1;4(6):eaar7697. doi: 10.1126/sciadv.aar7697. eCollection 2018 Jun. Sci Adv. 2018. PMID: 29868644 Free PMC article.
-
Two-dimensional infrared spectroscopy of intermolecular hydrogen bonds in the condensed phase.Acc Chem Res. 2009 Sep 15;42(9):1220-8. doi: 10.1021/ar900006u. Acc Chem Res. 2009. PMID: 19425543 Review.
Cited by
-
Fully absorptive 3D IR spectroscopy using a dual mid-infrared pulse shaper.J Chem Phys. 2013 Oct 14;139(14):144205. doi: 10.1063/1.4824638. J Chem Phys. 2013. PMID: 24116612 Free PMC article.
-
Multi-heterodyne two dimensional coherent spectroscopy using frequency combs.Sci Rep. 2017 Oct 25;7(1):14018. doi: 10.1038/s41598-017-14537-z. Sci Rep. 2017. PMID: 29070889 Free PMC article.
-
Molecular decision trees realized by ultrafast electronic spectroscopy.Proc Natl Acad Sci U S A. 2013 Oct 22;110(43):17183-8. doi: 10.1073/pnas.1314978110. Epub 2013 Sep 16. Proc Natl Acad Sci U S A. 2013. PMID: 24043793 Free PMC article.
-
Testing for memory-free spectroscopic coordinates by 3D IR exchange spectroscopy.Proc Natl Acad Sci U S A. 2014 Jul 22;111(29):10462-7. doi: 10.1073/pnas.1406967111. Epub 2014 Jul 7. Proc Natl Acad Sci U S A. 2014. PMID: 25002483 Free PMC article.
-
Mechanistic insight into internal conversion process within Q-bands of chlorophyll a.Sci Rep. 2017 Sep 12;7(1):11389. doi: 10.1038/s41598-017-11621-2. Sci Rep. 2017. PMID: 28900171 Free PMC article.
References
-
- Brumer P. & Shapiro M.. Control of unimolecular reactions using coherent-light. Chem. Phys. Lett. 126, 541–546 (1986) .
-
- Warren W. S., Rabitz H. & Dahleh M.. Coherent control of quantum dynamics—the dream is alive. Science 259, 1581–1589 (1993) . - PubMed
-
- Potter E. D., Herek J. L., Pedersen S., Liu Q. & Zewail A. H.. Femtosecond laser control of a chemical reaction. Nature 355, 66–68 (1992) .
-
- Zhu L. C. et al. Coherent laser control of the product distribution obtained in the photoexcitation of HI. Science 270, 77–80 (1995) .
-
- Assion A. et al. Control of chemical reactions by feedback-optimized phase-shaped femtosecond laser pulses. Science 282, 919–922 (1998) . - PubMed
Publication types
LinkOut - more resources
Full Text Sources
Other Literature Sources
