. 2013:4:1393.
doi: 10.1038/ncomms2393.

MicroRNA-30c inhibits human breast tumour chemotherapy resistance by regulating TWF1 and IL-11

Affiliations

MicroRNA-30c inhibits human breast tumour chemotherapy resistance by regulating TWF1 and IL-11

Jessica Bockhorn et al. Nat Commun. 2013.

Abstract

Chemotherapy resistance frequently drives tumour progression. However, the underlying molecular mechanisms are poorly characterized. Epithelial-to-mesenchymal transition has been shown to correlate with therapy resistance, but the functional link and signalling pathways remain to be elucidated. Here we report that microRNA-30c, a human breast tumour prognostic marker, has a pivotal role in chemoresistance by a direct targeting of the actin-binding protein twinfilin 1, which promotes epithelial-to-mesenchymal transition. An interleukin-6 family member, interleukin-11 is identified as a secondary target of twinfilin 1 in the microRNA-30c signalling pathway. Expression of microRNA-30c inversely correlates with interleukin-11 expression in primary breast tumours and low interleukin-11 correlates with relapse-free survival in breast cancer patients. Our study demonstrates that microRNA-30c is transcriptionally regulated by GATA3 in breast tumours. Identification of a novel microRNA-mediated pathway that regulates chemoresistance in breast cancer will facilitate the development of novel therapeutic strategies.


Figures
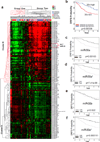
Figure 1
Figure 1. miRNA profiling of human breast tumours
a. Heat map diagram with two-way unsupervised hierarchical clustering of miRNAs and breast tumour samples. Each row represents a miRNA and each column represents a sample. The miRNA clustering tree is shown on the left (Cluster A and B), and the sample clustering tree appears at the top (Group One and Two). The colour scale shown in the map illustrates the relative expression level of a miRNA across all samples: red represents an expression level above the mean; green represents expression lower than the mean. Black means median expression. Levels of 152 miRNAs passed filtering and shown from 51 frozen human breast samples (46 breast tumours and 5 normal mammary tissues). NL-normal-like, LA-luminal A, LB-luminal B, B-basal-like, H-HER2-enriched, C-claudin-low, U-undetermined, N-normal (normal breast tissue adjacent to tumours). b–f. Kaplan-Meier plots of distant relapse-free survival (DRFS) based on the expression of miR-30 family members (30c, 30a, 30a*, 30b, and 30e*). Associations of miR-30 members with DRFS were analysed with GSE22216 breast cancer data set (n=210) deposited by Buffa et al. To define low (blue) and high (red) expressers, samples were ranked ordered based on miRNA30 expression and the top 50% samples were defined as high expressers. Log rank test p values are shown.
Figure 2
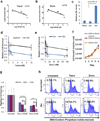
Figure 2. miR-30c corresponds to and regulates chemo-resistance of breast cancer cells
a–b. Association of Log2-transformed miR-30c expression (fold) with the survival (log2-transformed AUC) of breast cancer cell lines (n=6, T47D, MCF-7, MDA-MB-231, BT20, HCC70, and HCC38) in response to paclitaxel (Taxol) at 0.1–50 nM (a) and doxorubicin at 1–500 nM (b). A linear correlation test p=0.04 for both association studies. c. Log2-transformed expression levels of miR-30c in MDA-MB-231 cells 48hrs after oligo transfections, measured by real-time PCR. P=2.47E-12 by a T test (n=3). Error bars represent the standard deviation (SD) of the mean. d–e. Cell survival of MDA-MB-231 cells after transient transfection of scrambled control and mature miR-30c oligos, upon 72-hr exposure to different doses of paclitaxel (Taxol, d) and doxorubicin (Doxo, e). T test p=0.00022 (0.5 nM), 0.00014 (1.0 nM), and 0.00191 (10 nM) for Taxol treatment, and p=0.00802 (10 nM) and 0.00212 (100 nM) for Doxo treatment, comparing 30c samples to Scr samples (n=6). Error bars: SD. f. No significant effect of transient transfection of miR-30c on the growth rate of MDA-MD-231 cells, compared to a mock transfection control and a scrambled RNA mimic control. Error bars: SD. g. miR-30c sensitized the drug response of BT-20 breast cancer cells to 48 hr-treatment of doxorubicin (100nM) and paclitaxel (Taxol, 10nM). When comparing 30c to controls, T test p=5.52E-07 (mock) and 0.0003 (Scr) for Doxo, p=0.0066 (mock) and 0.0009 (Scr) for Taxol (n=5). Error bars: SD. h. Representative flow profiles of BT20 breast cancer cell DNA content upon 24-hr treatment of paclitaxel (Taxol, 10nM) or doxorubicin (Doxo, 100nM). The gated sub-G1 population represents early apoptotic cells. SD values of the mean are shown.
Figure 3
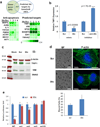
Figure 3. miR-30c regulates EMT and directly targets TWF1
a. Genes suppressed by miR-30c in breast cancer cells. Top panel: Left circle shows the microarray data of 293 genes significantly inhibited by miR-30c in MDA-MB-231 cells (See Suppl. Table 2). The right circle indicates the genes predicted as direct targets of miR-30c by Geneset2miR (by ≥4 of 11 algorithms) and overlapped genes are 77 (Suppl. Table 3). Bottom left panel: Heatmap for 8 anti-apoptotic genes inhibited by miR-30c. Bottom right panel: Heatmap for predicted direct targets, down-regulated in miR-30c–transfected cells. Green boxes are color-coded based on log2-transformed expression reduction levels for 4 pairs of 30c/scrambled microarray comparisons. b. Expression levels of TWF1 (measured by real-time PCR) upon transfection of miR-30c or the anti-miR-30c inhibitors into MDA-MB-231 cells. T test p values are shown (n=3). Error bars: SD. c. Immunoblots of TWF1 (green band, top panel), VIM (green band, middle panel), SNAI2 (green band, bottom panel) and beta-actin (red band, top panel) with protein lysates of MDA-MB-231 cells 36hrs after transfections of Mock control, scrambled (Scr), and oligo miRNA-30c respectively. d. Effects of miR-30c on cell morphology and F-actin. Top panels: images of MDA-MB-231 cells after miR-30c transfections. Top left panels: bright field (BF) images of cells (200x, black scale bars=10µm). Top right panels: fluorescent images (1000x, white scale bars=5µm) with F-actin staining (green) and DAPI staining of DNA (blue). Bottom histogram: percentage of round cells counted in two groups, scrambled and 30c–transfected cells (n=4, counting 4 replicates of 100–150 cells). Cells were harvested 36hrs after transfections of scramble control (top) or miR-30c oligos (bottom). T test p=0.043. Error bars: SD. e. Luciferase activity assays of Hek293T cells co-transfected with miR-30c (or scrambled control, scr) and the luciferase vector containing wildtype (WT) or mutated (mt) 3’UTR of TWF1. Mt1, 2, 3 are mutants with G/C converted to T in individual predicted binding site 1, 2, or 3, and mt123 contains all three mutated sites (see Supplementary Fig. S3). T test p=0.0001 for WT or mt2, comparing 30c to scr control (n=5). Error bars: SD.
Figure 4
Figure 4. TWF1 is required for miR-30c functions
a. Overexpression of TWF1 reversed the chemo-response sensitized by miR-30c in MDA-MB-231 cells upon doxorubicin (Doxo) or paclitaxel (Taxol) treatments. T test p=0.01 (Doxo) and 0.02 (Taxol), when comparing 30c/Vec to 30c/TWF1 (n=5). Error bars: SD. b. Knockdown of TWF1 by a transient transfection of siRNAs of TWF1 (siTWF1) mimicked the miR-30 overexpression to enhance the cytotoxicity of doxorubicin (Doxo) and paclitaxel (Taxol) in MDA-MB-231 cells. **p=0.0049, ****p=4.77E-05 (n=5) by a T test. Error bars: SD. c. Relative expression levels of TWF1 upon siRNA transfections, measured by real-time PCR (BD Taqman assays). T test p= 7.31E-05 (n=3). Error bars: SD. d. Images of F-actin staining of MDA-MB-231 cells inhibited by siTWF1 knockdowns, compared to scrambled cont-rol (Scr) (1000x, green for F-actin staining and blue for DAPI staining), white scale bars=5µm. Cells were harvested 36hrs after transfections.
Figure 5
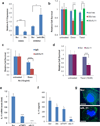
Figure 5. IL-11 as a downstream target of TWF1
a. Relative IL-11 expression levels measured by real-time PCR analyses. The miR-30c oligos (mimic) downregulated IL-11 expression whereas the anti-miR-30c inhibitor upregulated IL-11 expression in MDA-MB-231 cells after 36hrs of transfections, compared to the scrambled control (Scr). *p=0.03299, ***p=0.00052 (n=3) by a T test. Error bars: SD. b. Overexpression of IL-11 reversed miR-30c–mediated sensitivity of MDA-MD-231 cells to doxorubicin (Doxo) and paclitaxel (Taxol) (n=6). T test p=2.8E-05 (Doxo) and 1.1E-04 (Taxol), when comparing 30c/vector to 30c/IL-11. Error bars: SD. c. Survival of MDA-MB-231 cells incubated with the goat IgG control or a neutralizing antibody to human IL-11 (12 µg/ml), upon 72-hr exposure to 100nM doxorubicin (Doxo). *****p=4.24E-06 by a T test (n=6). Error bars: SD. d. Knockdown of IL-11 by siRNAs sensitized cytotoxicity of MDA-MB-231 cells to 72-hour treatment of paclitaxel (Taxol, 10nM). ****p=3.0E-05 by T test (n=6). Error bars: SD. e. Reduction of IL-11 mRNA expression upon gene knockdowns of siTWF1 and siIL-11, compared to the scrambled control (Scr) (n=3), measured by real-time PCR. ***p=0.0009 (siTWF1) and 0.0003 (siIL-11) by a T test. Error bars: SD. f. IL-11 levels detected in the cultured media of MDA-231 cells, upon transfections with scrambled, miR-30c, and siRNAs for TWF1 or IL-11 (n=4). T test p=0.0381 (30c), 0.0329 (siTWF1), 0.0007 (siIL11) compared to the scrambled control (Scr). Error bars: SD. g. Images of F-actin staining of MDA-MB-231 cells, transfected with siRNAs of IL-11 and scrambled control (Scr) (1000x, green for F-actin staining and blue for DAPI staining), white scale bars=5µm. Cells were harvested 36hrs after transfections.
Figure 6
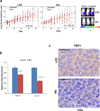
Figure 6. miR-30c regulates chemo-resistance of breast tumour in vivo
a. Doxorubicin treatment response (log-transformed bioluminescence signals) of implanted CD44+ human breast tumour cells expressing L2G vector control (left panel, n=40) and miR-30c (middle panel, n=40). The right panel pictures are representative bioluminescence images of treated mice: L2G control (top) and 30c–overexpressed (bottom). Doxorubicin (or PBS vehicle control for untreated) was given intraperitoneally at 1mg/kg to treated mice on day 20 and day 39. In the vector control mice (top panel), doxorubicin (red) did not significantly inhibit tumour growth (slope change after treatment p>0.05, R statistical package analysis) compared to the untreated group (black). In the miR-30c precursor overexpression group (bottom panel), doxorubicin (red) inhibited tumour growth (slope change p values shown, R model analysis). b. TWF1 and IL-11 mRNA levels inhibited by pFU-PGK-L2G mediated miR-30c precursor expression in xenograft breast tumour cells (sorted from human-in-mouse tumors in vivo), measured by real-time PCR. T test p=0.0001 (TWF1) and 1.04E-07 (IL-11) (n=3). Error bars: SD. c. Reduced immunohistochemistry staining against human TWF1 in one of three representative 30c–overexpressing primary breast tumour sections, compared to L2G–vector-transduced tumour sections (100x). Scale bars=20µm in both images.
Figure 7
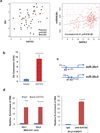
Figure 7. GATA3 regulation of miR-30c
a. Scatter plots of GATA3 expression and miR-30c levels in UC set breast tumors (n=44, p=0.023, R=0.341) (left panel) and Oxford breast tumour sets (GSE22220 and GSE22216) (n=210, p=0.0005, Pearson correlation=0.31) (right panel). Linear regression analyses were performed between miRNA expression and GATA3 levels after log 2 transformation. Plots were drawn using the scatterplot function found in the Car package (http://cran.r-project.org). b. Induced expression of miR-30c (T test p=1.95E-08, n=5) by ectopic GATA3 in MDA-MB-231 breast cancer cells, measured by real-time PCR, compare to the vector control. Error bars: SD. c. −3kb promoter regions of hsa-miR-30c1 and 30c2 with predicted GATA3 binding elements (E0 for 30c1, E1 and E2 for 30c2). PCR primers were designed to amplify the regions flanking E0 (P1) or both E1 and E2 (P2). d. Left panel: the miR-30c promoter regions of 30c1 and 30c2 enriched by GATA3 antibody-mediated chromatin-immunoprecipitation (ChIP) with GATA3-overexpressing MDA-MB-231 lysates, detected by real-time PCR using primers P1 and P2 respectively. Right panel: the miR-30c2 promoter enriched by GATA3 antibody-mediated ChIP with MCF-7, detected by real-time PCR with P2 primers. T test p= 0.0004 (30c1) and 3.59E-06 (30c2) for MDA-MB-231 cells, and 5.23E-06 (30c2) for MCF-7 cells respectively (n=6). Error bars: SD.
Figure 8
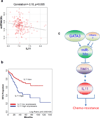
Figure 8. Clinical relevance of the miR-30c signalling pathway
a. Scatter plots between IL-11 single gene expression and the expression of miR-30c in breast cancer dataset with combined expression profiles of mRNA GSE22220 and miRNA GSE22216 (n=210). Pearson correlation was estimated (p=0.005). b. Survival outcomes of IL-11 gene expression in primary breast cancers in the UNC337 publicly available microarray data set . Relapse-free survival KM plots were based on IL-11 gene expression and median gene expression was used to define low and high expressers (p=0.000109, n=337). c. Signalling pathway scheme GATA3-miR30-TWF1-IL-11 regulation of breast cancer chemo-resistance.

Similar articles

Cited by

References

    1. Lu J, et al. MicroRNA expression profiles classify human cancers. Nature. 2005;435:834–838. - PubMed
    1. Creighton CJ, et al. Residual breast cancers after conventional therapy display mesenchymal as well as tumor-initiating features. Proceedings of the National Academy of Sciences of the United States of America. 2009;106:13820–13825. - PMC - PubMed
    1. Singh A, Settleman J. EMT, cancer stem cells and drug resistance: an emerging axis of evil in the war on cancer. Oncogene. 2010;29:4741–4751. - PMC - PubMed
    1. Bartel DP. MicroRNAs: genomics, biogenesis, mechanism, and function. Cell. 2004;116:281–297. - PubMed
    1. Fabian MR, Sonenberg N, Filipowicz W. Regulation of mRNA translation and stability by microRNAs. Annu Rev Biochem. 2010;79:351–379. - PubMed

Publication types

MeSH terms