

Pediatric readmission prevalence and variability across hospitals
- PMID: 23340639
- PMCID: PMC3640861
- DOI: 10.1001/jama.2012.188351
Pediatric readmission prevalence and variability across hospitals
Erratum in
- JAMA. 2013 Mar 13;309(10):986. Chiang, Vincent K [corrected to Chiang, Vincent W]
Abstract
Importance: Readmission rates are used as an indicator of the quality of care that patients receive during a hospital admission and after discharge.
Objective: To determine the prevalence of pediatric readmissions and the magnitude of variation in pediatric readmission rates across hospitals.
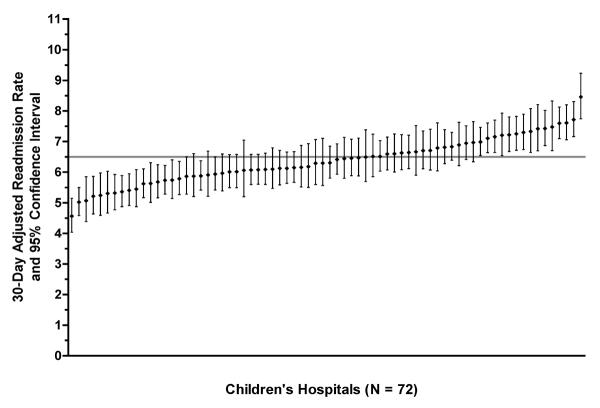
Design, setting, and patients: We analyzed 568,845 admissions at 72 children's hospitals between July 1, 2009, and June 30, 2010, in the National Association of Children's Hospitals and Related Institutions Case Mix Comparative data set. We estimated hierarchical regression models for 30-day readmission rates by hospital, accounting for age and Chronic Condition Indicators. Hospitals with adjusted readmission rates that were 1 SD above and below the mean were defined as having "high" and "low" rates, respectively.
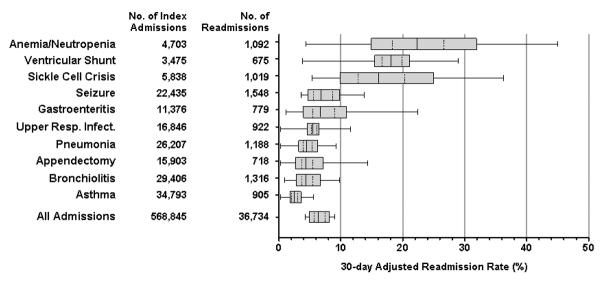
Main outcome measures: Thirty-day unplanned readmissions following admission for any diagnosis and for the 10 admission diagnoses with the highest readmission prevalence. Planned readmissions were identified with procedure codes from the International Classification of Diseases, Ninth Revision, Clinical Modification.
Results: The 30-day unadjusted readmission rate for all hospitalized children was 6.5% (n = 36,734). Adjusted rates were 28.6% greater in hospitals with high vs low readmission rates (7.2% [95% CI, 7.1%-7.2%] vs 5.6% [95% CI, 5.6%-5.6%]). For the 10 admission diagnoses with the highest readmission prevalence, the adjusted rates were 17.0% to 66.0% greater in hospitals with high vs low readmission rates. For example, sickle cell rates were 20.1% (95% CI, 20.0%-20.3%) vs 12.7% (95% CI, 12.6%-12.8%) in high vs low hospitals, respectively.
Conclusions and relevance: Among patients admitted to acute care pediatric hospitals, the rate of unplanned readmissions at 30 days was 6.5%. There was significant variability in readmission rates across conditions and hospitals. These data may be useful for hospitals' quality improvement efforts.
Figures
Comment in
-
Pediatric readmissions as a hospital quality measure.JAMA. 2013 Jan 23;309(4):396-8. doi: 10.1001/jama.2012.217006. JAMA. 2013. PMID: 23340643 No abstract available.
-
Significant variability in 30-day unplanned readmission rates among children's hospitals.J Pediatr. 2013 Jul;163(1):305-6. doi: 10.1016/j.jpeds.2013.04.063. J Pediatr. 2013. PMID: 23796346 No abstract available.
References
-
- Carrns A. Farewell, and don't come back. Health reform gives hospitals a big incentive to send patients home for good. US News World Rep. 2010 Aug;147(7):20, 22–23. - PubMed
-
- Axon RN, Williams MV. Hospital readmission as an accountability measure. JAMA. 2011 Feb 2;305(5):504–505. - PubMed
-
- Coye MJ. CMS' stealth health reform. Plan to reduce readmissions and boost the continuum of care. Hospitals & health networks / AHA. 2008 Nov;82(11):24. - PubMed
-
- Jencks SF, Williams MV, Coleman EA. Rehospitalizations among patients in the Medicare fee-for-service program. N Engl J Med. 2009 Apr 2;360(14):1418–1428. - PubMed
Publication types
MeSH terms
Grants and funding
LinkOut - more resources
Full Text Sources
Other Literature Sources
