

Metabolic profiles of brain metastases
- PMID: 23340650
- PMCID: PMC3565368
- DOI: 10.3390/ijms14012104
Metabolic profiles of brain metastases
Abstract
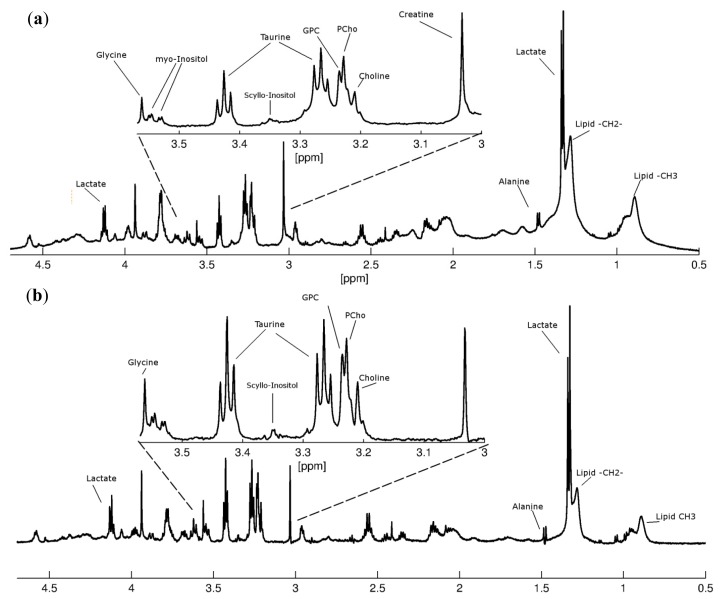
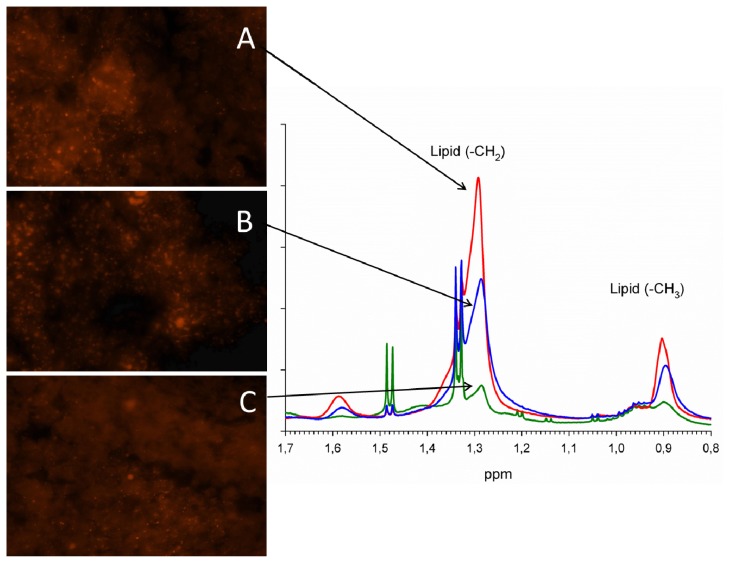
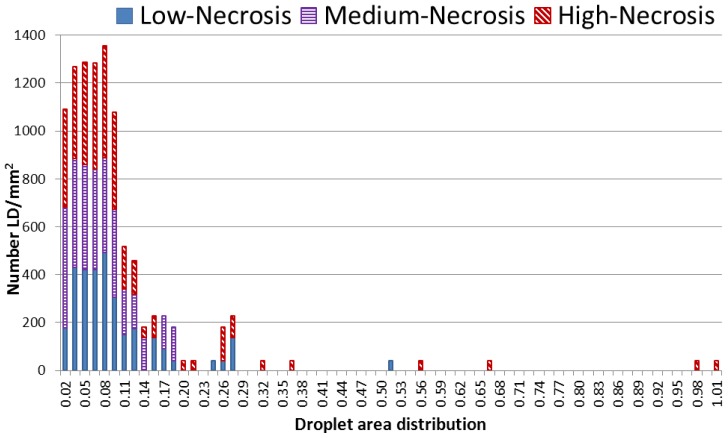
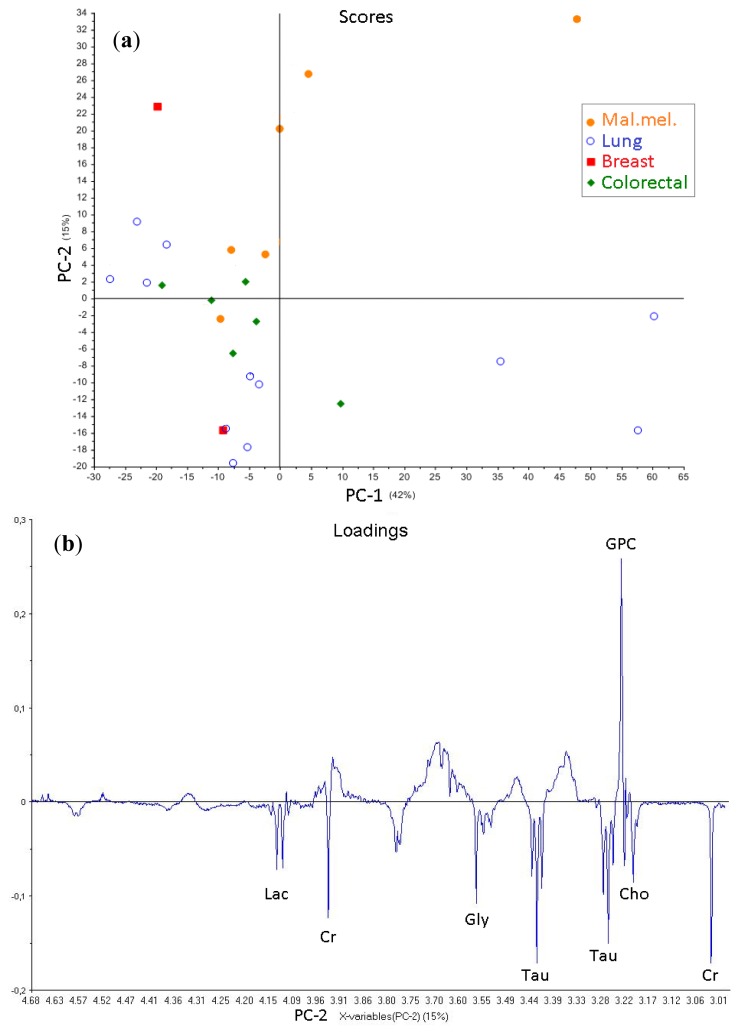
Metastasis to the brain is a feared complication of systemic cancer, associated with significant morbidity and poor prognosis. A better understanding of the tumor metabolism might help us meet the challenges in controlling brain metastases. The study aims to characterize the metabolic profile of brain metastases of different origin using high resolution magic angle spinning (HR-MAS) magnetic resonance spectroscopy (MRS) to correlate the metabolic profiles to clinical and pathological information. Biopsy samples of human brain metastases (n = 49) were investigated. A significant correlation between lipid signals and necrosis in brain metastases was observed (p < 0.01), irrespective of their primary origin. The principal component analysis (PCA) showed that brain metastases from malignant melanomas cluster together, while lung carcinomas were metabolically heterogeneous and overlap with other subtypes. Metastatic melanomas have higher amounts of glycerophosphocholine than other brain metastases. A significant correlation between microscopically visible lipid droplets estimated by Nile Red staining and MR visible lipid signals was observed in metastatic lung carcinomas (p = 0.01), indicating that the proton MR visible lipid signals arise from cytoplasmic lipid droplets. MRS-based metabolomic profiling is a useful tool for exploring the metabolic profiles of metastatic brain tumors.
Figures

Similar articles
-
An investigation of human brain tumour lipids by high-resolution magic angle spinning 1H MRS and histological analysis.NMR Biomed. 2008 Aug;21(7):677-85. doi: 10.1002/nbm.1239. NMR Biomed. 2008. PMID: 18186027
-
Metabolic profiling of human brain metastases using in vivo proton MR spectroscopy at 3T.BMC Cancer. 2007 Jul 27;7:141. doi: 10.1186/1471-2407-7-141. BMC Cancer. 2007. PMID: 17662122 Free PMC article.
-
Characterization of brain metastases using high-resolution magic angle spinning MRS.NMR Biomed. 2008 Feb;21(2):175-85. doi: 10.1002/nbm.1180. NMR Biomed. 2008. PMID: 17542042
-
MRS as endogenous molecular imaging for brain and prostate tumors: FP6 project "eTUMOR".Adv Exp Med Biol. 2006;587:285-302. doi: 10.1007/978-1-4020-5133-3_22. Adv Exp Med Biol. 2006. PMID: 17163172 Review.
-
Positron emission tomography imaging of brain tumors.Neuroimaging Clin N Am. 2002 Nov;12(4):615-26. doi: 10.1016/s1052-5149(02)00033-3. Neuroimaging Clin N Am. 2002. PMID: 12687915 Review.
Cited by
-
Transient Hepatic Overexpression of Insulin-Like Growth Factor 2 Induces Free Cholesterol and Lipid Droplet Formation.Front Physiol. 2016 Apr 25;7:147. doi: 10.3389/fphys.2016.00147. eCollection 2016. Front Physiol. 2016. PMID: 27199763 Free PMC article.
-
Focus on the glycerophosphocholine pathway in choline phospholipid metabolism of cancer.NMR Biomed. 2019 Oct;32(10):e4112. doi: 10.1002/nbm.4112. Epub 2019 Jun 11. NMR Biomed. 2019. PMID: 31184789 Free PMC article. Review.
-
Growth Dynamics of Brain Tumor Through the Lens of MT-Weighted MRI.Methods Mol Biol. 2025;2944:301-308. doi: 10.1007/978-1-0716-4654-0_23. Methods Mol Biol. 2025. PMID: 40553292
-
Assessing Heterogeneity of Osteolytic Lesions in Multiple Myeloma by ¹H HR-MAS NMR Metabolomics.Int J Mol Sci. 2016 Oct 31;17(11):1814. doi: 10.3390/ijms17111814. Int J Mol Sci. 2016. PMID: 27809247 Free PMC article.
-
Characterization of metabolites in infiltrating gliomas using ex vivo ¹H high-resolution magic angle spinning spectroscopy.NMR Biomed. 2014 May;27(5):578-93. doi: 10.1002/nbm.3097. Epub 2014 Mar 5. NMR Biomed. 2014. PMID: 24596146 Free PMC article.
References
-
- Barnholtz-Sloan J.S., Sloan A.E., Davis F.G., Vigneau F.D., Lai P., Sawaya R.E. Incidence proportions of brain metastases in patients diagnosed (1973 to 2001) in the Metropolitan Detroit Cancer Surveillance System. J. Clin. Oncol. 2004;22:2865–2872. - PubMed
-
- Gavrilovic I.T., Posner J.B. Brain metastases: Epidemiology and pathophysiology. J. Neurooncol. 2005;75:5–14. - PubMed
-
- Gaspar L.E., Mehta M.P., Patchell R.A., Burri S.H., Robinson P.D., Morris R.E., Ammirati M., Andrews D.W., Asher A.L., Cobbs C.S., et al. The role of whole brain radiation therapy in the management of newly diagnosed brain metastases: A systematic review and evidence-based clinical practice guideline. J. Neurooncol. 2010;96:17–32. - PMC - PubMed
-
- Kalkanis S.N., Kondziolka D., Gaspar L.E., Burri S.H., Asher A.L., Cobbs C.S., Ammirati M., Robinson P.D., Andrews D.W., Loeffler J.S., et al. The role of surgical resection in the management of newly diagnosed brain metastases: A systematic review and evidence-based clinical practice guideline. J. Neurooncol. 2010;96:33–43. - PMC - PubMed
-
- Sperduto C.M., Watanabe Y., Mullan J., Hood T., Dyste G., Watts C., Bender G.P., Sperduto P. A validation study of a new prognostic index for patients with brain metastases: the Graded Prognostic Assessment. J. Neurosurg. 2008;109:87–89. - PubMed
Publication types
MeSH terms
LinkOut - more resources
Full Text Sources
Other Literature Sources
Medical
