

C/EBPα and MYB regulate FLT3 expression in AML
- PMID: 23340802
- PMCID: PMC4214120
- DOI: 10.1038/leu.2013.23
C/EBPα and MYB regulate FLT3 expression in AML
Abstract
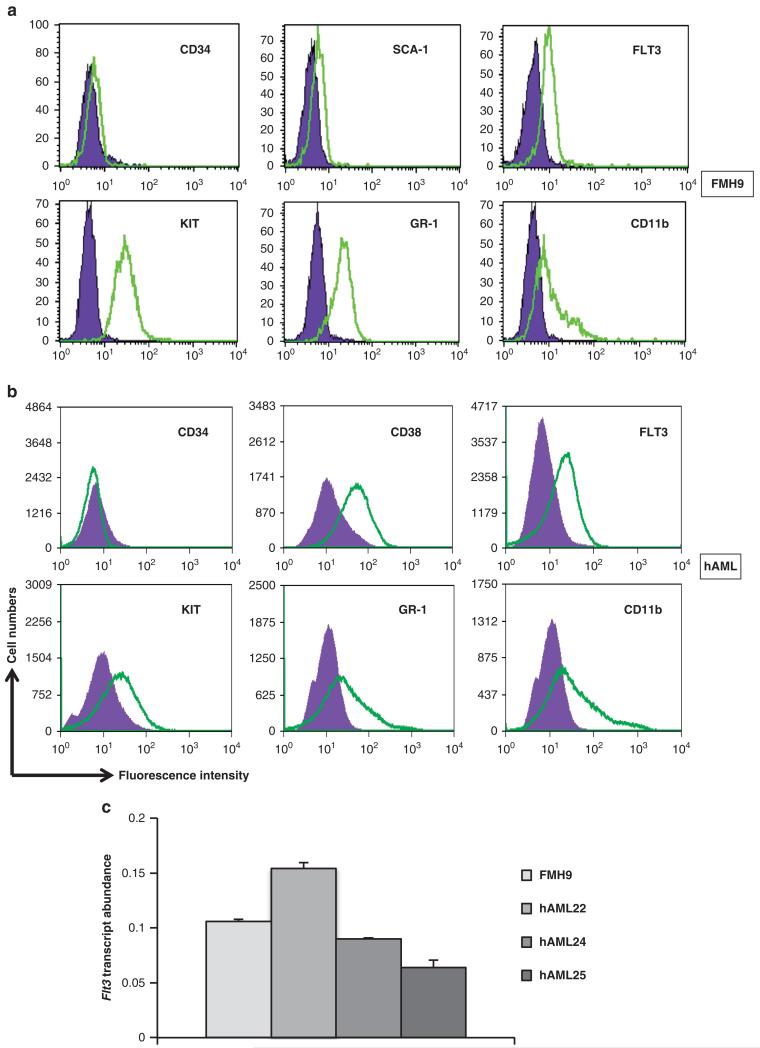
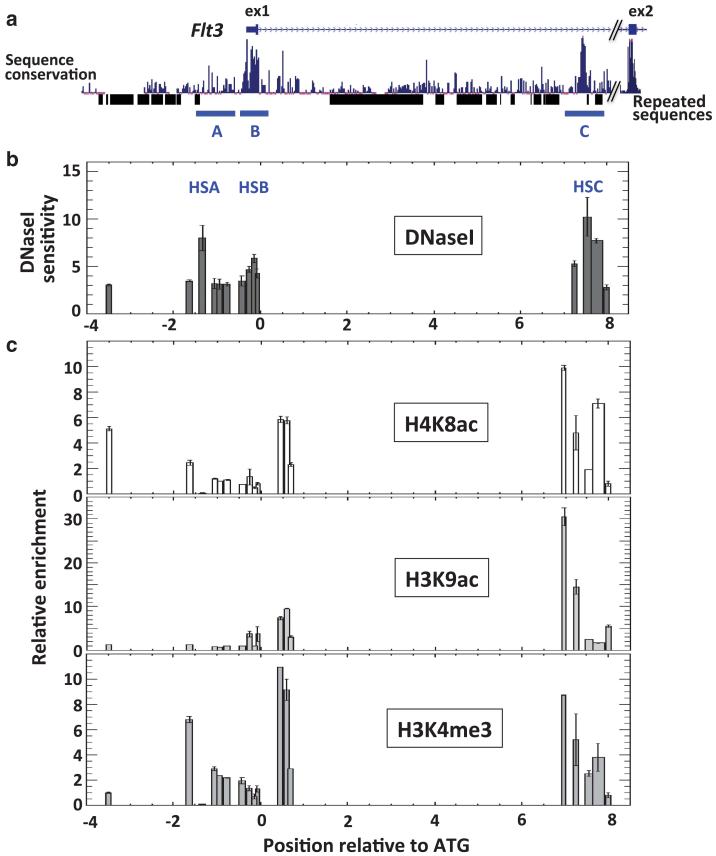
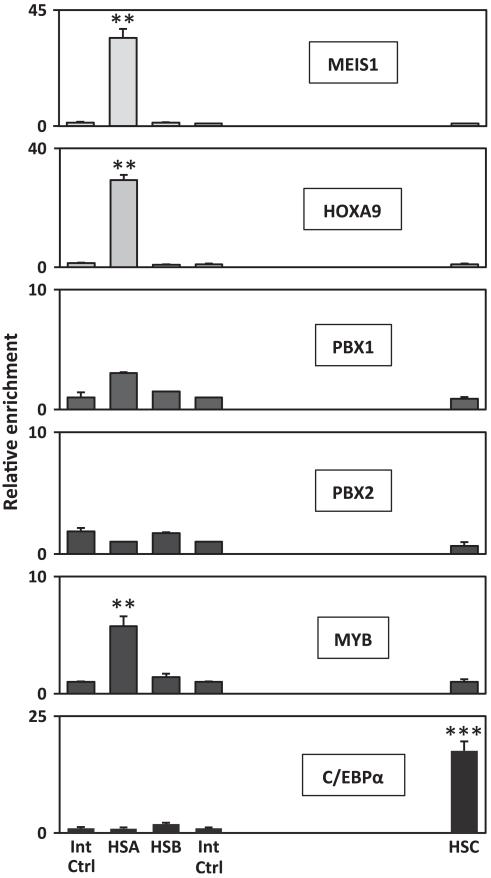
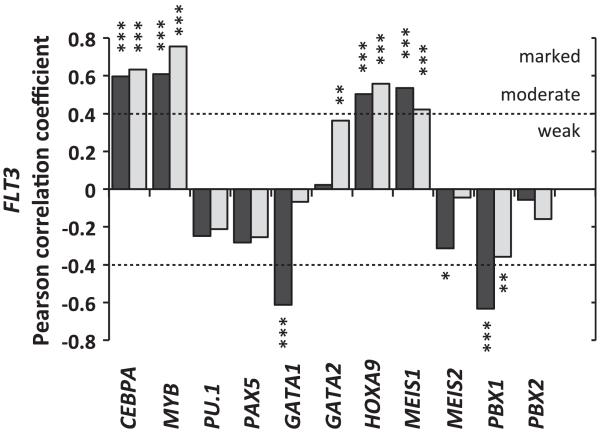
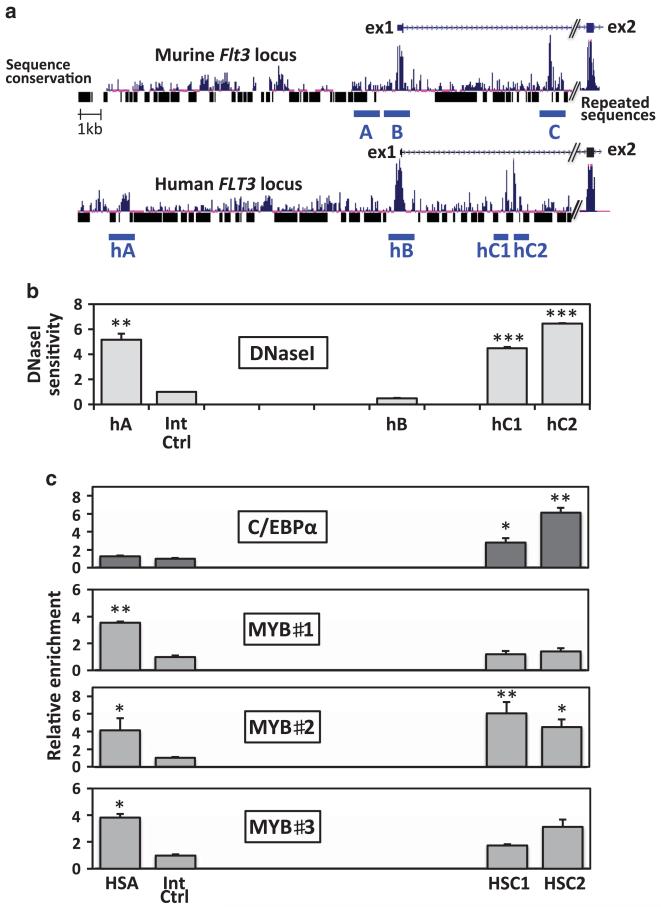
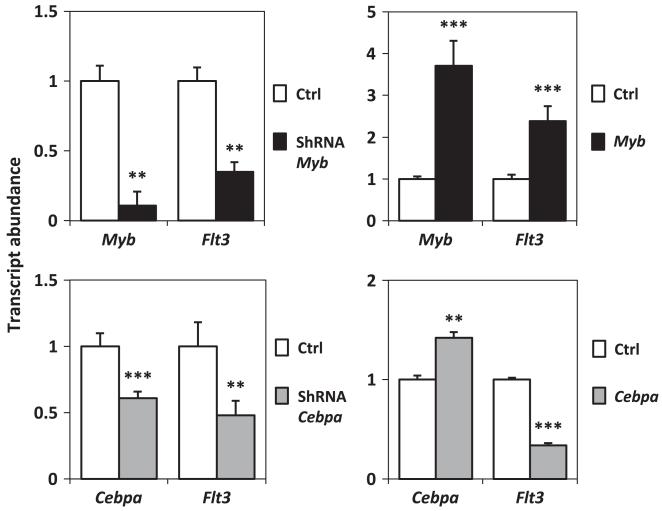
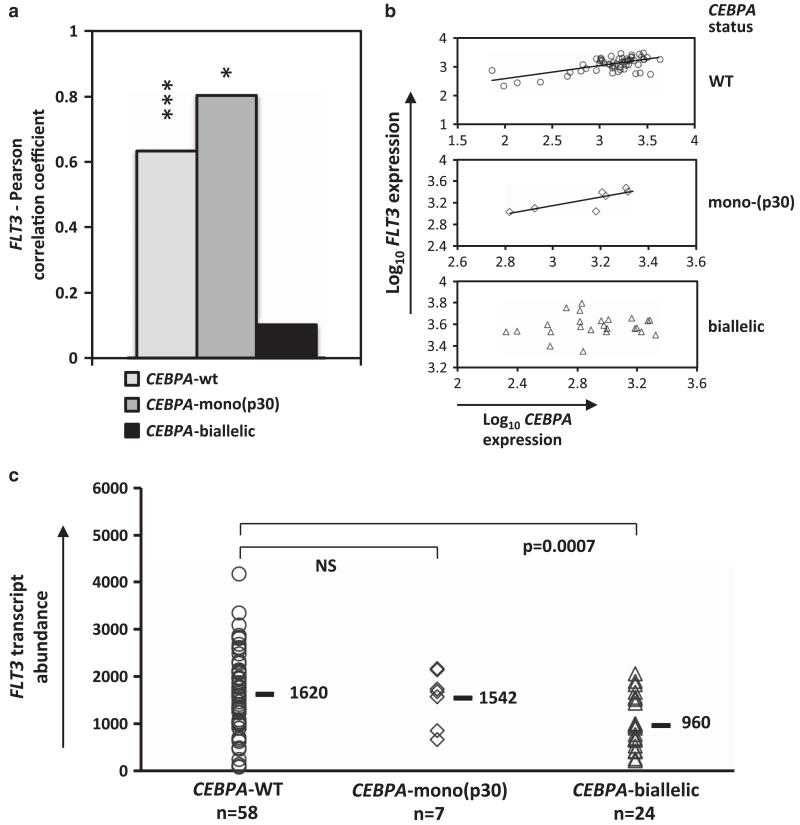
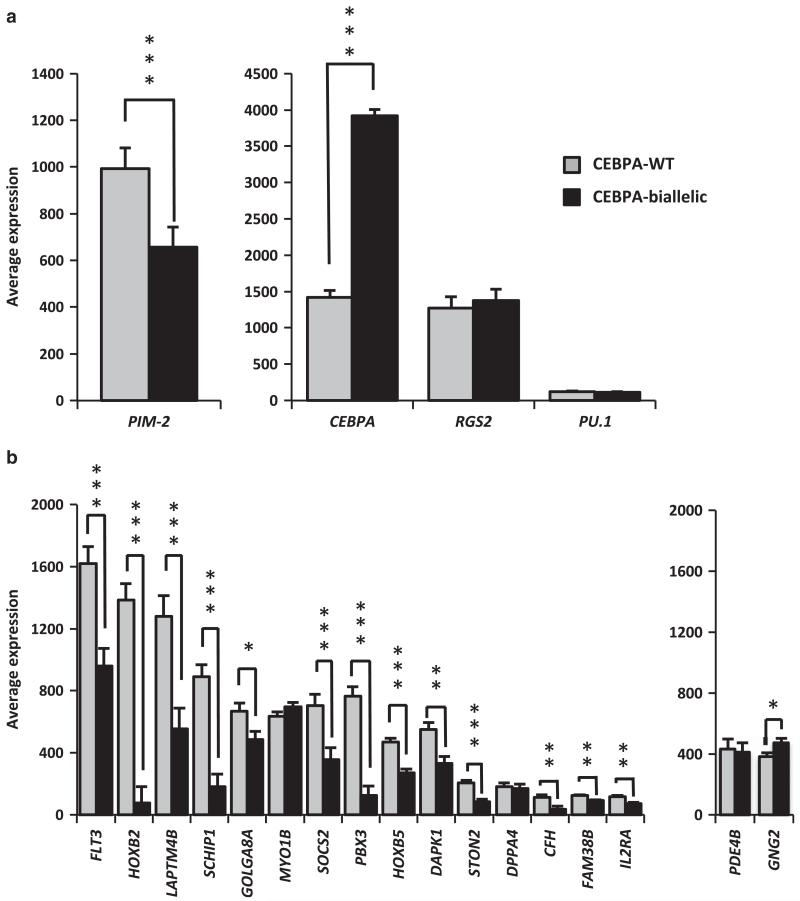
The interaction between the receptor FLT3 (FMS-like tyrosine kinase-3) and its ligand FL leads to crucial signalling during the early stages of the commitment of haematopoietic stem cells. Mutation or over-expression of the FLT3 gene, leading to constitutive signalling, enhances the survival and expansion of a variety of leukaemias and is associated with an unfavourable clinical outcome for acute myeloid leukaemia (AML) patients. In this study, we used a murine cellular model for AML and primary leukaemic cells from AML patients to investigate the molecular mechanisms underlying the regulation of FLT3 gene expression and identify its key cis- and trans-regulators. By assessing DNA accessibility and epigenetic markings, we defined regulatory domains in the FLT3 promoter and first intron. These elements permit in vivo binding of several AML-related transcription factors, including the proto-oncogene MYB and the CCAAT/enhancer binding protein C/EBPα, which are recruited to the FLT3 promoter and intronic module, respectively. Substantiating their relevance to the human disease, our analysis of gene expression profiling arrays from AML patients uncovered significant correlations between FLT3 expression level and that of MYB and CEBPA. The latter relationship permits discrimination between patients with CEBPA mono- and bi-allelic mutations, and thus connects two major prognostic factors for AML.
Figures
Similar articles
-
Upregulation of Flt3 is a passive event in Hoxa9/Meis1-induced acute myeloid leukemia in mice.Oncogene. 2017 Mar;36(11):1516-1524. doi: 10.1038/onc.2016.318. Epub 2016 Sep 12. Oncogene. 2017. PMID: 27617578
-
[THE CLINICAL SIGNIFICANCE OF GENETIC MUTATIONS IN ACUTE MYELOID LEUKEMIA].Lik Sprava. 2014 Dec;(12):10-8. Lik Sprava. 2014. PMID: 26638462 Review. Ukrainian.
-
Hes1 suppresses acute myeloid leukemia development through FLT3 repression.Leukemia. 2015 Mar;29(3):576-85. doi: 10.1038/leu.2014.281. Epub 2014 Sep 19. Leukemia. 2015. PMID: 25234168
-
MicroRNA-155 as an inducer of apoptosis and cell differentiation in Acute Myeloid Leukaemia.Mol Cancer. 2014 Apr 5;13:79. doi: 10.1186/1476-4598-13-79. Mol Cancer. 2014. PMID: 24708856 Free PMC article.
-
Perspectives for therapeutic targeting of gene mutations in acute myeloid leukaemia with normal cytogenetics.Br J Haematol. 2015 Aug;170(3):305-22. doi: 10.1111/bjh.13409. Epub 2015 Apr 19. Br J Haematol. 2015. PMID: 25891481 Review.
Cited by
-
13q12.2 deletions and FLT3 overexpression in acute leukemias.Blood Adv. 2021 Apr 27;5(8):2075-2078. doi: 10.1182/bloodadvances.2020003643. Blood Adv. 2021. PMID: 33877294 Free PMC article. No abstract available.
-
Dependence on Myb expression is attenuated in myeloid leukaemia with N-terminal CEBPA mutations.Life Sci Alliance. 2019 Mar 15;2(2):e201800207. doi: 10.26508/lsa.201800207. Print 2019 Apr. Life Sci Alliance. 2019. PMID: 30877232 Free PMC article.
-
MiR-15a-5p, c-MYB, and circHIPK3 Axis as a Potential Diagnostic and Clinicopathological-Related Network in Acute Myeloid Leukemia.Adv Biomed Res. 2025 Jul 31;14:73. doi: 10.4103/abr.abr_252_24. eCollection 2025. Adv Biomed Res. 2025. PMID: 40862172 Free PMC article.
-
MicroRNA-424 is down-regulated in hepatocellular carcinoma and suppresses cell migration and invasion through c-Myb.PLoS One. 2014 Mar 27;9(3):e91661. doi: 10.1371/journal.pone.0091661. eCollection 2014. PLoS One. 2014. Retraction in: PLoS One. 2022 Aug 31;17(8):e0274145. doi: 10.1371/journal.pone.0274145. PMID: 24675898 Free PMC article. Retracted.
-
Oroxylin A, a natural anticancer flavonoid compound, induces differentiation of t(8;21)-positive Kasumi-1 and primary acute myeloid leukemia cells.J Cancer Res Clin Oncol. 2016 Jul;142(7):1449-59. doi: 10.1007/s00432-016-2160-1. Epub 2016 Apr 16. J Cancer Res Clin Oncol. 2016. PMID: 27085528 Free PMC article.
References
-
- Drexler HG. Expression of FLT3 receptor and response to FLT3 ligand by leukemic cells. Leukemia. 1996;10:588–599. - PubMed
-
- Rosnet O, Buhring HJ, deLapeyriere O, Beslu N, Lavagna C, Marchetto S, et al. Expression and signal transduction of the FLT3 tyrosine kinase receptor. Acta Haematol. 1996;95:218–223. - PubMed
-
- Kindler T, Lipka DB, Fischer T. FLT3 as a therapeutic target in AML: still challenging after all these years. Blood. 2010;116:5089–5102. - PubMed
-
- Kelly LM, Liu Q, Kutok JL, Williams IR, Boulton CL, Gilliland DG. FLT3 internal tandem duplication mutations associated with human acute myeloid leukemias induce myeloproliferative disease in a murine bone marrow transplant model. Blood. 2002;99:310–318. - PubMed
Publication types
MeSH terms
Substances
Grants and funding
LinkOut - more resources
Full Text Sources
Other Literature Sources
Medical
Miscellaneous
