. 2013:9:633.
doi: 10.1038/msb.2012.67.

Widespread splicing changes in human brain development and aging

Affiliations

Widespread splicing changes in human brain development and aging

Pavel Mazin et al. Mol Syst Biol. 2013.

Abstract

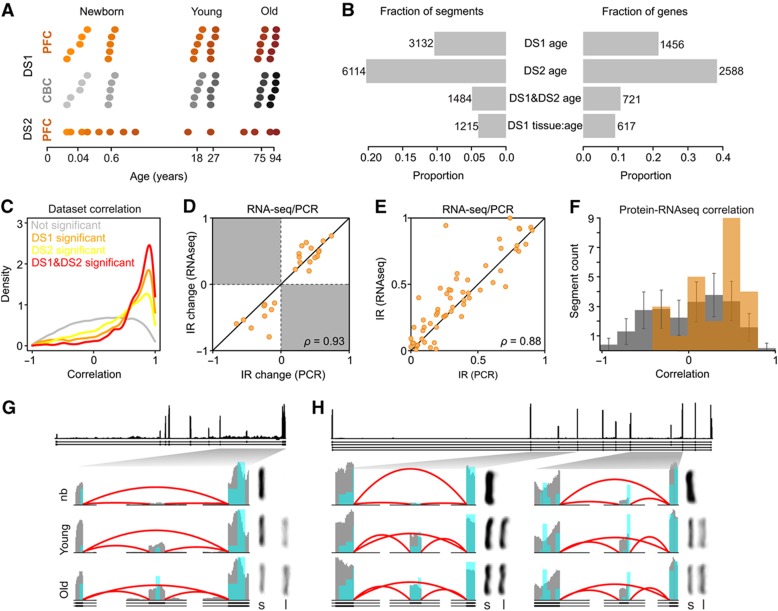
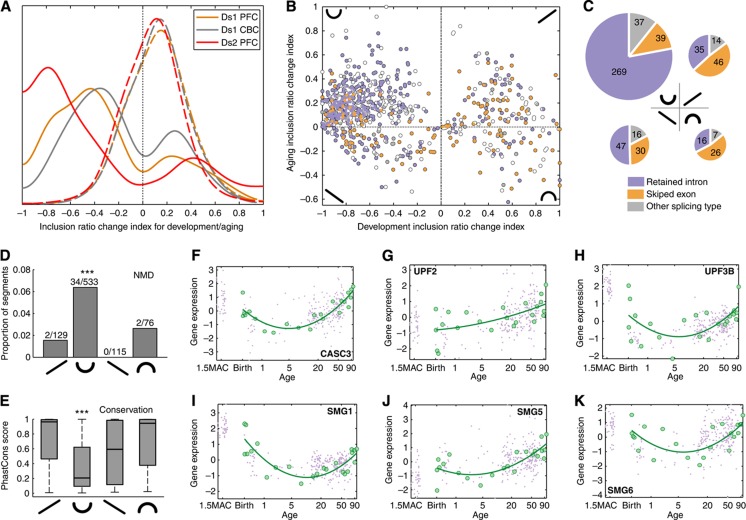
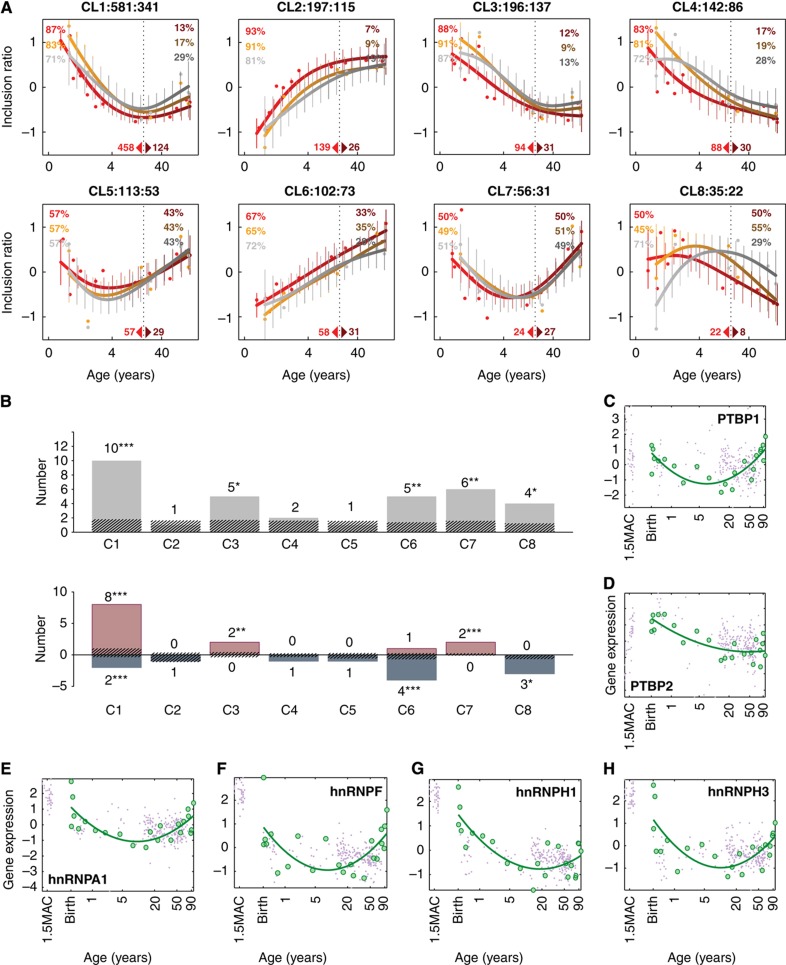
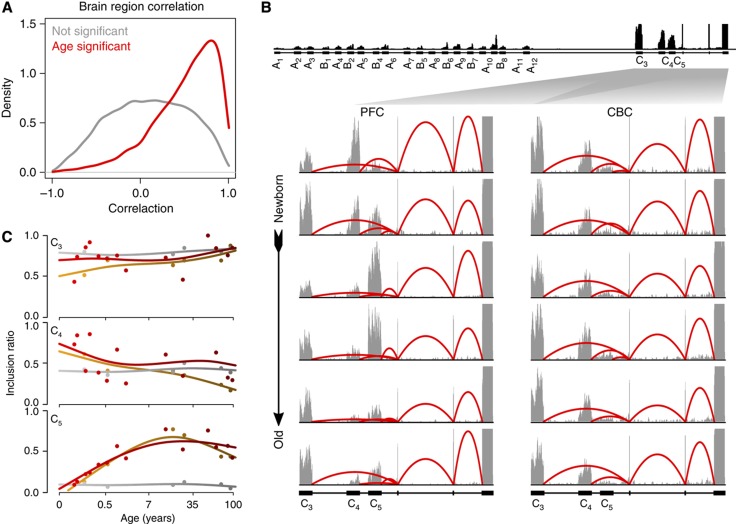
While splicing differences between tissues, sexes and species are well documented, little is known about the extent and the nature of splicing changes that take place during human or mammalian development and aging. Here, using high-throughput transcriptome sequencing, we have characterized splicing changes that take place during whole human lifespan in two brain regions: prefrontal cortex and cerebellum. Identified changes were confirmed using independent human and rhesus macaque RNA-seq data sets, exon arrays and PCR, and were detected at the protein level using mass spectrometry. Splicing changes across lifespan were abundant in both of the brain regions studied, affecting more than a third of the genes expressed in the human brain. Approximately 15% of these changes differed between the two brain regions. Across lifespan, splicing changes followed discrete patterns that could be linked to neural functions, and associated with the expression profiles of the corresponding splicing factors. More than 60% of all splicing changes represented a single splicing pattern reflecting preferential inclusion of gene segments potentially targeting transcripts for nonsense-mediated decay in infants and elderly.


Conflict of interest statement

The authors declare that they have no conflict of interest.

Figures

Figure 1
Figure 1
Age-related splicing changes in the human brain. (A) Sample age distribution in PFC (orange) and CBC (gray). Each dot represents an individual; the darker shades of color represent older age. In DS1, five individuals of similar age were combined in each sample, resulting in six PFC- and six CBC-pooled samples with the average ages marked on the horizontal axis. (B) Fraction of genes (right) and segments (left) showing significant age-related splicing changes in DS1 (DS1 age), DS2 (DS2 age), and in both data sets (DS1 and DS2), as well as genes showing significantly different age-related changes in brain regions in DS1 (DS1 tissue:age). (C) Correlation of age-related splicing changes between DS1 and DS2. Shown are the distributions of the Pearson correlation coefficients for non-age-related segments (gray, N=22 360); segments significant only in DS2 (yellow, N=4630); segments significant only in DS1 (orange, N=1648); and segments significant in both data sets (red, N=1484). In all cases, only segments with sufficient coverage in both data sets were used. (D) Correlation of inclusion ratio changes with age measured by RT–PCR (horizontal axis) and RNA-seq (vertical axis). (E) Correlation of inclusion ratio estimates measured by RT–PCR (horizontal axis) and RNA-seq (vertical axis). (F) Correlation of age-related splicing changes measured at the transcript (RNA-seq) and protein (mass spectrometry) levels. Shown are the distributions of the Pearson correlation coefficients for the actual observations (orange) and 10 000 random permutations (gray). The difference between the means of observed and permutation distributions was significant (q=0.0004). At the individual segment level, 4 of 24 segments showed marginally significant correlations (Pearson correlation test, BH-corrected FDR<0.1). (G and H) Examples of age-related splicing changes in PFC for PALM (G) and MART (H) gene transcripts. Shown are: (top) RNA coverage (by all samples from DS1) and gene annotation (Ensembl, v57); (bottom) RNA (gray) and protein (blue) coverage and annotation of zoomed gene regions in newborns (nb), young and old individuals (an average of two pooled samples with similar age). The height of the red lines represents the RNA coverage of splice junctions. The PCR results showing relative abundance of the short (S) and long (L) isoforms for the depicted junctions are displayed to the right of the corresponding coverage plot.
Figure 2
Figure 2
Splicing changes in development and aging. (A) Distribution of the inclusion ratio change index for development (solid line) and aging (dash line) for 1484 age-related segments. The negative index represents the inclusion ratio decrease with age, positive index, the inclusion ratio increase. The colors represent RNA-seq data sets analyzed: yellow—DS1/PFC, gray—DS1/CBC, and red—DS2/PFC. (B) Scatter plot of the inclusion ratio change showing different splice types: violet—skipped exons, yellow—retained introns, gray and white—complex and mixed splice types respectively. Four quadrants of the plot correspond to four patterns of inclusion ratio change with age: down–up, up–up, up–down and down–down. Inclusion ratio change is plotted for the 853 segments showing significant splicing changes with age in both data sets and showing consistent direction of age-related splicing change between data sets in development, as well as in aging. (C) Schematic representation of segment numbers (represented by the size of the pie diagrams) and splicing type fractions (represented by colors) in the four inclusion ratio change patterns shown in panel B. (D) Fractions of NMD segments in the four inclusion ratio change patterns. Numbers on top of the bars show the number of NMD segments and the total number of segments in each pattern. Asterisks indicate significant enrichment of NMD segments in the ‘down–up’ pattern (one-sided Fisher’s exact test, P=0.0002) (E) Distribution of the phastCons scores of segments in the four inclusion ratio change patterns. Asterisks indicate significantly low conservation of segments in the ‘down–up’ pattern (one-sided Wilcoxon test, P<0.0001). (F–K) Gene expression of NMD-related genes, CASC3, UPF2, UPF3B, SMG1, SMG5, and SMG6 in the human PFC. Gene expression was estimated based on published data from (Liu et al, 2012) (green) and (Colantuoni et al, 2011) (violet). Expression intensities for each gene were normalized to mean=0 and s.d.=1. Age scale is log2-transformed, ages are shown in years, MAC stands for ‘months after conception’.
Figure 3
Figure 3
Patterns and regulation of age-related splicing changes. (A) Age-related splicing patterns in the PFC (orange) and CBC (gray). The horizontal axis shows the samples’ ages in years. The vertical axis shows the inclusion ratio normalized to mean=0 and s.d.=1 for each segment in each brain region. The points represent the mean inclusion ratios of segments within each pattern in each sample. The lines and the error bars show the cubic spline curves of the mean inclusion ratios and the s.d. of the curves, respectively. The colors represent RNA-seq data sets analyzed: yellow—DS1/PFC, gray—DS1/CBC, and red—DS2/PFC. The numbers above the panels show the ID and the numbers of segments and genes in each pattern. The percentages shown within the panels indicate the percentage of splicing variation found in development and in aging. The vertical dotted line indicates separation between developmental and aging intervals. Numbers of segments separately significant in development or in aging are shown at the bottom of the panels. (B) Top: numbers of SFs with significant enrichment of SFBM in a given pattern (Fisher’s exact test, P<0.05) (gray bars). The striped bars represent the median numbers of SFs expected by chance, calculated by randomly assigning the same numbers of age-related segments to each pattern 1000 times. The symbols above each bar indicate the significance levels of the permutation-based FDR (***—FDR<0.05, **—FDR<0.10, *—FDR<0.20). Bottom: numbers of SFs with significant SFBM enrichment and positive (red) or negative (blue) correlation between the SF expression profile and the inclusion ratio profiles of the segments containing these SFBM within a pattern, compared with the segments from other patterns (one-sided Wilcoxon test, P<0.05). The striped bars represent the median numbers of correlated SFs expected by chance, calculated by randomly assigning the same numbers of age-related segments to each pattern 1000 times. (C–H) Gene expression of SFs, PTBP1, PTBP2, hnRNPA1, hnRNPF, hnRNPH1, and hnRNPH3, in the human PFC. Gene expression was estimated based on published data from (Liu et al, 2012) (green) and (Colantuoni et al, 2011) (violet). Expression intensities for each gene were normalized to mean=0 and s.d.=1. Age scale is log2-transformed, ages are shown in years, MAC stands for ‘months after conception’.
Figure 4
Figure 4
Age-related splicing changes in PFC and CBC. (A) Correlation of age-related splicing changes between the PFC and CBC in DS1. Shown are distributions of the Pearson correlation coefficients for 24 458 segments with sufficient coverage in both data sets but not significant in DS1 (gray), and for 3132 segments showing significant age-related splicing changes in DS1 (red). (B) Age-related splicing changes in the protocadherin gamma transcript in the human PFC and CBC. RNA-seq coverage in all 12 DS1 samples is shown. (C) Inclusion ratio profiles of the protocadherin gamma C3-C5 exons. The colors represent the RNA-seq data sets analyzed: yellow—DS1/PFC, gray—DS1/CBC, and red—DS2/PFC. The points represent the inclusion ratios and the lines represent the cubic spline curves fitted with three degrees of freedom.

References

    1. Andres ME, Burger C, Peral-Rubio MJ, Battaglioli E, Anderson ME, Grimes J, Dallman J, Ballas N, Mandel G (1999) CoREST: a functional corepressor required for regulation of neural-specific gene expression. Proc Natl Acad Sci USA 96: 9873–9878 - PMC - PubMed
    1. Ashburner M, Ball CA, Blake JA, Botstein D, Butler H, Cherry JM, Davis AP, Dolinski K, Dwight SS, Eppig JT, Harris MA, Hill DP, Issel-Tarver L, Kasarskis A, Lewis S, Matese JC, Richardson JE, Ringwald M, Rubin GM, Sherlock G (2000) Gene ontology: tool for the unification of biology. The Gene Ontology Consortium. Nat Genet 25: 25–29 - PMC - PubMed
    1. Barash Y, Calarco JA, Gao WJ, Pan Q, Wang XC, Shai O, Blencowe BJ, Frey BJ (2010) Deciphering the splicing code. Nature 465: 53–59 - PubMed
    1. Benjamini Y, Hochberg Y (1995) Controlling the false discovery rate—a practical and powerful approach to multiple testing. J Roy Stat Soc B Met 57: 289–300
    1. Bernstein HG, Smalla KH, Bogerts B, Gordon-Weeks PR, Beesley PW, Gundelfinger ED, Kreutz MR (2007) The immunolocalization of the synaptic glycoprotein neuroplastin differs substantially between the human and the rodent brain. Brain Res 1134: 107–112 - PubMed

Publication types

MeSH terms