

Accurate measurements of dynamics and reproducibility in small genetic networks
- PMID: 23340845
- PMCID: PMC3564256
- DOI: 10.1038/msb.2012.72
Accurate measurements of dynamics and reproducibility in small genetic networks
Abstract
Quantification of gene expression has become a central tool for understanding genetic networks. In many systems, the only viable way to measure protein levels is by immunofluorescence, which is notorious for its limited accuracy. Using the early Drosophila embryo as an example, we show that careful identification and control of experimental error allows for highly accurate gene expression measurements. We generated antibodies in different host species, allowing for simultaneous staining of four Drosophila gap genes in individual embryos. Careful error analysis of hundreds of expression profiles reveals that less than ∼20% of the observed embryo-to-embryo fluctuations stem from experimental error. These measurements make it possible to extract not only very accurate mean gene expression profiles but also their naturally occurring fluctuations of biological origin and corresponding cross-correlations. We use this analysis to extract gap gene profile dynamics with ∼1 min accuracy. The combination of these new measurements and analysis techniques reveals a twofold increase in profile reproducibility owing to a collective network dynamics that relays positional accuracy from the maternal gradients to the pair-rule genes.
Conflict of interest statement
The authors declare that they have no conflict of interest.
Figures
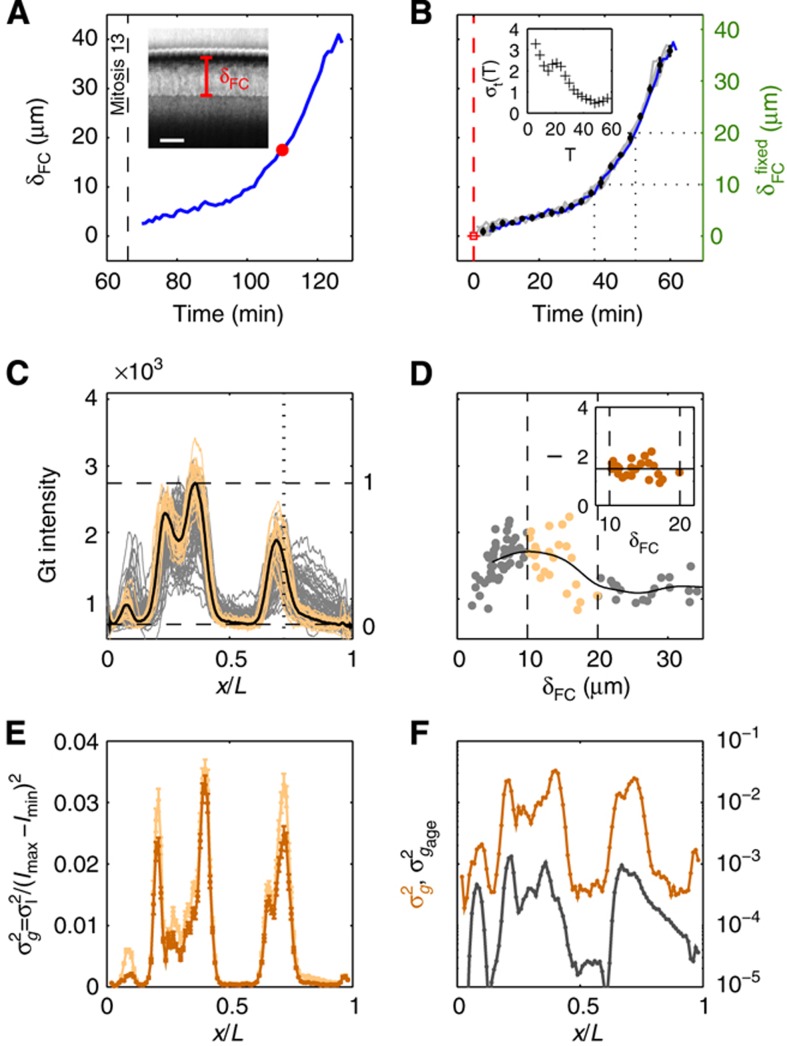
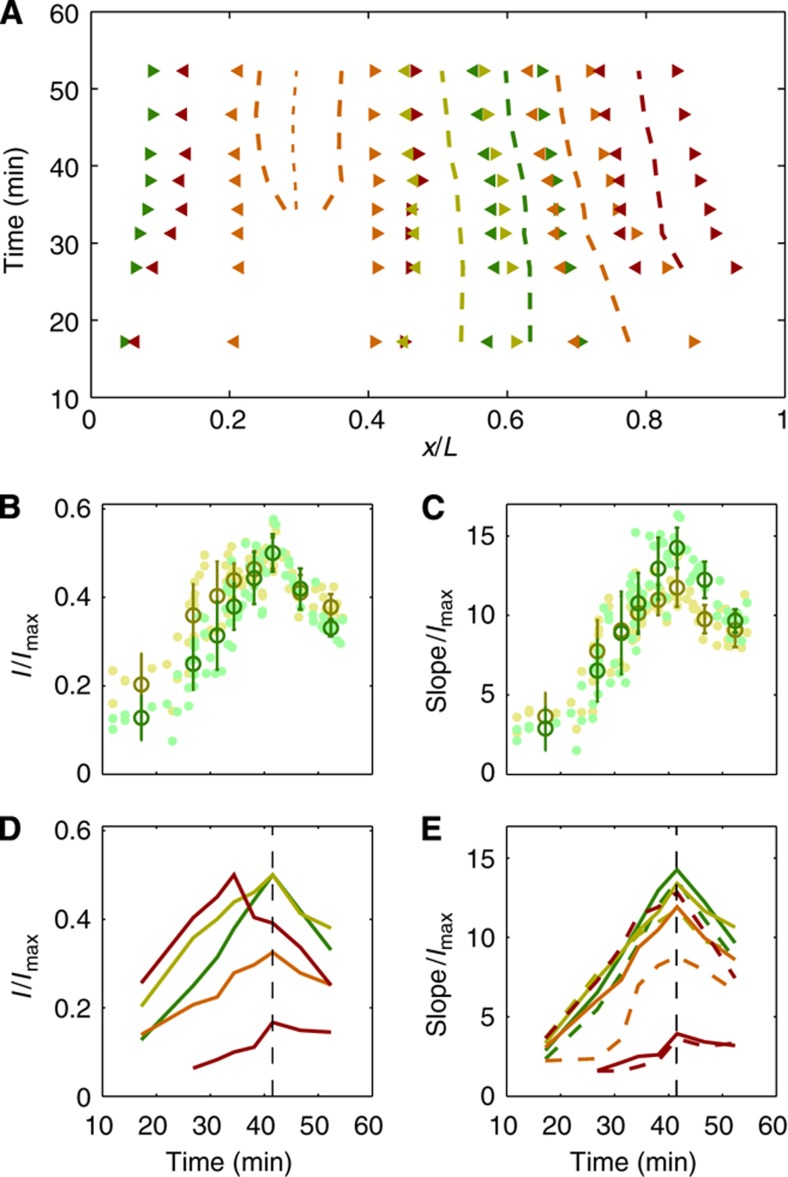
 as a function of time. (C) Raw dorsal Gt intensity profiles of 80 embryos imaged in their midsagittal plane (DV orientation) with T=0–60 min (gray) and a subset of 23 embryos with T=37–49 min (light orange). The mean intensity profile of the 23 embryos is shown in black and its minimum and maximum in the 10–90% EL region are shown as dashed lines (defining the minimum (0) and maximum (1) gene expression levels g, respectively). (D) Intensity measured at position x/L=0.72 (vertical gray dotted line in C) as a function of δFC, each point representing a different embryo. The 23 points of the 10–20 μm batch are plotted in light orange. The black line represents a nearest neighbor averaging with a Gaussian filter (σ=5 μm). Inset shows detrended light orange data points with weighted average subtracted, i.e., time-corrected. (E) Variance of Gt gene expression levels σg2 computed for the same 23 embryos shown in panel C before (light orange) and after (dark orange) time correction, respectively. Error bars obtained by bootstrapping; σI2 is the variance of the raw intensities (across orange profiles in C). (F) Estimation of residual variance in age determination
  (gray) due to measurement uncertainty
  after profile time correction (gray line); for comparison, in dark orange the variance σg2 of the time-corrected normalized profiles. For a similar analysis of the other gap genes see Supplementary Figure 2.
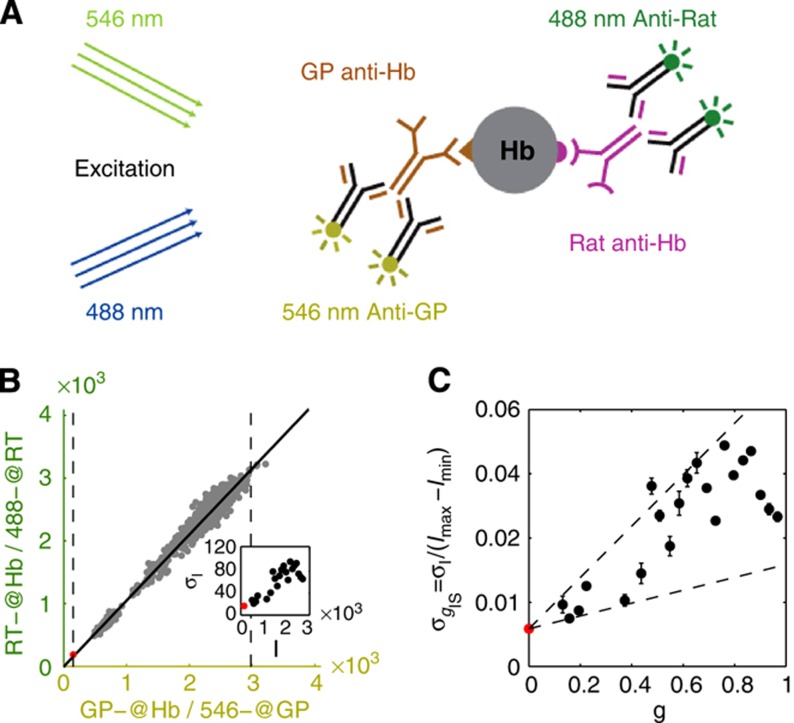
 ) as a function of the mean intensity I, computed over 40 equally spaced bins along the whole intensity range (only data points with five or more nuclei are shown). S.d. of zero expression level region shown as a red dot. (C) Rescaled measurement noise contribution from imaging and staining
  (computed from the data shown in inset of panel B) as a function of the gene expression level g. Red dot shows the background noise, and two dashed lines represent the 1 and 4% measurement noise levels, respectively. Error bars computed by bootstrapping.
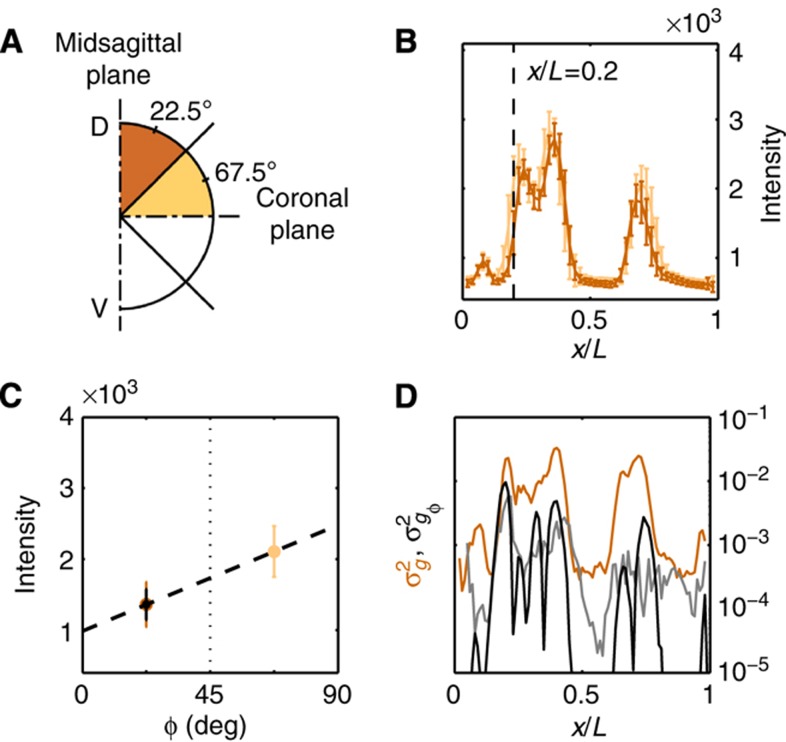
 ; total variance of gene expression profiles of the time-corrected dorsal profiles is shown in dark orange for comparison, gray line shows an estimation of the variance induced by the embryo orientation uncertainty by the alternative method of Supplementary Figure 4.
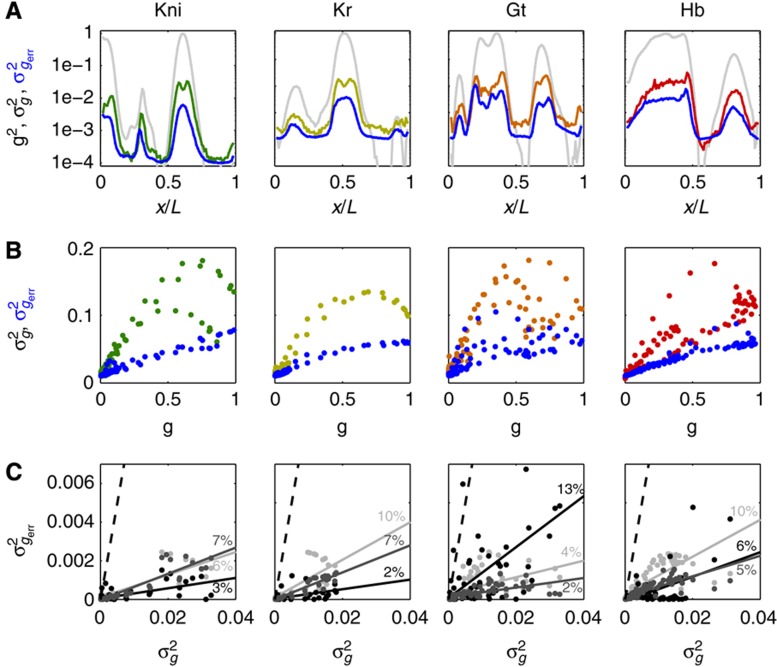
 from major sources of measured systematic errors (staining, imaging, orientation, and time) are shown in blue. (B) S.d. of gene expression levels in time-corrected normalized profiles (color) and s.d. owing to systematic error (blue) as a function of gene expression level g (for 100 equally spaced bins along the AP axis). (C) For each gap gene, we show a scatter plot of the variances owing to the major sources of systematic error versus the total variance measured across embryos: imaging and staining (light gray), age (dark gray), and orientation (black). For each source of systematic error, data points were fitted with a straight line; slopes represent estimated average contributions to the overall variance. For reference, dashed line represents the case
  .
.
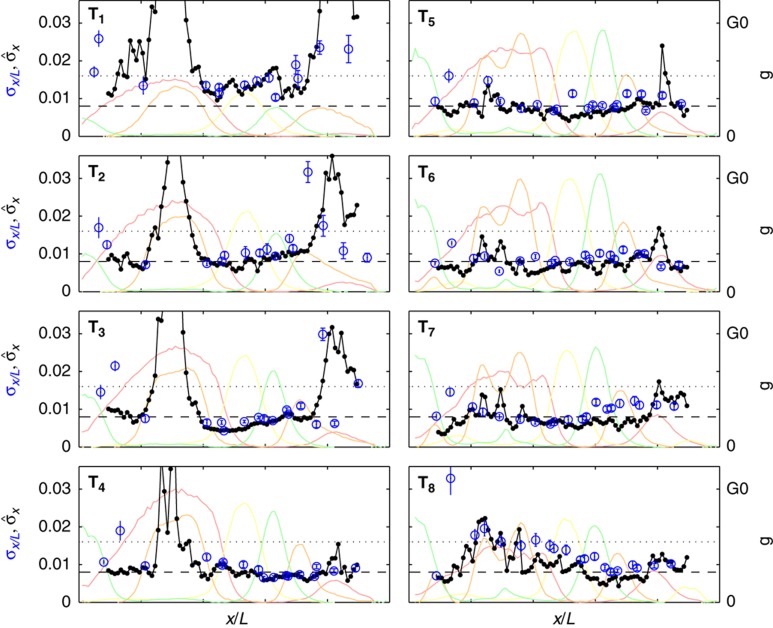
 obtained by simultaneously decoding all four gap genes (four-dimensional extension of Supplementary Figure 7) is shown in black for 100 AP positions. For reference, the mean gap gene profiles are shown in the background, color coded as above. Profiles have been scaled such that the maximum level of gene expression of their mean over the eight time windows is G0. The internuclear distance and half-internuclear distances are shown as dotted and dashed lines, respectively.
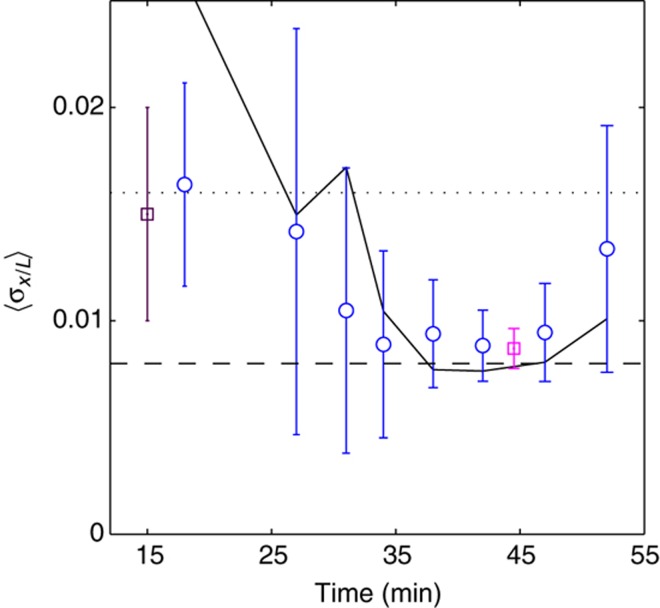
 is shown as a black line. For comparison, the maximum positional reproducibility of Bcd profiles 15 min into n.c. 14 (average between 10–60% EL) (Gregor et al, 2007a) is shown with a violet square, and the average positional reproducibility of the pair-rule genes rnt, eve, and prd 45 min into n.c. 14 is shown with a magenta square (Dubuis et al, 2011; Dubuis, 2012). For reference, the internuclear distance and the half-internuclear distance are shown in dotted and dashed lines, respectively.
References
-
- Akam M (1987) The molecular basis for metameric pattern in the Drosophila embryo. Development 101: 1–22 - PubMed
-
- Alexandre C, Lecourtois M, Vincent J (1999) Wingless and Hedgehog pattern Drosophila denticle belts by regulating the production of short-range signals. Development 126: 5689–5698 - PubMed
-
- Arias AM, Hayward P (2006) Filtering transcriptional noise during development: concepts and mechanisms. Nat Rev Genet 7: 34–44 - PubMed
-
- Capovilla M, Eldon ED, Pirrotta V (1992) The giant gene of Drosophila encodes a b-ZIP DNA-binding protein that regulates the expression of other segmentation gap genes. Development 114: 99–112 - PubMed
Publication types
MeSH terms
Substances
Grants and funding
LinkOut - more resources
Full Text Sources
Other Literature Sources
Molecular Biology Databases
Miscellaneous
