. 2013 Jan;25(1):288-307.
doi: 10.1105/tpc.112.106385. Epub 2013 Jan 22.

Orchestration of thiamin biosynthesis and central metabolism by combined action of the thiamin pyrophosphate riboswitch and the circadian clock in Arabidopsis

Affiliations

Orchestration of thiamin biosynthesis and central metabolism by combined action of the thiamin pyrophosphate riboswitch and the circadian clock in Arabidopsis

Samuel E Bocobza et al. Plant Cell. 2013 Jan.

Abstract

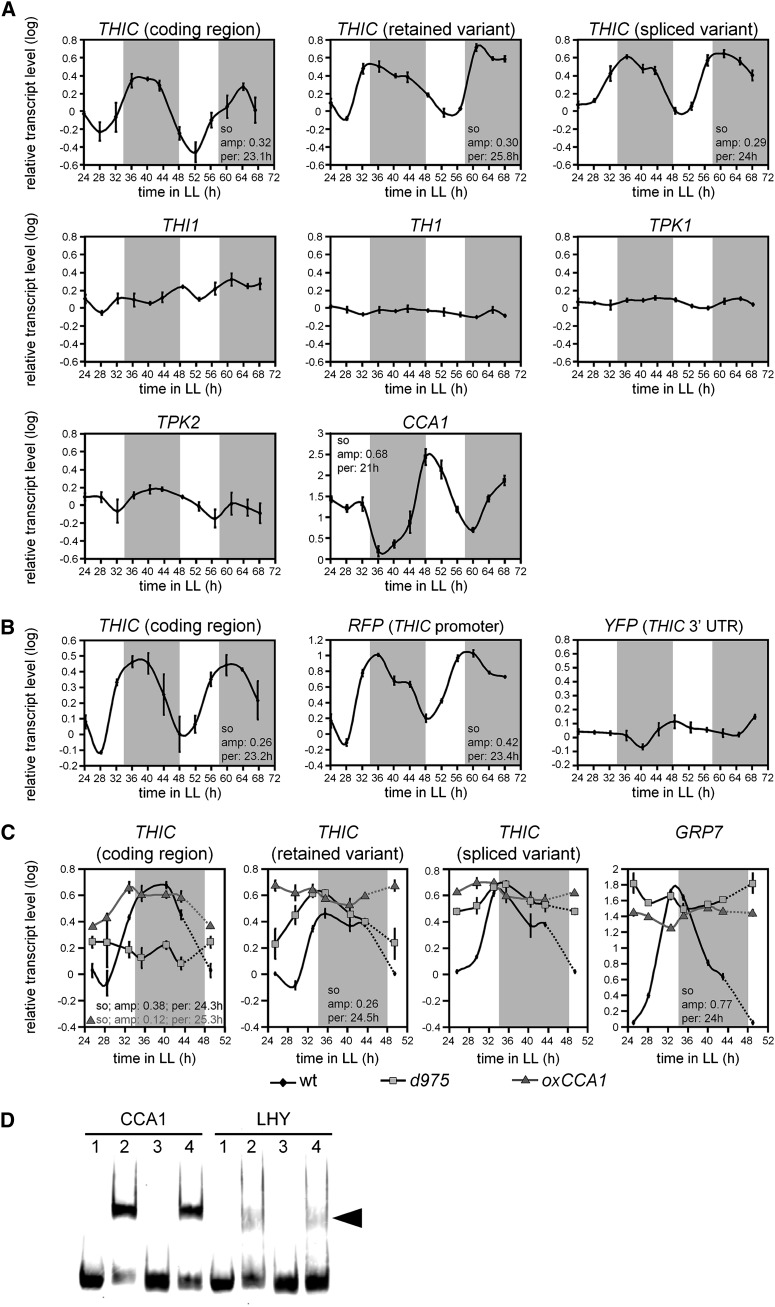
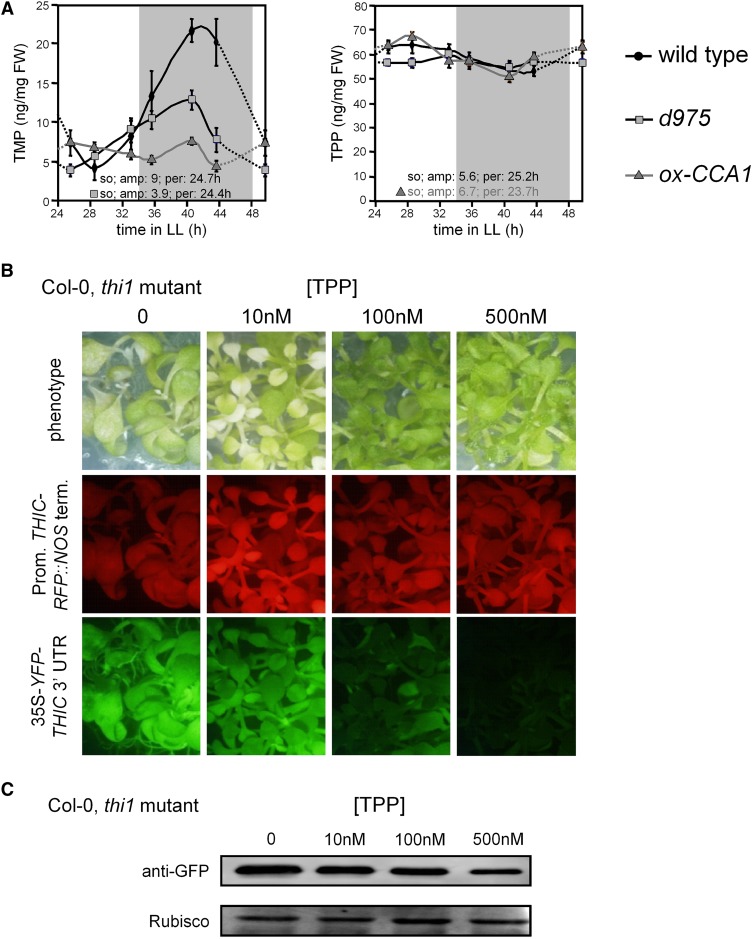
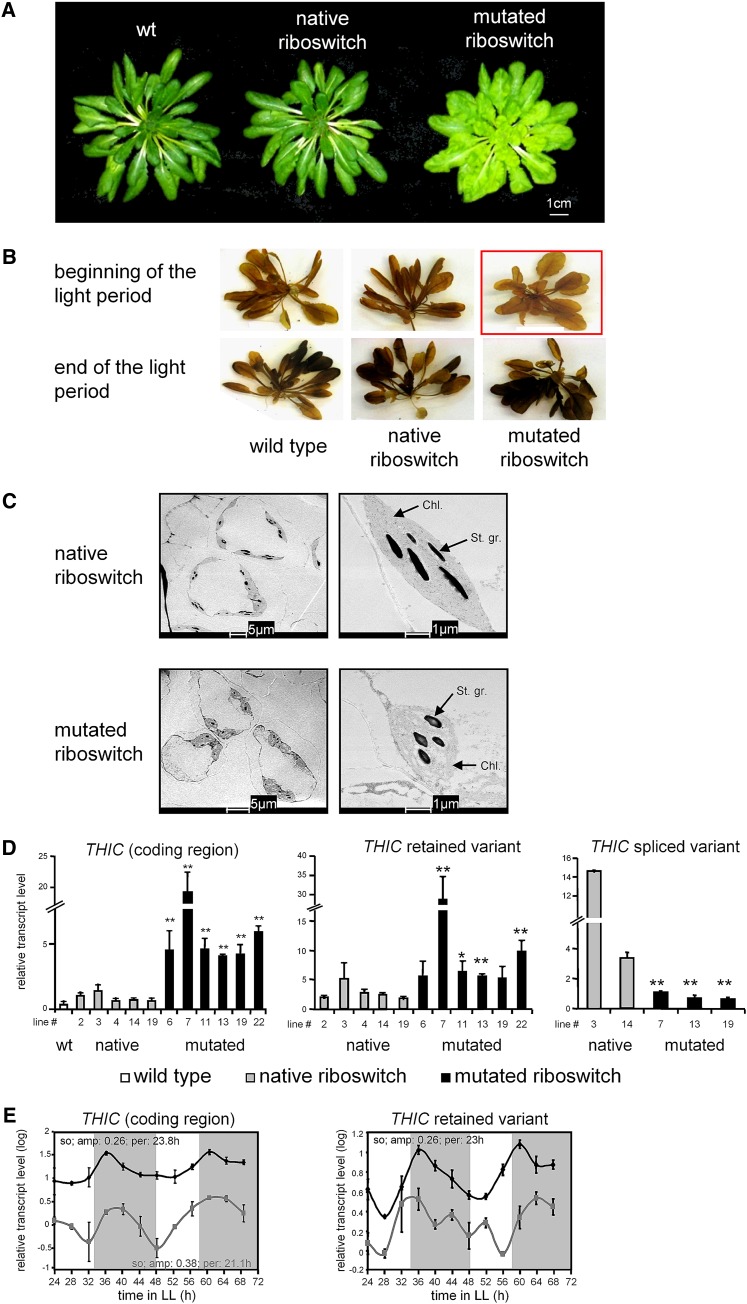
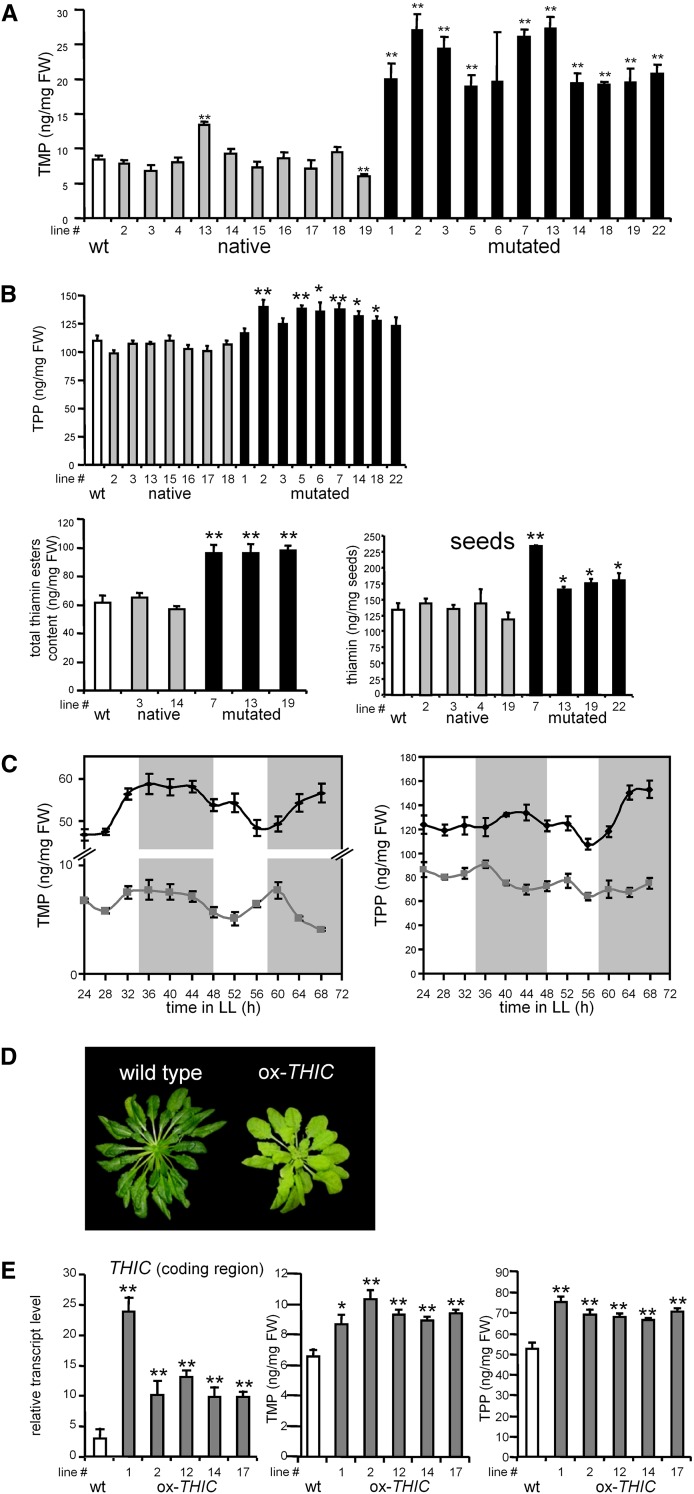
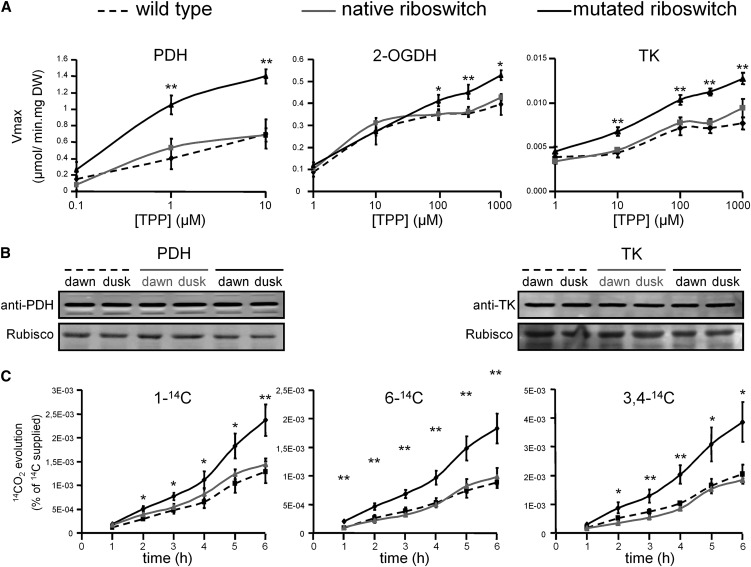
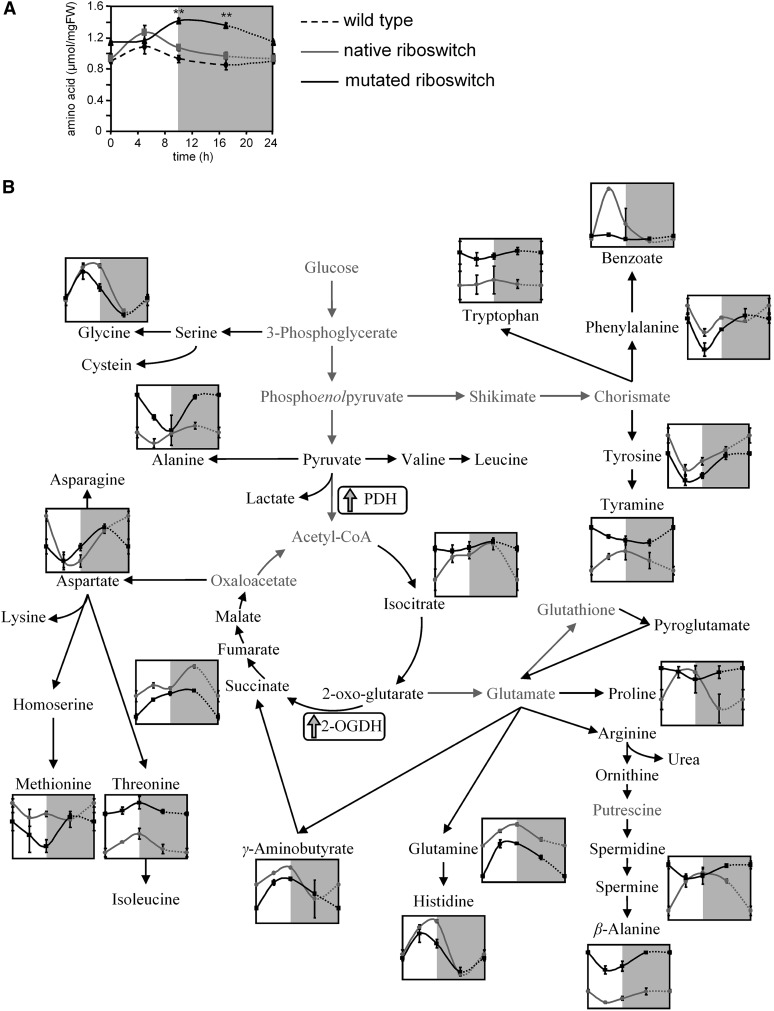
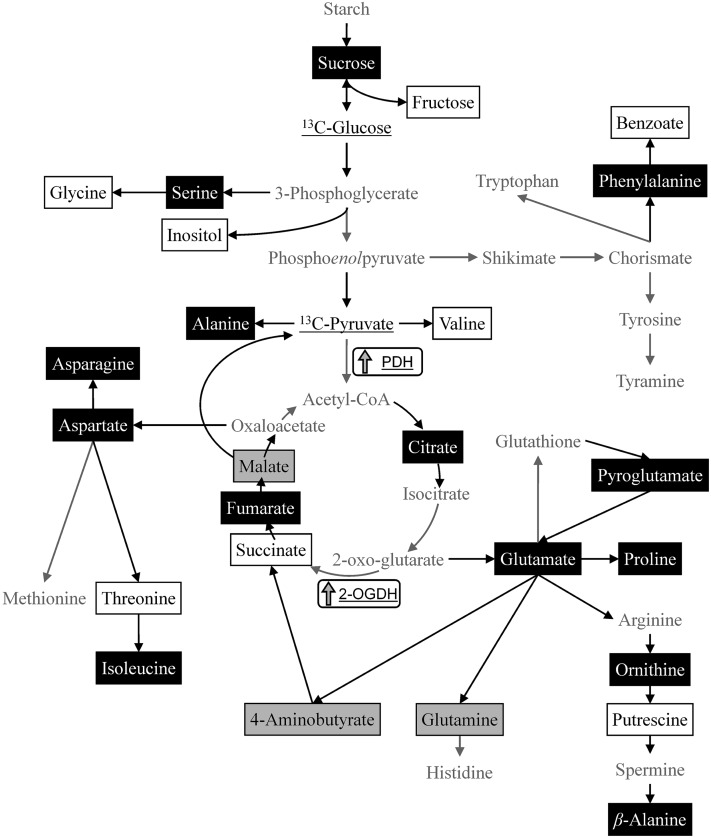
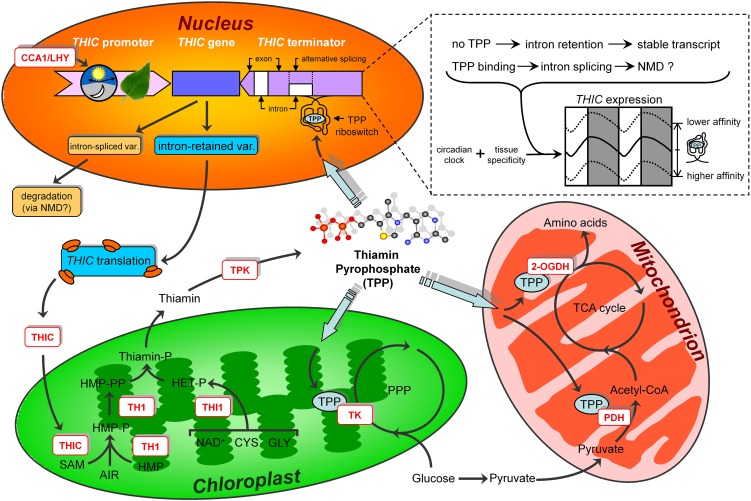
Riboswitches are natural RNA elements that posttranscriptionally regulate gene expression by binding small molecules and thereby autonomously control intracellular levels of these metabolites. Although riboswitch-based mechanisms have been examined extensively, the integration of their activity with global physiology and metabolism has been largely overlooked. Here, we explored the regulation of thiamin biosynthesis and the consequences of thiamin pyrophosphate riboswitch deficiency on metabolism in Arabidopsis thaliana. Our results show that thiamin biosynthesis is largely regulated by the circadian clock via the activity of the THIAMIN C SYNTHASE (THIC) promoter, while the riboswitch located at the 3' untranslated region of this gene controls overall thiamin biosynthesis. Surprisingly, the results also indicate that the rate of thiamin biosynthesis directs the activity of thiamin-requiring enzymes and consecutively determines the rate of carbohydrate oxidation via the tricarboxylic acid cycle and pentose-phosphate pathway. Our model suggests that in Arabidopsis, the THIC promoter and the thiamin-pyrophosphate riboswitch act simultaneously to tightly regulate thiamin biosynthesis in a circadian manner and consequently sense and control vital points of core cellular metabolism.


Figures

Figure 1.
Figure 1.
Circadian Regulation of the Thiamin Biosynthetic Gene THIC. (A) Circadian expression of the thiamin biosynthetic genes measured by qPCR (values are presented as means ± se using three independent biological replicates; n = 3) in Arabidopsis plants grown under short-day conditions for 21 d, prior to being transferred to constant light (LL) for the indicated time. The expected light and dark periods are indicated by white and gray backgrounds, respectively. (B) Circadian expression of RFP, YFP, and THIC, observed in Arabidopsis plants harboring the double reporter gene system (see Supplemental Figure 1A online), resolved by qPCR (n = 3; se). RFP expression is directed by the THIC promoter, and YFP expression is controlled by the CaMV 35S promoter and is fused to the THIC 3′ UTR (containing the riboswitch). (C) Circadian expression of the THIC gene, its splice variants, and the GRP7 gene measured by qPCR (n = 3; se) observed in Arabidopsis d975 mutants (square), CCA1 overexpressers (triangle), and wild-type (wt; black) plants. (D) Binding of the CCA1 and LHY proteins to the evening element located in the promoter of the THIC gene detected by an EMSA. Fluorescent-labeled oligonucleotides were separated on a 7% Tris-Gly PAGE without additional treatment (lane 1) or with 3 µg of the respective purified protein (lanes 2 to 4). Competition experiments were performed using a 100-fold native or mutated cold probe (lanes 3 and 4, respectively). The arrow indicates the band corresponding to the LHY probe complex. Note: “so” (for significant oscillation) indicates that the oscillation displayed by a given graph (in [A] to [C]) is significant (P value < 0.05) according to both N-model and cosinor analyses (see Methods). The amplitude (amp) and the period (per) of the significant oscillations are indicated in the same color as the corresponding graph.
Figure 2.
Figure 2.
Circadian Oscillations of Thiamin Esters and Response of the THIC Promoter and 3′ UTR to Exogenous TPP Application. (A) Circadian levels of TMP and TPP, observed in the aerial parts of 21-d-old d975 mutants (square), CCA1 overexpressers (triangle), and wild-type (black) Arabidopsis plants, were monitored by HPLC analysis (n = 5; se). “so” (significant oscillation) indicates that the oscillation displayed by a given graph is significant (P value < 0.05) according to both N-model and cosinor analyses (see Methods). The amplitude (amp) and the period (per) of the significant oscillations are indicated in the same color as the corresponding graph. FW, fresh weight. (B) RFP and YFP reporter genes expression monitor the activities of the THIC promoter (Prom.) and the THIC 3′ UTR (containing the riboswitch), respectively. The experiments were performed in the Arabidopsis thi1 mutant background harboring the double reporter gene system (see Supplemental Figure 1A online), grown for 10 d in vitro and supplied with the indicated TPP concentrations. Untransformed plants do not display autofluorescence (see Supplemental Figure 2C online). Comparable results were obtained with two additional independent transgenic lines. term., terminator. (C) Protein levels of YFP detected by protein gel blot. Soluble proteins were extracted from Arabidopsis thi1 mutant background harboring the double reporter gene system (see Supplemental Figure 1A online), grown for 10 d in vitro and supplied with the indicated TPP concentrations. Proteins were separated on 10% PAGE and transferred to a polyvinylidene difluoride (PVDF) membrane, which was subsequently immunodetected with anti-GFP antibodies. Rubisco, ribulose-1,5-bisphosphate carboxylase/oxygenase. [See online article for color version of this figure.]
Figure 3.
Figure 3.
Effects of TPP Riboswitch Deficiency on Arabidopsis Phenotype and on THIC Expression. (A) Phenotype of wild-type (wt; left) and transgenic plants harboring the native (middle, line #4) or the mutated (right, line #7) TPP riboswitch, grown for 8 weeks under short-day conditions. Similar phenotypes were obtained in five additional independent transgenic lines. (B) Iodine staining shows starch accumulation in 8-week-old Arabidopsis wild-type and transgenic plants harboring the native (line #4) or the mutated (line #7) TPP riboswitch observed at the beginning and the end of the light period. Reduced starch accumulation is observed in plants harboring the mutated riboswitch at the beginning of the light period (bordered in black). Similar results were obtained using additional plants. (C) Transmission electron microscopy of leaves derived from 3-week-old transgenic plants harboring the native (line #4) or the mutated (line #7) riboswitch. Chloroplast (Chl.) and starch granules (St. gr.) are shown. (D) Transcript levels of the THIC coding region and retained and spliced variants were resolved by qPCR (n = 3; se). Student's t test indicates significant changes from wild-type plants (left) or between a sample and line #2 (middle) or line #3 (right), which harbor the native riboswitch: *P value < 0.05; **P value < 0.01. Wild-type (21 d old; white) and transgenic Arabidopsis harboring the native (gray) or the mutated (black) riboswitch were used. Line numbers indicate independent transgenic lines. (E) Circadian expression of THIC and its intron-retained variant resolved by qPCR (n = 3; se) in transgenic Arabidopsis harboring the native (gray, line #4) or the mutated (black, line #7) riboswitch, grown under short-day conditions for 21 d, prior to being transferred to constant light (LL) for the indicated time. The expected light and dark periods are indicated by white and gray backgrounds, respectively. “so” (significant oscillation) indicates that the oscillation displayed by a given graph is significant (P value < 0.05) according to both N-model and cosinor analyses (see Methods). The amplitude (amp) and the period (per) of the significant oscillations are indicated in the same color as the corresponding graph. [See online article for color version of this figure.]
Figure 4.
Figure 4.
Effects of TPP Riboswitch Deficiency or THIC Overexpression on Thiamin Biosynthesis. (A) TMP levels observed in 21-d-old wild-type (wt; white) or transgenic plants harboring the native (gray) or the mutated (black) riboswitch grown under short-day conditions were monitored by HPLC analysis (n = 5, se, Student’s t test indicates significant changes from wild-type plants: *P value < 0.05; **P value < 0.01). Line numbers indicate independent transgenic lines. FW, fresh weight. (B) Levels of thiamin, TPP, and total thiamin, observed in dry seeds or in the aerial parts of 21-d-old Arabidopsis wild-type (white) and transgenic plants harboring the native (gray) or the mutated (black) riboswitch grown in soil under short-day conditions, were monitored by HPLC analysis (n = 5, se, Student’s t test indicates significant changes from the wild type, *P value < 0.05; **P value < 0.01). Independent lines of transformation are depicted by the line numbers. (C) Circadian levels of TMP and TPP observed in the aerial parts of 21-d-old transgenic plants harboring the native (gray, line #4) or the mutated (black, line #7) riboswitch grown under short-day conditions were monitored by HPLC analysis (n = 5, se). (D) Phenotypes of wild-type (left) and transgenic plants overexpressing the At THIC gene (right, line #1), grown for 8 weeks under short-day conditions. (E) Transcript levels of the At THIC gene expression (detected by qPCR; n = 3; se) and TMP and TPP levels (detected by HPLC analysis; n = 4, se) were monitored in the aerial part of 21-d-old wild-type (white) and transgenic Arabidopsis overexpressing the At THIC coding sequence (gray) grown in soil under short-day conditions. Line numbers indicate independent transgenic lines. Student’s t test indicates significant changes from the wild type: *P value < 0.05; **P value < 0.01. [See online article for color version of this figure.]
Figure 5.
Figure 5.
Riboswitch Deficiency Results in Enhanced Activities of Thiamin-Requiring Enzymes and Increased Carbohydrate Oxidation through the TCA Cycle and the PPP. (A) Activities of PDH, 2-OGDH, and TK were determined in 30-d-old fully expanded leaves harvested in the middle of the light photoperiod. DW, dry weight. (B) Protein levels of PDH and TK detected by a immunoblot in 21-d-old Arabidopsis at the beginning (dawn) and the end (dusk) of the light period. Soluble proteins were extracted from Arabidopsis plants, grown for 14 d in soil. Proteins were separated on 10% PAGE, transferred to a polyvinylidene difluoride membrane, which was subsequently immunodetected with either anti-PDH or anti-TK antibodies. Rubisco, ribulose-1,5-bisphosphate carboxylase/oxygenase. (C) Evolution of 14CO2 released from isolated leaf discs incubated with [1-14C]-, [3,4-14C]-, or [6-14C]-Glc. The 14CO2 liberated was captured (at hourly intervals) in a KOH trap, and the amount of 14bCO2 released was subsequently quantified by liquid scintillation counting. Measurements were performed using wild-type (dashed) and transgenic Arabidopsis plants harboring the native (gray, line #4) or the mutated (black, line #7) riboswitch. Values are presented as means ±se of determinations using six (A) or three (C) independent biological replicates per genotype. Student’s t test indicates significant changes from wild-type plants: *P value < 0.05; **P value < 0.01.
Figure 6.
Figure 6.
Riboswitch Deficiency Alters Steady State Core Metabolism. (A) Diurnal changes in amino acid levels measured in leaves of 30-d-old wild-type (dashed) and transgenic Arabidopsis plants harboring the functional (gray, line #4) or the mutated (black, line #7) riboswitch, using a colorimetric method. The data presented are means ± se of measurements from six individual biological replicates per genotype. Student’s t test indicates significant changes from wild-type plants: **P value < 0.01. The light and dark periods are indicated by white and gray backgrounds, respectively. FW, fresh weight. (B) Diurnal changes in steady states levels of polar and semipolar metabolites resolved using GC-TOF-MS. The data presented in black are means ± se of measurements from three independent lines of transformation harboring the mutated riboswitch, and the data in gray are means ± se of the wild type and two independent lines harboring the native riboswitch. Six individual biological replicates were measured for each genotype. A total of 43 compounds could be identified, among which 18 (depicted as graphs) exhibited differential levels in plants defective in riboswitch activity compared with plants harboring a functional riboswitch and to the wild type at least at one time point (P value < 0.05). The data presented are log10 (means) of the measurements. Graphs depicting the levels of all 43 metabolites identified in all transgenic and wild-type plants are shown in Supplemental Figure 6B online. Metabolites noted in black were detected, while those noted in gray were not. The increased activities observed for PDH and for 2-OGDH are represented by an upward arrow. Arrows represent either single or multiple steps. White and gray backgrounds in the graphs indicate the light and dark periods, respectively.
Figure 7.
Figure 7.
Redirection of Fluxes in Core Metabolism Mediated by Riboswitch Deficiency. Discs of 10-week-old wild-type and transgenic Arabidopsis plants harboring a functional (line #4) or the mutated (line #7) riboswitch were fed with 13C-pyruvate or 13C-Glc and subjected to metabolic profiling by means of GC-TOF-MS. Changes in metabolite labeling are mapped on the metabolic network. Metabolites shown in a black background are more labeled, while those in gray background are less labeled in plants deficient in riboswitch activity compared with plants harboring a functional riboswitch and to wild-type plants (according to a Student’s t test, P value < 0.05, n = 6). Metabolites shown in white background were detected but unchanged in this assay, and metabolites noted in gray were not detected. Arrows represent either single or multiple steps. The increased activities observed for PDH and for 2-OGDH are represented by an upward arrow. The complete results of the flux assay are presented in Supplemental Table 2 online.
Figure 8.
Figure 8.
Model for TPP Riboswitch Action as a Pacesetter Orchestrating Central Metabolism in Thiamin Autotrophs. The model represents multiple subcellular compartments, including the mitochondria, chloroplast, nuclei, and the cytosol. In the nucleus, the TPP riboswitch and the circadian clock regulate THIC expression together. In turn, THIC migrates to the chloroplast where it participates in thiamin biosynthesis. Thiamin is further pyrophosphorylated in the cytosol into TPP. Then, TPP reaches the nucleus to regulate THIC expression (via the TPP riboswitch) and the mitochondria and the chloroplast to assist enzymes of the TCA cycle and the PPP, respectively. AIR, 5-aminoimidazole ribonucleotide; DXP, 1-deoxy-d-xylulose-5-phosphate; HET-P, 4-methyl-5-(β-hydroxyethyl)thiazole phosphate; HMP, hydroxymethylpyrimidine; HMP-P, hydroxymethylpyrimidine phosphate; HMP-PP, hydroxymethylpyrimidine pyrophosphate; NAD, nicotinamide adenine dinucleotide; NMD, non-sense-mediated decay; SAM, S-adenosyl-l-Met; TH1, thiamin-monophosphate pyrophosphorylase; THI1, thiazole synthase; thiamin-P, TMP; TPK, thiamin pyrophosphokinase; var, variant. [See online article for color version of this figure.]

Similar articles

Cited by

References

    1. Ajjawi I., Rodriguez Milla M.A., Cushman J., Shintani D.K. (2007b). Thiamin pyrophosphokinase is required for thiamin cofactor activation in Arabidopsis. Plant Mol. Biol. 65: 151–162 - PubMed
    1. Ajjawi I., Tsegaye Y., Shintani D. (2007a). Determination of the genetic, molecular, and biochemical basis of the Arabidopsis thaliana thiamin auxotroph th1. Arch. Biochem. Biophys. 459: 107–114 - PubMed
    1. Alabadí D., Oyama T., Yanovsky M.J., Harmon F.G., Más P., Kay S.A. (2001). Reciprocal regulation between TOC1 and LHY/CCA1 within the Arabidopsis circadian clock. Science 293: 880–883 - PubMed
    1. Araújo W.L., Nunes-Nesi A., Trenkamp S., Bunik V.I., Fernie A.R. (2008). Inhibition of 2-oxoglutarate dehydrogenase in potato tuber suggests the enzyme is limiting for respiration and confirms its importance in nitrogen assimilation. Plant Physiol. 148: 1782–1796 - PMC - PubMed
    1. Bass J., Takahashi J.S. (2010). Circadian integration of metabolism and energetics. Science 330: 1349–1354 - PMC - PubMed

Publication types

MeSH terms