. 2013 Jan;25(1):71-82.
doi: 10.1105/tpc.112.106716. Epub 2013 Jan 22.

Organ evolution in angiosperms driven by correlated divergences of gene sequences and expression patterns

Affiliations

Organ evolution in angiosperms driven by correlated divergences of gene sequences and expression patterns

Ruolin Yang et al. Plant Cell. 2013 Jan.

Abstract

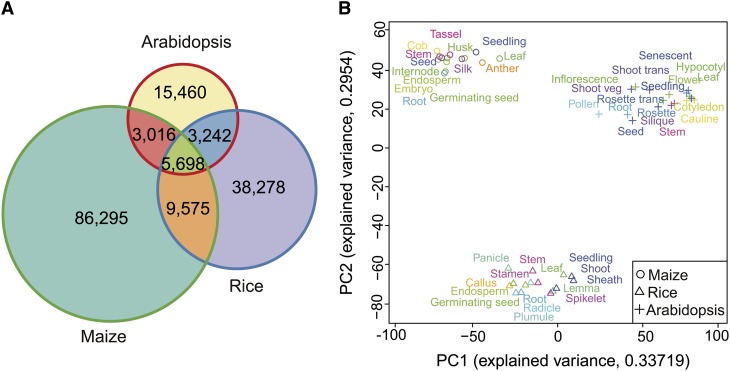
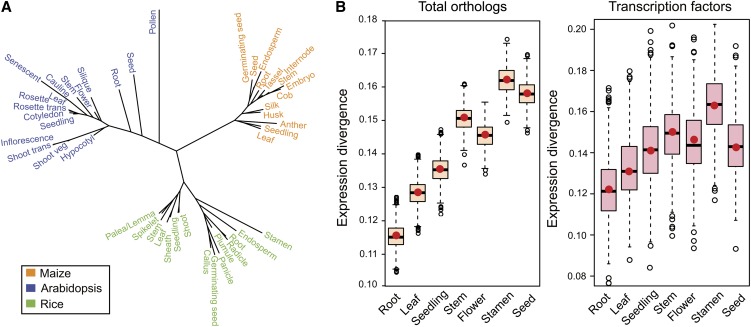
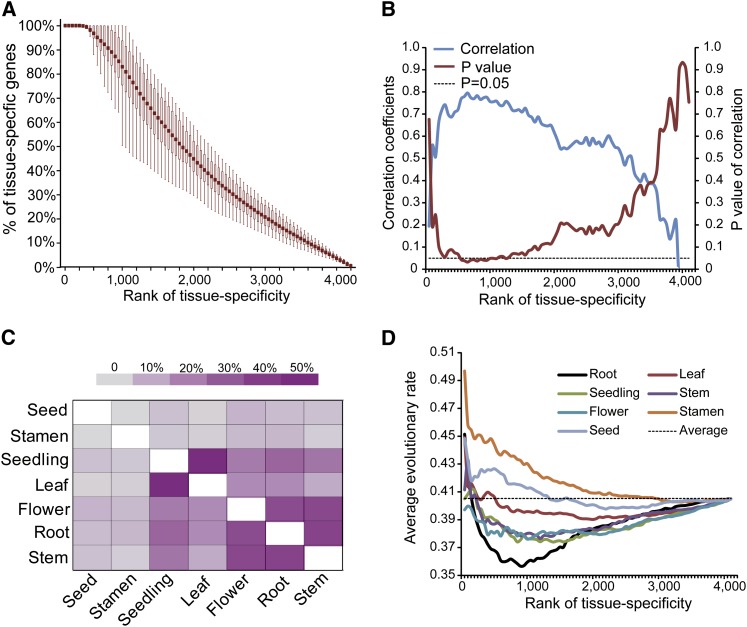
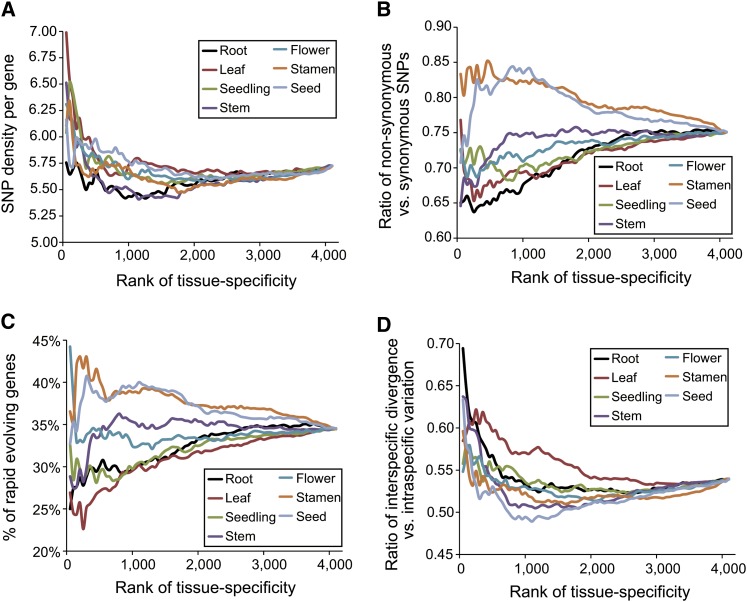
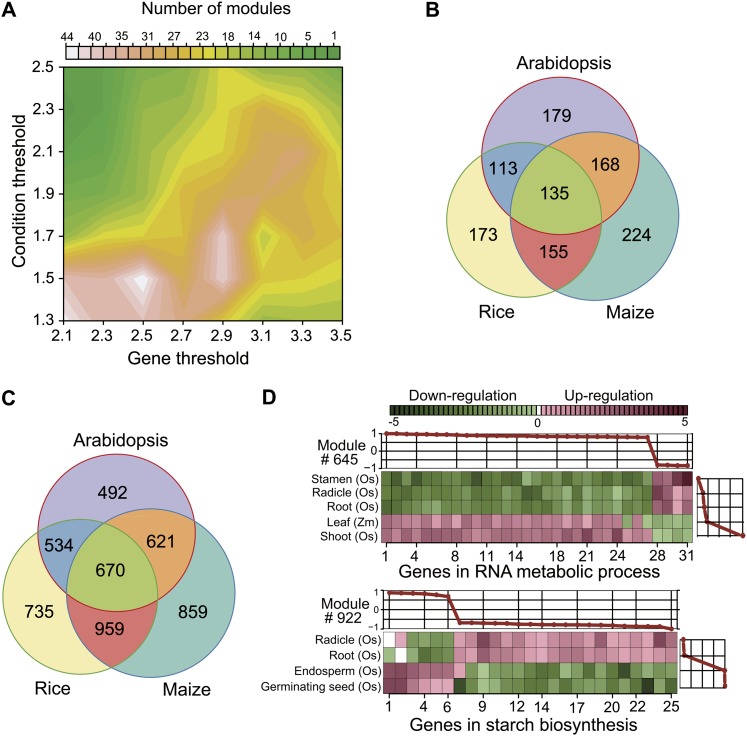
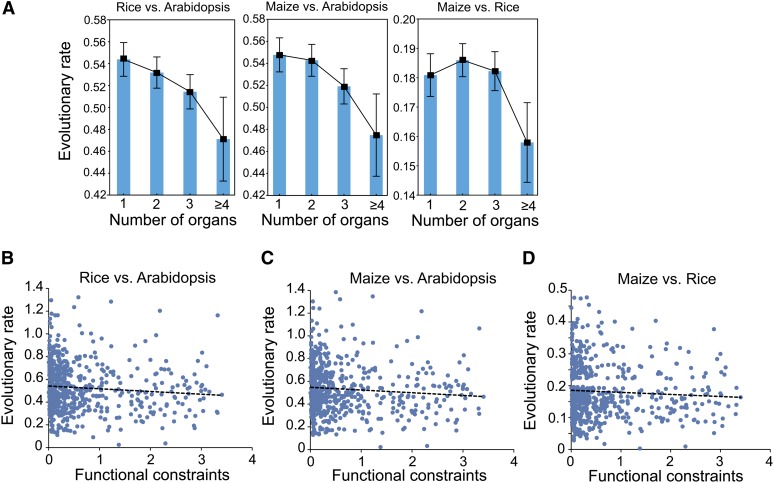
The evolution of a species involves changes in its genome and its transcriptome. Divergence in expression patterns may be more important than divergence in sequences for determining phenotypic changes, particularly among closely related species. We examined the relationships between organ evolution, sequence evolution, and expression evolution in Arabidopsis thaliana, rice (Oryza sativa), and maize (Zea mays). We found correlated divergence of gene sequences and expression patterns, with distinct divergence rates that depend on the organ types in which a gene is expressed. For instance, genes specifically expressed in reproductive organs (i.e., stamen) evolve more quickly than those specifically expressed in vegetative organs (e.g., root). The different rates in organ evolution may be due to different degrees of functional constraint associated with the different physiological functions of plant organs. Additionally, the evolutionary rate of a gene sequence is correlated with the breadth of its expression in terms of the number of tissues, the number of coregulation modules, and the number of species in which the gene is expressed, as well as the number of genes with which it may interact. This linkage supports the hypothesis that constitutively expressed genes may experience higher levels of functional constraint accumulated from multiple tissues than do tissue-specific genes.


Figures

Figure 1.
Figure 1.
Global Pattern of Tissue Expression in Arabidopsis, Maize, and Rice. (A) The numbers of species-specific and orthologous genes in the three species. (B) The PCA analysis of the interspecific tissue expression profiles.
Figure 2.
Figure 2.
Estimation of the Rates of Expression Divergence across the Seven Organs. (A) Unrooted phylogeny tree constructed with the NJ algorithm to infer the evolutionary distances for tissue expression. The NJ branch length may represent the degree of expression divergence. (B) Expression divergences of the seven organs computed based on the NJ tree lengths. The red dots and the corresponding boxes represent the observed values and the simulated distributions using the bootstrapping method, respectively. The left and right panels show the expression divergences deduced from all of the orthologs and the transcription factor genes, respectively.
Figure 3.
Figure 3.
Correlated Evolution of Gene Sequence and Expression Drives Organ Evolution in Plants. (A) Each organ contains ∼400 to 500 genes with top ranks of tissue specificity unique to this organ. With a decrease in tissue specificity, the proportion of genes shared among the seven organs gradually increases. The box plot represents the distribution of the fractions of the genes that were not shared by any pair of organs at different tissue specificity ranks. (B) Correlation between the expression divergences of the seven organs and the sequence divergences of tissue-specific genes in the seven organs. Significant correlations (Pearson r > 0.7 with P values < 0.05) were found within the range represented by ∼800 to 1200 of the most highly tissue-specific genes. (C) Percentages of the shared genes between any pair of organs among the top 800 tissue-specific genes in each organ. (D) Inference of the relative evolutionary rates of the seven organs. The y axis represents the average evolutionary rates of protein sequences of the top 50, 100, 150 … genes ranked by tissue specificity in the seven organs. The dashed line represents the average evolutionary rates of all 4117 orthologs.
Figure 4.
Figure 4.
Analysis of Population Genomic Data in Arabidopsis Indicates That Rapid Evolution of Stamen in Plants May Be Due to Relaxed Functional Constraint. (A) SNP densities (number of SNPs per gene per 100 bp) identified from the 80 strains of Arabidopsis show no bias across the seven organs. However, genes with higher tissue specificity contain more SNPs than those with lower tissue specificity. (B) Genes expressed in stamen and seed have higher ratios of nonsynonymous SNPs to synonymous SNPs than do those expressed in vegetative organs. (C) The fractions of rapidly evolving genes in stamen and seed are higher than in vegetative organs. The rapidly evolving genes were defined as the genes with more nonsynonymous SNPs than synonymous SNPs. (D) The ratios of interspecific protein divergence rates versus the intraspecific variation rates (rates of nonsynonymous SNPs versus synonymous SNPs) in the seven organs.
Figure 5.
Figure 5.
Identification of the ISA Modules with Coregulated Genes. (A) The number of modules identified with various gene thresholds and condition thresholds. (B) The numbers of modules unique to each species or shared between species. (C) The numbers of genes in the modules unique to each species or shared between species. (D) Two representative modules showing the coregulated orthologs across tissues and species. Each square represents a gene with upregulation (red) or downregulation in a module. “Os” is rice, and “Zm” is maize.
Figure 6.
Figure 6.
Expression-based functional constraint (eFC) (A) Genes expressed in more organs are more conserved in protein sequence than those expressed in fewer organs. (B) to (D) Protein evolutionary rates are negatively correlated with eFCs. The evolutionary rates are computed as the Poisson-corrected protein distance between the orthologs in any pair of Arabidopsis, rice, and maize. [See online article for color version of this figure.]

Comment in

Similar articles

Cited by

References

    1. Bergmann, S., Ihmels, J., and Barkai, N. (2003). Iterative signature algorithm for the analysis of large-scale gene expression data. Phys. Rev. E Stat Nonlin. Soft Matter Phys. 67: 031902. - PubMed
    1. Brawand D., et al. (2011). The evolution of gene expression levels in mammalian organs. Nature 478: 343–348 - PubMed
    1. Cao J., et al. (2011). Whole-genome sequencing of multiple Arabidopsis thaliana populations. Nat. Genet. 43: 956–963 - PubMed
    1. Clark N.L., Aagaard J.E., Swanson W.J. (2006). Evolution of reproductive proteins from animals and plants. Reproduction 131: 11–22 - PubMed
    1. Csárdi G., Kutalik Z., Bergmann S. (2010). Modular analysis of gene expression data with R. Bioinformatics 26: 1376–1377 - PubMed

LinkOut - more resources