. 2013 Jan;25(1):324-41.
doi: 10.1105/tpc.112.107227. Epub 2013 Jan 22.

Endodermal ABA signaling promotes lateral root quiescence during salt stress in Arabidopsis seedlings

Affiliations

Endodermal ABA signaling promotes lateral root quiescence during salt stress in Arabidopsis seedlings

Lina Duan et al. Plant Cell. 2013 Jan.

Abstract

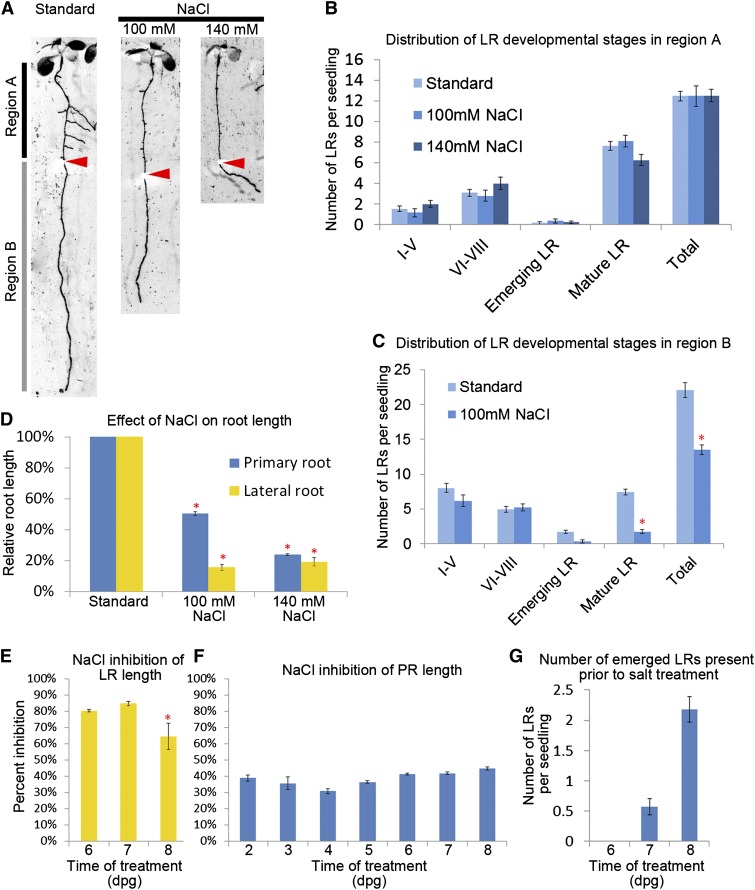
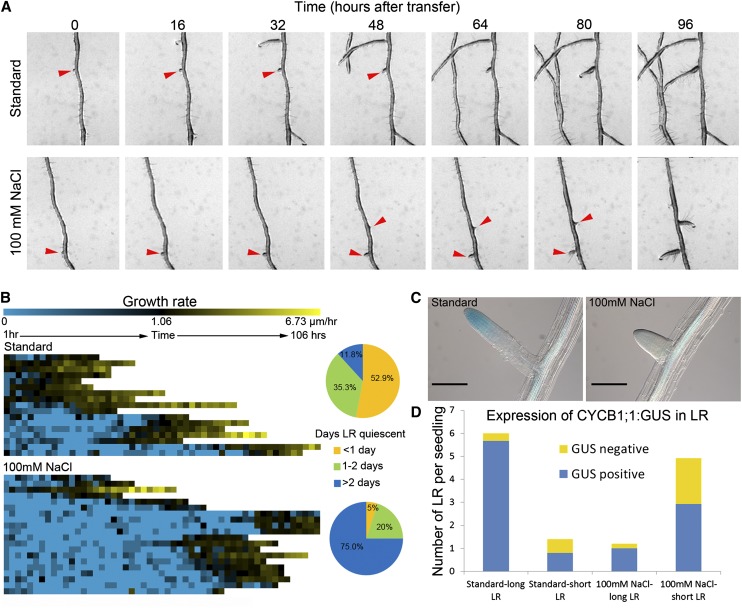
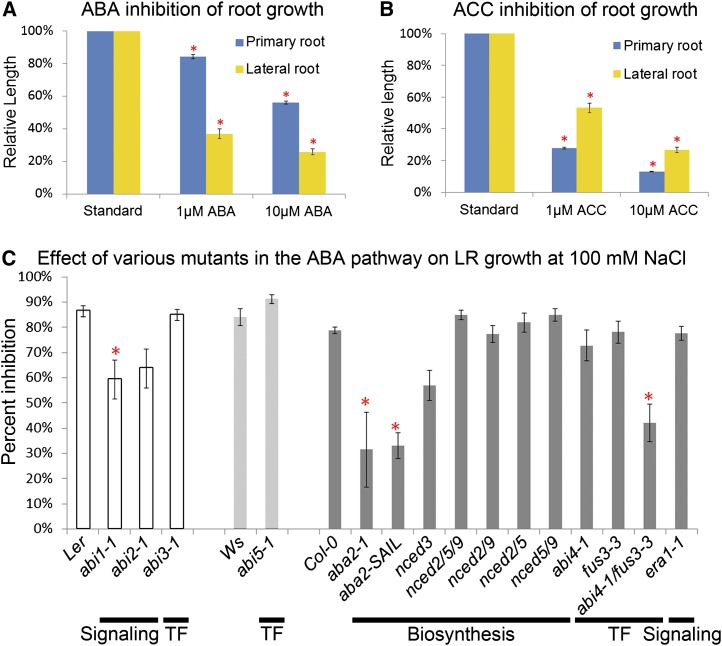
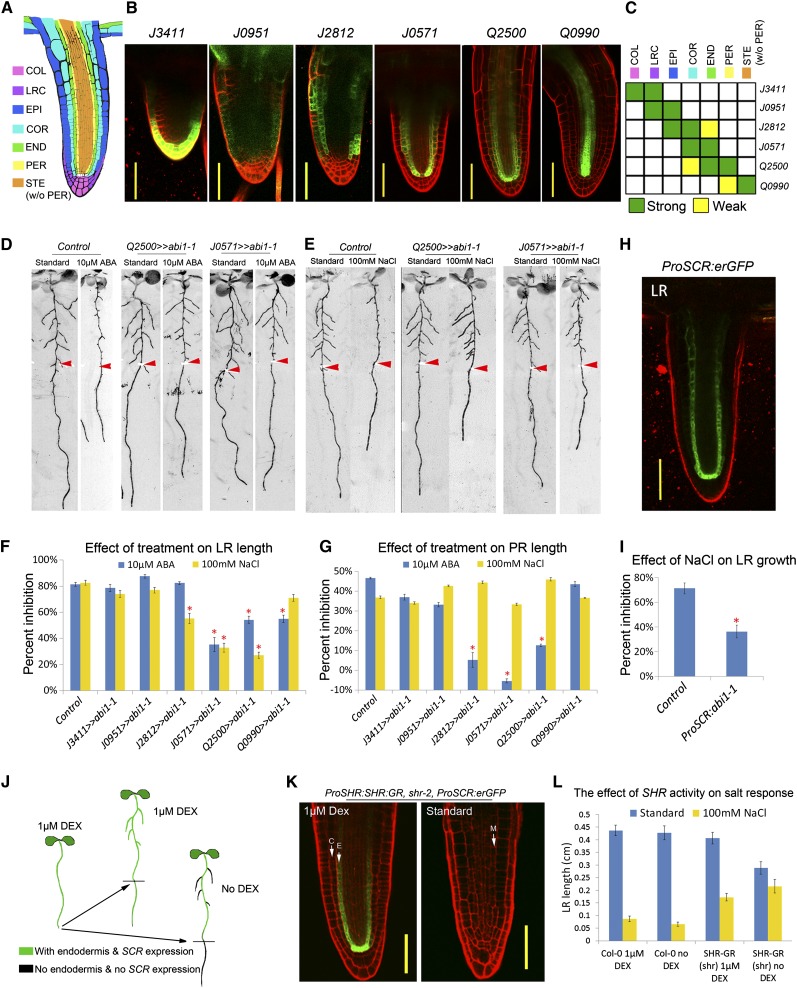
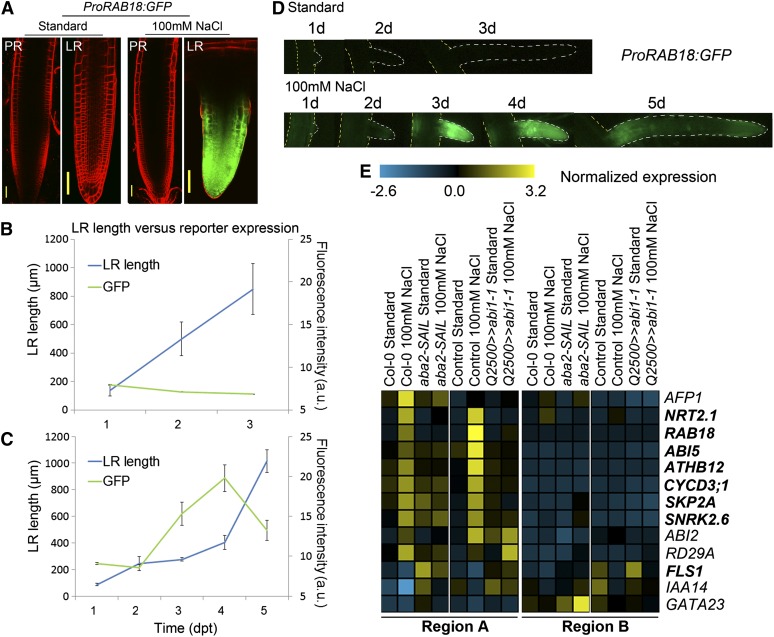
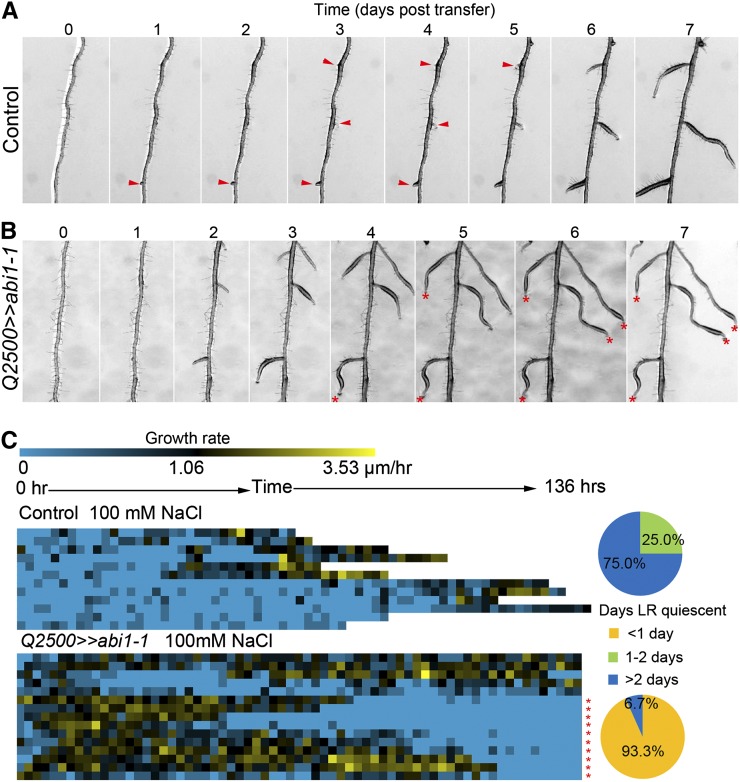
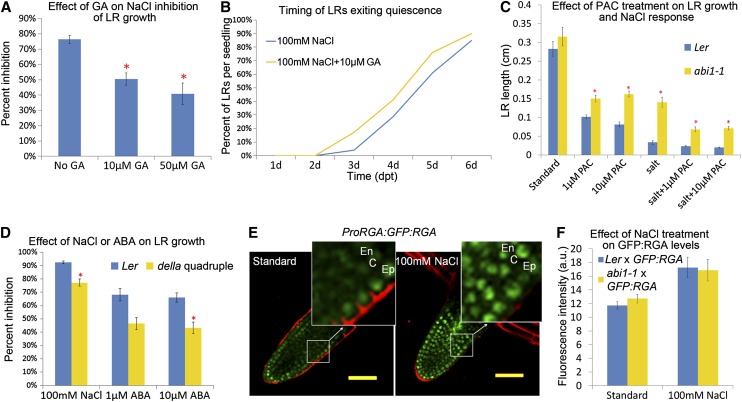
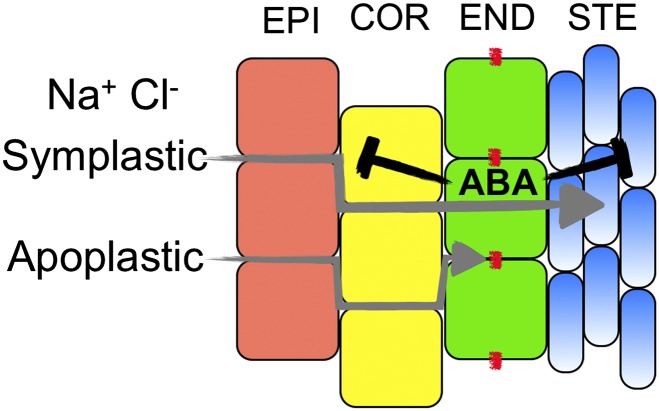
The endodermal tissue layer is found in the roots of vascular plants and functions as a semipermeable barrier, regulating the transport of solutes from the soil into the vascular stream. As a gateway for solutes, the endodermis may also serve as an important site for sensing and responding to useful or toxic substances in the environment. Here, we show that high salinity, an environmental stress widely impacting agricultural land, regulates growth of the seedling root system through a signaling network operating primarily in the endodermis. We report that salt stress induces an extended quiescent phase in postemergence lateral roots (LRs) whereby the rate of growth is suppressed for several days before recovery begins. Quiescence is correlated with sustained abscisic acid (ABA) response in LRs and is dependent upon genes necessary for ABA biosynthesis, signaling, and transcriptional regulation. We use a tissue-specific strategy to identify the key cell layers where ABA signaling acts to regulate growth. In the endodermis, misexpression of the ABA insensitive1-1 mutant protein, which dominantly inhibits ABA signaling, leads to a substantial recovery in LR growth under salt stress conditions. Gibberellic acid signaling, which antagonizes the ABA pathway, also acts primarily in the endodermis, and we define the crosstalk between these two hormones. Our results identify the endodermis as a gateway with an ABA-dependent guard, which prevents root growth into saline environments.


Figures

Figure 1.
Figure 1.
The Growth of PRs and LRs Is Differentially Affected by Salt Stress. (A) Morphology of the Col-0 root system grown on standard media for 6 dpg then transferred to standard, 100 mM NaCl, or 140 mM NaCl media conditions for 4 d. Arrowheads mark the position of the root tip at the time of transfer from standard to treatment conditions. (B) and (C) Quantitation of preemergent and late stages of LR development in root region A (B) and region B (C) after transfer to standard or salt stress conditions (n > 10 seedlings). (D) Average PR and LR length for seedlings transferred to 100 or 140 mM NaCl. Measurements are expressed as a percentage of the length under standard conditions (n > 20 seedlings). (E) and (F) Suppression of LR (E) and PR (F) growth under 100 mM NaCl conditions measured as a percentage of reduction relative to standard conditions. Seedlings were transferred to salt at different days postgermination (dpg) and grown for 4 dpt (n > 8 seedlings). (G) Number of emerged LRs formed in 6, 7, or 8 dpg seedlings before transfer (n > 30 seedlings). Error bars indicate se. Asterisks mark significant changes in salt response based on a Student’s t test, P value < 0.05. [See online article for color version of this figure.]
Figure 2.
Figure 2.
A Prolonged Quiescent Phase Is Induced during Salt Stress in Postemergent LRs. (A) Time-lapse images of 6 dpg Col-0 seedlings after transfer to standard conditions (top panels) or 100 mM NaCl conditions (bottom panels). Red arrowheads mark quiescent LRs. (B) Heat map showing the growth profiles of individual LRs quantified from time-lapse imaging data. Each pixel in the heat map represents the total growth over 2 h. Data quantified from 10 to 12 seedlings transferred to standard (n = 17 LRs) or salt stress (n = 20 LRs) conditions and imaged for 7 dpt. Pie charts to the right of the heat maps quantify the proportion of LRs that are quiescent for different lengths of time. Salt stress causes a dramatic increase in the number of roots showing quiescent growth for more than 2 d. (C) Staining pattern of the CYCB1;1:GUS reporter in postemergent LRs 3 dpt to standard conditions (left panel) or to 100 mM NaCl conditions (right panel). Bars = 100 μm. (D) Quantification of CYCB1;1:GUS activity at different stages of postemergent LR development under standard or salt stress conditions (n = 15 individual seedlings). LRs were categorized as long or short based on the presence of a clear elongation and maturation zone. More LRs are shorter under salt stress conditions and these roots often lack GUS reporter expression.
Figure 3.
Figure 3.
LR Growth Is Hypersensitive to ABA Treatment and Mutants Disrupting the ABA Signaling Pathway Affect Salt-Mediated Suppression of LR Growth. (A) and (B) Relative PR and LR length quantified 4 dpt to media supplemented with 1 or 10 μM ABA (A) or 1 or 10 μM (B) ACC (n > 20 seedlings). (C) Mutants disrupting ABA biosynthesis, signal transduction, or transcriptional regulation were surveyed for defects in the response to 100 mM NaCl. The average length of all LRs per seedling was measured and the percentage of difference between salt stress and standard conditions was calculated and shown in the graph. Mutations in the Ler background are shown as white bars, Ws background as light-gray bars, and Col-0 background as dark-gray bars (n > 15 seedlings). TF, transcription factor. All seedlings grown for 6 dpg and average LR length per seedling measured 4 dpt. Error bars indicate se. Asterisks mark significant changes in salt response based on a Student’s t test, P value < 0.05, with Bonferroni correction. [See online article for color version of this figure.]
Figure 4.
Figure 4.
The Endodermis Is an Important Site for ABA Signaling and Growth Regulation during Salt Stress. (A) A false-colored drawing of a LR illustrating the different cell types present. COL, columella root cap; COR, cortex; END, endodermis; EPI, epidermis; LRC, lateral root cap; PER, pericycle; STE, stele without pericycle. (B) Confocal images of the various GAL4-VP16/UAS enhancer trap lines used in this study showing the activity of the associated UAS:erGFP reporter in postemergent LRs. (C) Heat map summarizing the relative expression level of the various enhancer trap lines. (D) and (E) Images of root systems for the control genotype, Q2500>>abi1-1, and J0571>>abi1-1 transactivation lines 4 dpt to standard conditions, 10 μM ABA treatment (D), or 100 mM NaCl conditions (E). Red arrowheads mark the position of the root tip at the time of transfer. (F) and (G) The average length of all LRs (F) or PRs (G) per seedling was measured and the percentage of difference between the treatment and standard conditions was calculated and shown in the graph. Growth suppression by 4 dpt to 100 mM NaCl conditions or 10 μM ABA conditions is shown (n > 20 seedlings). (H) Confocal image of ProSCR:erGFP expression in a postemergent LR is localized to the endodermis. (I) Percentage of difference in LR length of the ProSCR:abi1-1 transgenic line 4 dpt to 100 mM NaCl conditions (n > 18 seedlings). (J) Diagram illustrating our experimental design for studying the effects of genetically ablating the endodermal tissue layer specifically in LRs. The ProSHR:SHR:GR, shr-2, ProSCR:erGFP line was grown on media supplemented with 1 μM DEX for 6 dpg then transferred to media with or without DEX. In the diagram, green portions of the root have an endodermis and ProSCR:erGFP reporter activity. (K) Confocal images of the ProSHR:SHR:GR, shr-2, ProSCR:erGFP line in LRs, which developed after transfer to media with (left panel) or without (right panel) DEX. With DEX treatment, GFP expression driven by the ProSCR:erGFP marks the endodermis, while only a mutant cell layer (M) exists without it.c, cortex; e, endodermis. (L) Quantitation of LR length in Col-0 and the ProSHR:SHR:GR, shr-2, ProSCR:erGFP transgenic line 4 dpt to standard conditions or 100 mM NaCl-supplemented media with or without 1 μM DEX (n > 17 seedlings). Error bars indicate se. Red asterisks mark significant differences based on a two-way analysis of variance and Student’s t test, P value < 0.05. Bars = 50 μm.
Figure 5.
Figure 5.
ABA Signaling Is Selectively Induced in LRs and Correlates with Growth Quiescence. (A) Seedlings with the ProRAB18:GFP reporter were transferred to standard or 100 mM NaCl media and PRs or LRs imaged by confocal microscopy. Bars = 50 μm. (B) and (C) Quantification of LR length and ProRAB18:GFP fluorescence intensity in seedlings transferred to standard conditions for 1 to 3 d posttransfer (dpt) (B) or 100 mM NaCl for 1 to 5 dpt (C) (n = 15 seedlings). Error bars indicate se. a.u., arbitrary units. (D) Time-lapse images of ProRAB18:GFP expression in LRs after transfer to standard or 100 mM NaCl conditions. (E) Gene expression analysis of ABA-dependent salt responsive genes using high-throughput qRT-PCR. Expression was measured 3 dpt to standard or 100 mM NaCl media from root region A and region B, separately. Expression measured in Col-0, aba2-SAIL, enhancer trap control, and the Q2500>>abi1-1 transactivation line. Heat map shows normalized gene expression values averaged from two biological replicates and three technical replicates. Gene expression profiles were organized by hierarchical clustering. Bold highlighted genes showed dependency on endodermal ABA signaling.
Figure 6.
Figure 6.
Suppression of Endodermal ABA Signaling Leads to a Loss of Salt-Induced Quiescence and Unsustainable Growth Recovery. (A) and (B) Time-lapse images of enhancer trap control (A) or Q2500>>abi1-1 transactivation seedlings (B) after transfer to 100 mM NaCl conditions. Red arrowheads mark quiescent LRs. Red asterisks mark LRs that showed unsustainable growth recovery. (C) Heat map showing the growth profiles of individual LRs quantified from time-lapse imaging data. Each pixel in the heat map represents the total growth over 2 h. Data quantified from enhancer trap control seedlings (n = 12 LRs) or Q2500>>abi1-1 transactivation seedlings (n = 15 LRs) transferred to 100 mM NaCl conditions and imaged for 7 d. Pie charts to the right of the heat maps quantify the proportion of LRs that are quiescent for different lengths of time. Red asterisks mark LRs that show unsustainable growth recovery, 10 out of 15.
Figure 7.
Figure 7.
Integration of GA and ABA Signaling Pathways during Salt Stress. (A) Percentage of difference in average LR length per seedling quantified 4 dpt to media containing 100 mM NaCl compared with control conditions. Media was supplemented with 0, 10, or 50 μM GA (n > 20 seedlings). Ecotype used here is Col-0. (B) Percentage of LRs (ProRAB18:GFP) that had exited quiescence after transfer to 100 mM NaCl with or without 10 μM GA. Emerged LRs were followed on six to 10 individual seedlings over 6 d. LRs that were shorter than 0.5 mm in length were categorized as quiescent. (C) Average length of LRs per seedling for Ler and abi1-1 mutants measured 4 dpt to standard or 100 mM NaCl media supplemented with various concentrations of the GA biosynthesis inhibitor, PAC (n > 17 seedlings). (D) Percentage of difference in the average LR length per seedling 4 dpt to media supplemented with 100 mM NaCl or two different concentrations of ABA. Genotype is Ler or the della quadruple mutant (n > 20 individual seedlings). (E) Confocal images of postemergence stage LRs grown under standard (left panel) or 100 mM NaCl (right panel) conditions and expressing the ProRGA:GFP-RGA reporter. Bars = 50 μm. En, endodermis; C, cortex; Ep, epidermis. (F)Quantification of GFP fluorescence intensity in F1 hybrid plants generated by a cross between Ler and ProRGA:GFP:RGA or abi1-1 −/− and ProRGA:GFP:RGA. Seedlings grown for 3 dpt to standard or 100 mM NaCl conditions (n > 8 LRs). a.u., arbitrary units. Error bars indicate se. Red asterisks represent significant differences as determined by the Student’s t test, P value < 0.05.
Figure 8.
Figure 8.
Model for the Regulation of LR Growth by NaCl-Triggered ABA Signaling. Possible routes for the diffusion of NaCl associated ions through the tissues of the root are shown. Apoplastic movement of solutes can occur through the epidermis (EPI) and cortex (COR) but is blocked at the Casparian strip (red dashes) of the endodermis (END). Solutes entering into the stele (STE), where the vasculature is housed, must be transported into the symplast and pass through the cytoplasm of the endodermis. Sensing of sodium ions in the endodermal cytoplasm presumably triggers ABA signaling, which causes growth arrest of the neighboring tissues. [See online article for color version of this figure.]

Similar articles

Cited by

References

    1. Abramoff M.D., Magelhaes P.J., Ram S.J. (2004). Image processing with ImageJ. Biophotonics International 11: 36–42
    1. Achard P., Cheng H., De Grauwe L., Decat J., Schoutteten H., Moritz T., Van Der Straeten D., Peng J., Harberd N.P. (2006). Integration of plant responses to environmentally activated phytohormonal signals. Science 311: 91–94 - PubMed
    1. Alassimone J., Naseer S., Geldner N. (2010). A developmental framework for endodermal differentiation and polarity. Proc. Natl. Acad. Sci. USA 107: 5214–5219 - PMC - PubMed
    1. An F., et al. (2010). Ethylene-induced stabilization of ETHYLENE INSENSITIVE3 and EIN3-LIKE1 is mediated by proteasomal degradation of EIN3 binding F-box 1 and 2 that requires EIN2 in Arabidopsis. Plant Cell 22: 2384–2401 - PMC - PubMed
    1. Armstrong F., Leung J., Grabov A., Brearley J., Giraudat J., Blatt M.R. (1995). Sensitivity to abscisic acid of guard-cell K+ channels is suppressed by abi1-1, a mutant Arabidopsis gene encoding a putative protein phosphatase. Proc. Natl. Acad. Sci. USA 92: 9520–9524 - PMC - PubMed

Publication types

MeSH terms

LinkOut - more resources