. 2013 Mar;161(3):1347-61.
doi: 10.1104/pp.112.208934. Epub 2013 Jan 22.

Low pH, aluminum, and phosphorus coordinately regulate malate exudation through GmALMT1 to improve soybean adaptation to acid soils

Affiliations

Low pH, aluminum, and phosphorus coordinately regulate malate exudation through GmALMT1 to improve soybean adaptation to acid soils

Cuiyue Liang et al. Plant Physiol. 2013 Mar.

Abstract

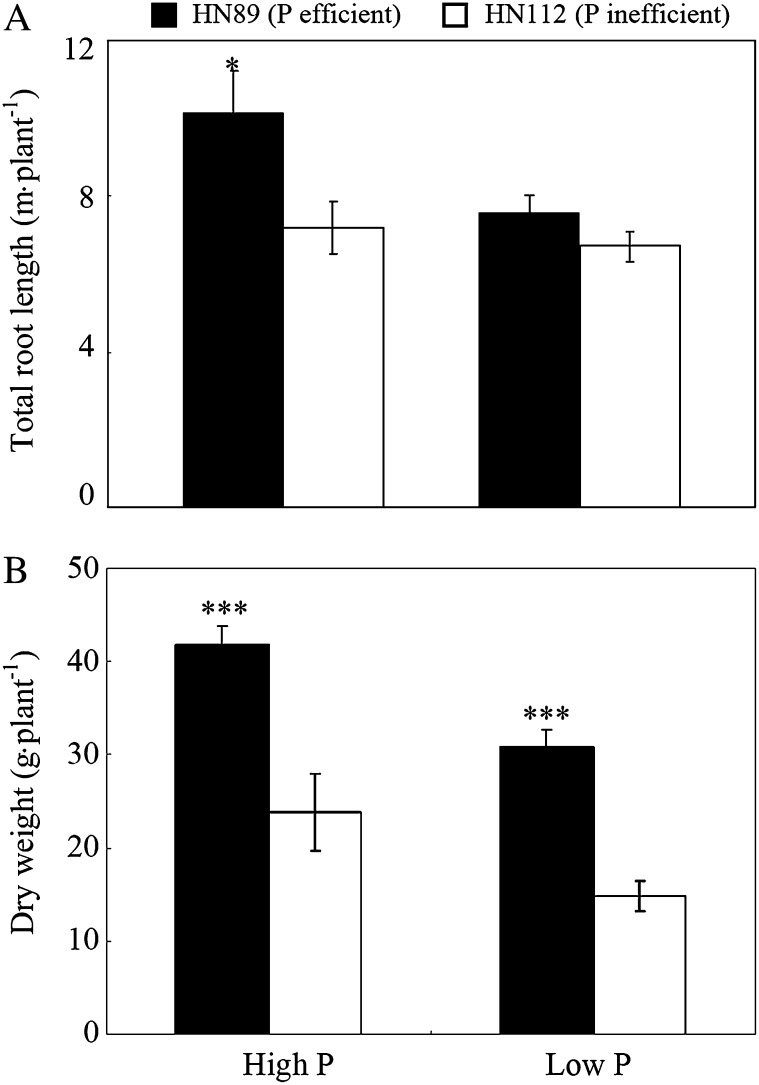
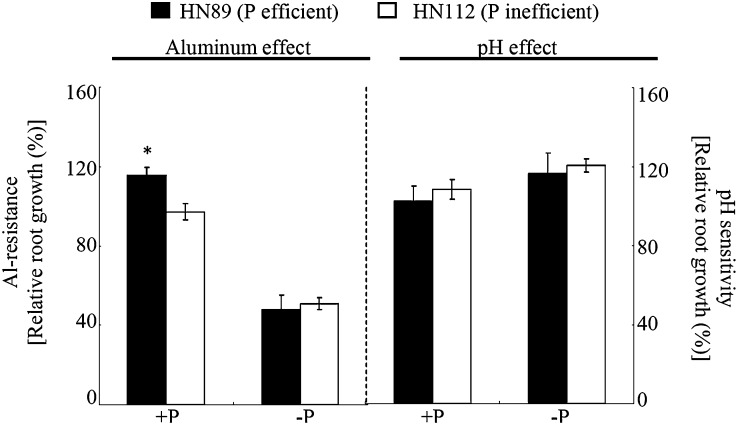
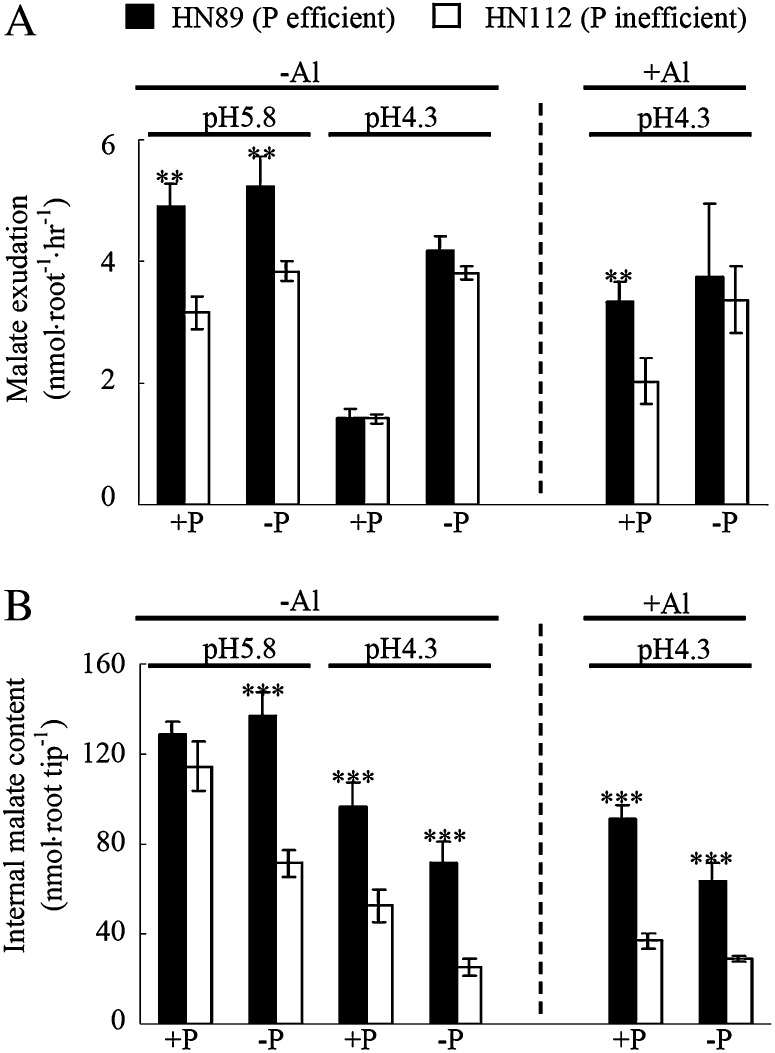
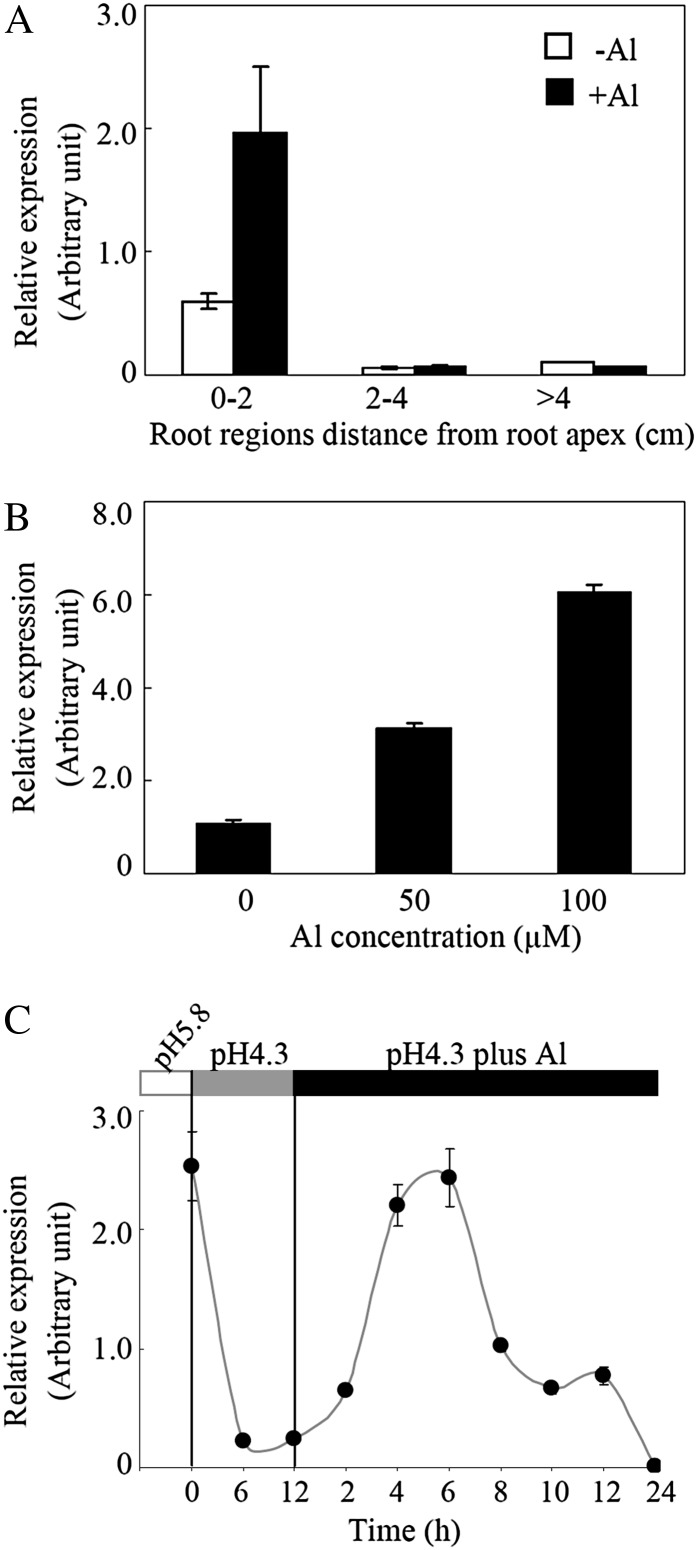
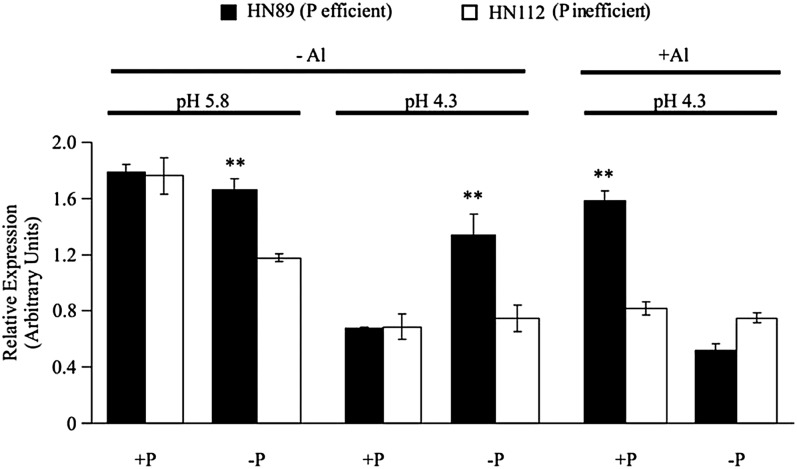
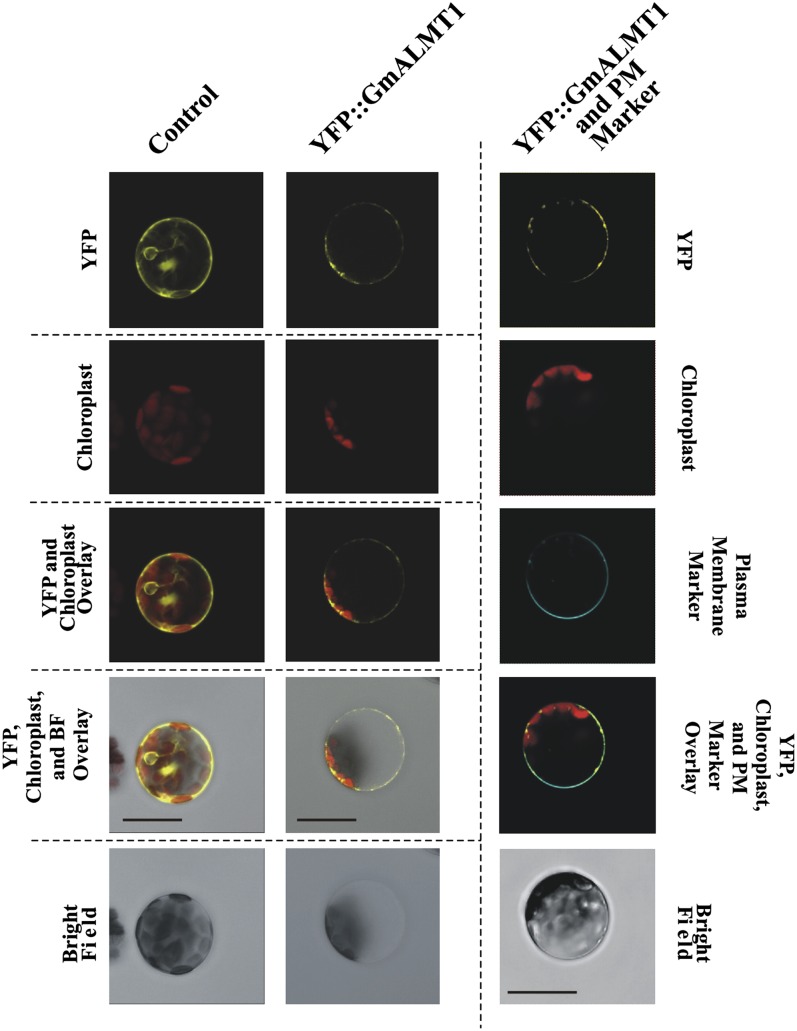
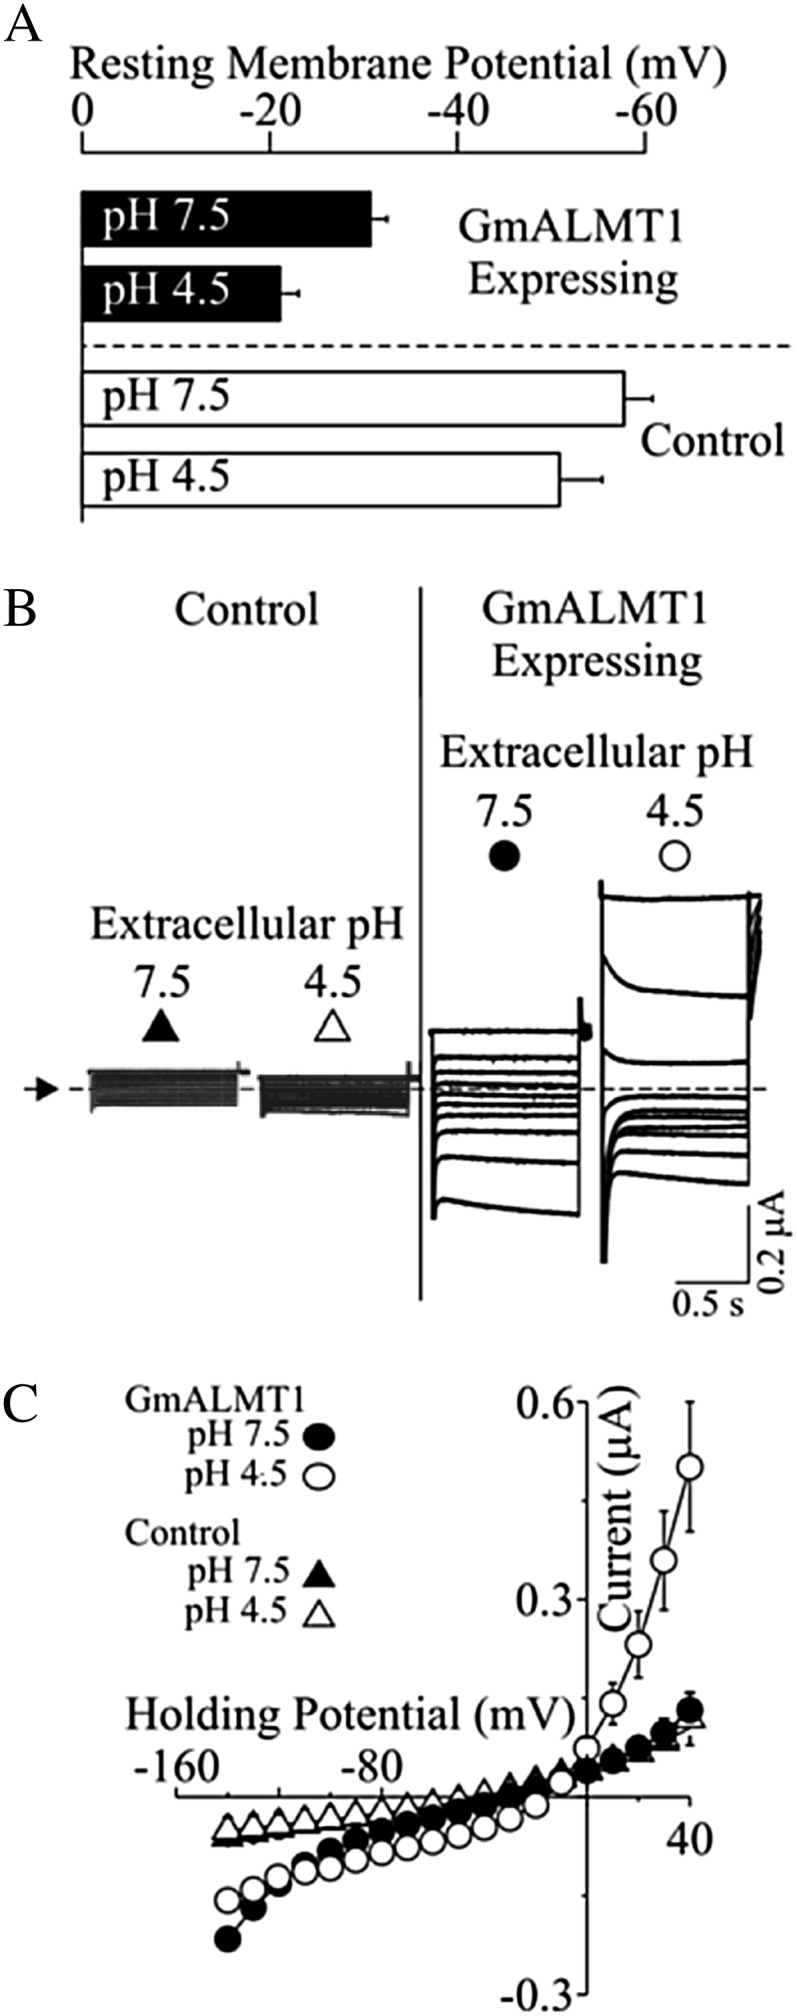
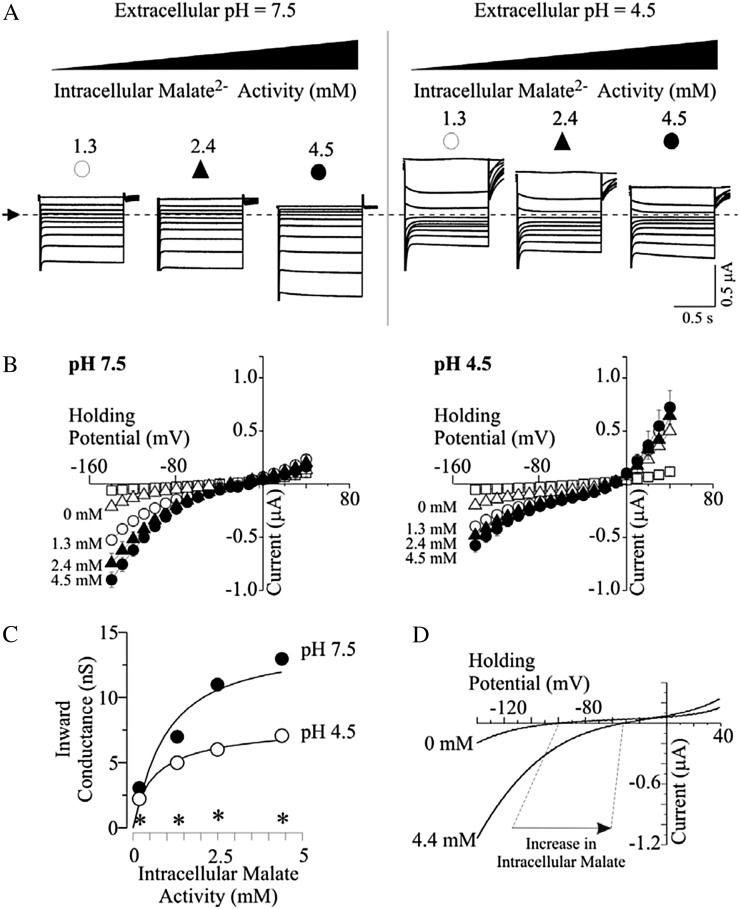
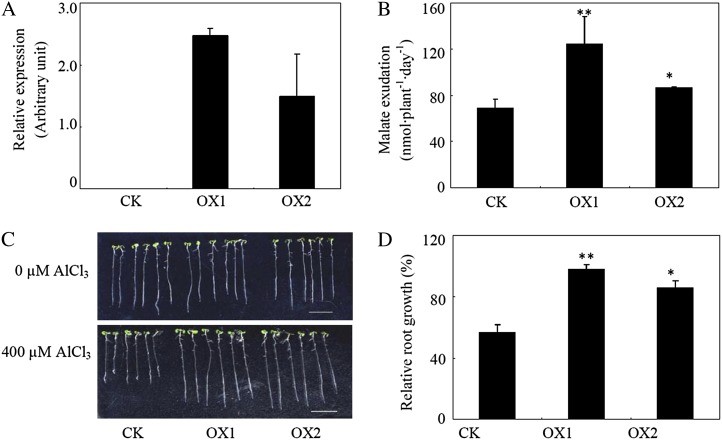
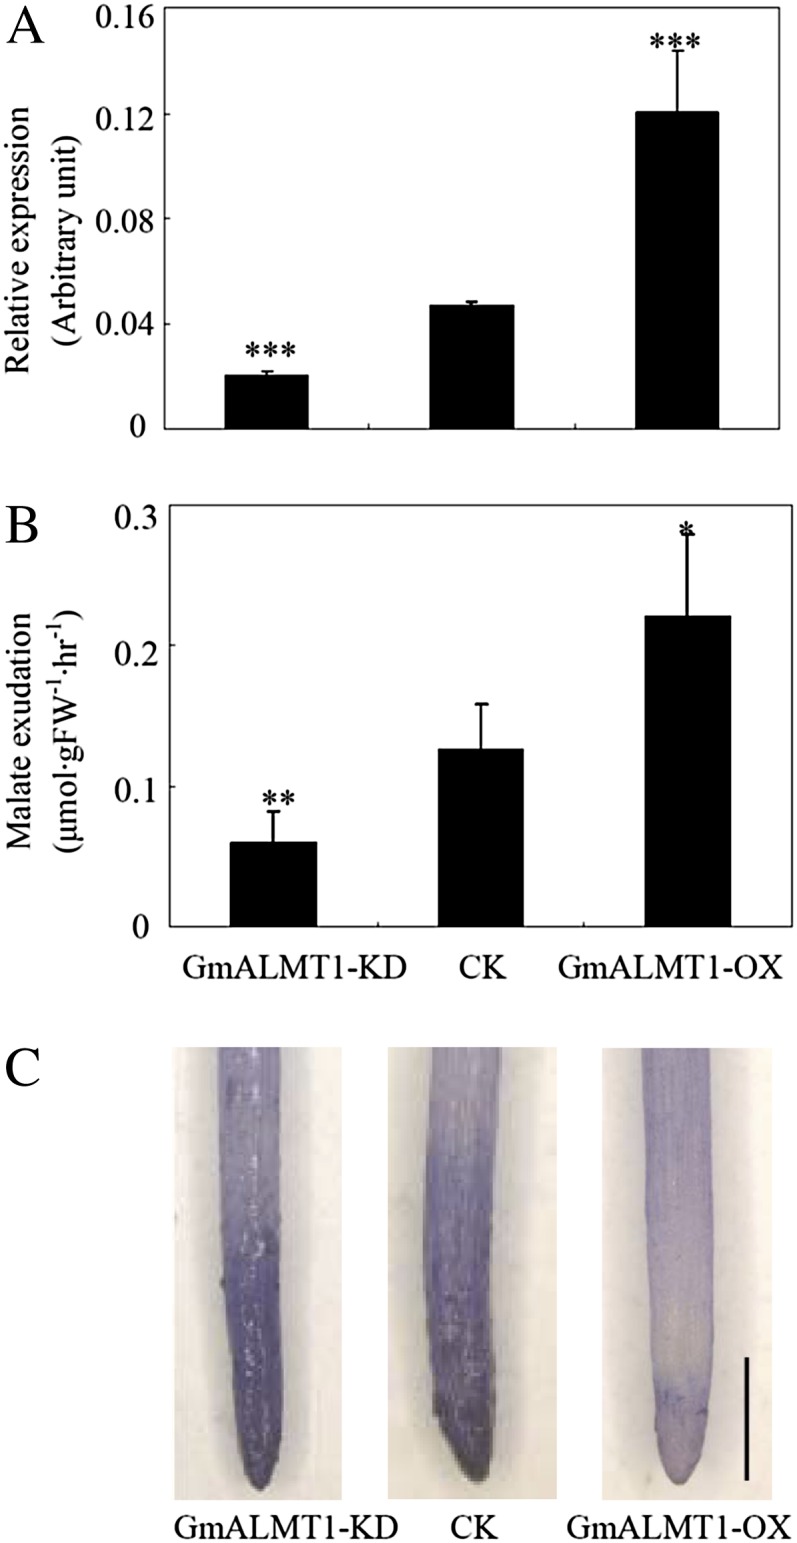
Low pH, aluminum (Al) toxicity, and low phosphorus (P) often coexist and are heterogeneously distributed in acid soils. To date, the underlying mechanisms of crop adaptation to these multiple factors on acid soils remain poorly understood. In this study, we found that P addition to acid soils could stimulate Al tolerance, especially for the P-efficient genotype HN89. Subsequent hydroponic studies demonstrated that solution pH, Al, and P levels coordinately altered soybean (Glycine max) root growth and malate exudation. Interestingly, HN89 released more malate under conditions mimicking acid soils (low pH, +P, and +Al), suggesting that root malate exudation might be critical for soybean adaptation to both Al toxicity and P deficiency on acid soils. GmALMT1, a soybean malate transporter gene, was cloned from the Al-treated root tips of HN89. Like root malate exudation, GmALMT1 expression was also pH dependent, being suppressed by low pH but enhanced by Al plus P addition in roots of HN89. Quantitative real-time PCR, transient expression of a GmALMT1-yellow fluorescent protein chimera in Arabidopsis protoplasts, and electrophysiological analysis of Xenopus laevis oocytes expressing GmALMT1 demonstrated that GmALMT1 encodes a root cell plasma membrane transporter that mediates malate efflux in an extracellular pH-dependent and Al-independent manner. Overexpression of GmALMT1 in transgenic Arabidopsis, as well as overexpression and knockdown of GmALMT1 in transgenic soybean hairy roots, indicated that GmALMT1-mediated root malate efflux does underlie soybean Al tolerance. Taken together, our results suggest that malate exudation is an important component of soybean adaptation to acid soils and is coordinately regulated by three factors, pH, Al, and P, through the regulation of GmALMT1 expression and GmALMT1 function.


Figures

Figure 1.
Figure 1.
Total root length (A) and total plant dry weight (B) for the P-efficient (HN89) and P-inefficient (HN112) soybean genotypes grown on acid soils with two different P applications. Plants were grown on acid soils under low-P (no P added) and high-P (80 kg P2O5 ha−1 added as triple superphosphate) conditions for 60 d. Each bar represents the mean of six replicates ± se. Asterisks indicate significant differences between the two genotypes in the same treatment: *P < 0.05, ***P < 0.001.
Figure 2.
Figure 2.
Root growth was influenced by pH, Al, and P in both soybean genotypes. Al resistance was based on relative root growth calculated as the root growth under +Al conditions relative to the root growth under –Al conditions. Low-pH-based relative root growth was calculated as the root growth for plants grown on nutrient solution at pH 4.3 relative to the root growth of plants grown in nutrient solution at pH 5.8. P treatments (–P and +P) represent application of 0 and 320 µm KH2PO4, respectively; −Al and +Al indicate application of 0 and 38 µm Al3+ activity, respectively. Each value is the mean of four replicates ± se. The asterisk indicates a significant difference between the two genotypes in the same treatment: *P < 0.05.
Figure 3.
Figure 3.
Root malate exudation (A) and malate content in root tips (B) as influenced by pH, Al, and P in both soybean genotypes. −P and +P represent application of 0 and 320 µm KH2PO4, respectively; the pH treatments are pH 4.3 and 5.8; −Al and +Al indicate application of 0 and 38 µm Al3+ activity, respectively. Each data point is the mean of four replicates ± se. Asterisks indicate significant differences between the two genotypes in the same treatment. **0.001 < P < 0.01, ***P < 0.001.
Figure 4.
Figure 4.
Expression patterns of GmALMT1 in response to low pH and Al toxicity. A, Spatial expression pattern of GmALMT1 in soybean tap roots with or without 50 μm AlCl3. B, Al dose response of GmALMT1 in root tips (0–2 cm). Seedlings were separately treated with 0, 50, and 100 μm AlCl3 for 6 h. C, Temporal expression pattern of GmALMT1 in root tips (0–2 cm) in response to a pH shift from 5.8 to 4.3, followed by the addition of Al. Seedlings were subjected to low pH (4.3) for 12 h and subsequently transferred to the same solution containing 50 μm AlCl3 for up to 24 h. Each data point is the mean of four replicates ± se.
Figure 5.
Figure 5.
GmALMT1 expression in root tips (0–2 cm) appears to be coordinately regulated by pH, Al, and P. −P and +P represent application of 0 and 320 µm KH2PO4, respectively; the pH treatments are pH 4.3 and 5.8; −Al and +Al indicate application of 0 and 38 µm Al3+ activity, respectively. Al treatments were performed for 6 h. Each data point is the mean of four replicates ± se. Asterisks indicate significant differences between the two genotypes in the same treatment: **0.001 < P < 0.01.
Figure 6.
Figure 6.
Cellular localization of the GmALMT1 protein in Arabidopsis protoplasts. The left and middle columns show representatives cells transformed with pSAT6-EYFP-C1 empty vector (as a control) and YFP::GmALMT1, respectively. Rows showing YFP fluorescence, chloroplast autofluorescence, bright-field images, as well as overlays are as indicated on the left margin. The right column shows representative images of YFP::GmALMT1-transformed cells where the plasma membrane has been stained with CellMask (third row; visible as blue fluorescence). All images are representative of three independent experiments in which 15 or more protoplasts were imaged. Bars = 20 μm.
Figure 7.
Figure 7.
Functional characterization of GmALMT1 expressed in X. laevis oocytes. A, Resting membrane potentials of GmALMT1-expressing and control cells measured in standard bath solution at pH 7.5 and 4.5. B, Example of GmALMT1-mediated currents (right panels) elicited in response to holding potentials ranging from +40 to −140 mV (in 20-mV increments) in standard bath solution at pH 7.5 and 4.5. The voltage was held at +40 mV for 10 s between voltage pulses. Currents recorded in control cells (i.e. not injected with cRNA) are shown for reference at left. The dotted line and arrow on the left margin indicate the zero-current level. C, Mean current-voltage curves constructed from the steady-state current recordings such as those shown in B for holding potentials ranging from +40 to −140 mV in 10-mV steps. The symbols correspond to those depicted above the example traces in B.
Figure 8.
Figure 8.
Effects of intracellular malate activities and extracellular pH on GmALMT1-mediated currents expressed in X. laevis oocytes. Two to 3 h prior to the electrophysiological measurements, cells were preloaded with 50 nL of sodium-malate solution (pH 7.2), resulting in internal malate free activities ranging from 0 to 4.5 mm. A, Example of GmALMT1-mediated currents elicited in response to the voltage protocol described in Figure 7B, as extracellular pH (7.5, left panel; 4.5, right panel) and {mal2−}i (denoted on the top of each set of traces) were varied. The dotted line and arrow on the left margin indicates the zero-current level. B, Mean current-voltage curves constructed from the steady-state current recordings such as those shown in A for GmALMT1-expressing cells at various {mal2−}i in standard bath solutions at pH 7.5 (left panel) and 4.5 (right panel). The symbols correspond to those depicted above the example traces in A. Values for control cells (white squares) and GmALMT1 cells not preloaded with malate (white triangles) correspond to those shown in Figure 7. C, Analysis of GmALMT1-mediated inward conductances in response to changes in extracellular pH and increasing {mal2−}i. The inward conductances were estimated by the linear regression of the current at the four most negative potentials. The curves were drawn according to the Hill equation: G = Gmax × [(mali)n/[(mali)n]+ Kn], where (mali) stands for the internal malate activity, Gmax is the maximum conductance, and K is the internal malate activity where the conductance reaches one-half of its maximum value. Best fit resulted in K = 0.9 ± 0.2 mm, Gmax = 14 ± 1 nS, and n = 1.1 ± 0.32 (r2 = 0.934) at pH 7.5 and K = 0.6 ± 0.1 mm, Gmax = 8 ± 1 nS, and n = 0.87 ± 0.11 (r2 = 0.988) at pH 4.5. The inward slope conductance for control cells at pH 4.5 is indicated by the asterisks. D, The increase in the magnitude of the GmALMT1-mediated inward current upon increasing intracellular malate is concurrent with a positive shift in the reversal potential (Erev; noted by the dashed lines). Whole-cell currents were elicited by a voltage ramp protocol from −140 to + 40 mV (0.9-s duration), from a holding potential of +40 mV, in standard bath solution (pH 7.5). The currents shown are representative of those obtained in ramp trials of cells (n = 5) not loaded (0 mm) or preloaded (n = 6) with malate ({mal2−}i = 4.5 mm), as indicated next to each ramp.
Figure 9.
Figure 9.
Al tolerance is enhanced by heterologous expression of GmALMT in transgenic Arabidopsis plants. A, GmALMT1 expression in the two transgenic lines (OX1 and OX2) and a control line (CK). B, Malate exudation of transgenic Arabidopsis and control plants under low-pH conditions. C, Root growth performance. D, Relative root growth of the plants subjected to 400 µm Al for 2 d. All the data represent means of four replicates ± se. Asterisks indicate significant differences from the control: *P < 0.05, **0.001 < P < 0.01.
Figure 10.
Figure 10.
GmALMT1 expression (A), malate exudation (B), and Al tolerance (C) of the composite soybean transgenic hairy roots under low-pH (pH 4.3) conditions. Root malate exudation was measured after the roots were exposed to 4.3 mm CaCl2 (pH 4.3) for 6 h. Root tips stained with the Al stain, hematoxylin, was used as an indicator of Al tolerance. GmALMT1-KD and GmALMT1-OX represent GmALMT1 RNA interference and overexpression lines, respectively. The lines transformed with empty vector were used as controls (CK). FW, Fresh weight. All the data are means of four biological replicates ± se. Asterisks indicate significant differences: *P < 0.05, **0.001 < P < 0.01, ***P < 0.001. Bar = 1 mm.

Similar articles

Cited by

References

    1. Ackerman MJ, Wickman KD, Clapham DE. (1994) Hypotonicity activates a native chloride current in Xenopus oocytes. J Gen Physiol 103: 153–179 - PMC - PubMed
    1. Archambault DJ, Zhang GC, Taylor GJ. (1997) Spatial variation in the kinetics of aluminium (Al) uptake in roots of wheat (Triticum aestivum L.) exhibiting differential resistance to Al: evidence for metabolism dependent exclusion of Al. J Plant Physiol 151: 668–674
    1. Basu U, Good AG, Aung T, Slaski J, Basu A, Briggs KG, Taylor GJ. (1999) A 23-kDa root exudates polypeptide co-segregates with aluminum resistance in Triticum aestivum. Physiol Plant 106: 53–61
    1. Bertin C, Yang X, Weston L. (2003) The role of root exudates and allelo chemicals in the rhizosphere. Plant Soil 256: 67–83
    1. Cranados G, Pandey S, Ceballos H. (1992) Response to selection for tolerance to acid soils in a tropical maize population. Crop Sci 33: 936–940

Publication types

MeSH terms

LinkOut - more resources