Differentiation of CD133+ stem cells from amyotrophic lateral sclerosis patients into preneuron cells
- PMID: 23341441
- PMCID: PMC3659759
- DOI: 10.5966/sctm.2012-0077
Differentiation of CD133+ stem cells from amyotrophic lateral sclerosis patients into preneuron cells
Abstract
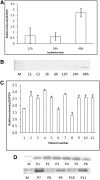
Improvements in quality of life and life expectancy have been observed in amyotrophic lateral sclerosis (ALS) patients transplanted with CD133(+) stem cells into their frontal motor cortices. However, questions have emerged about the capacity of cells from these patients to engraft and differentiate into neurons. The objective of this work was to evaluate the in vitro capacity of CD133(+) stem cells from 13 ALS patients to differentiate into neuron lineage. Stem cells were obtained through leukapheresis and cultured in a control medium or a neuroinduction medium for 2-48 hours. Expression of neuronal genes was analyzed by reverse transcription polymerase chain reaction (RT-PCR) and immunohistochemical techniques. Fluorescence microscopy demonstrated that CD133(+) stem cells from ALS patients incubated for 48 hours in a neuroinduction medium increased the detection of neuronal proteins such as nestin, β-tubulin III, neuronal-specific enolase, and glial fibrillary acidic protein. RT-PCR assays demonstrated an increase in the expression of β-tubulin III, nestin, Olig2, Islet-1, Hb9, and Nkx6.1. No correlation was found between age, sex, or ALS functional scale and the CD133(+) stem cell response to the neuroinduction medium. We conclude that CD133(+) stem cells from ALS patients, like the stem cells of healthy subjects, are capable of differentiating into preneuron cells.
Figures


Similar articles
-
Expression of neural stem cell surface marker CD133 in balloon cells of human focal cortical dysplasia.Epilepsia. 2005 Nov;46(11):1716-23. doi: 10.1111/j.1528-1167.2005.00276.x. Epilepsia. 2005. PMID: 16302851
-
Stable expression of FoxA1 promotes pluripotent P19 embryonal carcinoma cells to be neural stem-like cells.Gene Expr. 2012;15(4):153-62. doi: 10.3727/105221612x13372578119571. Gene Expr. 2012. PMID: 22783724 Free PMC article.
-
Stem-cell transplantation into the frontal motor cortex in amyotrophic lateral sclerosis patients.Cytotherapy. 2009;11(1):26-34. doi: 10.1080/14653240802644651. Cytotherapy. 2009. PMID: 19191058 Clinical Trial.
-
CD133 expression and identification of CD133/nestin positive cells in rhabdomyosarcomas and rhabdomyosarcoma cell lines.Anal Cell Pathol (Amst). 2011;34(6):303-18. doi: 10.3233/ACP-2011-0018. Anal Cell Pathol (Amst). 2011. PMID: 22156015 Free PMC article.
-
[Isolation and characterization of brain tumor stem cells in human medulloblastoma].Ai Zheng. 2006 Feb;25(2):241-6. Ai Zheng. 2006. PMID: 16480595 Chinese.
Cited by
-
NKX6.1 transcription factor: a crucial regulator of pancreatic β cell development, identity, and proliferation.Stem Cell Res Ther. 2020 Oct 29;11(1):459. doi: 10.1186/s13287-020-01977-0. Stem Cell Res Ther. 2020. PMID: 33121533 Free PMC article. Review.
-
Concise review: Stem cell therapies for amyotrophic lateral sclerosis: recent advances and prospects for the future.Stem Cells. 2014 May;32(5):1099-109. doi: 10.1002/stem.1628. Stem Cells. 2014. PMID: 24448926 Free PMC article. Review.
-
Motor Neuron Transdifferentiation of Neural Stem Cell from Adipose-Derived Stem Cell Characterized by Differential Gene Expression.Cell Mol Neurobiol. 2017 Mar;37(2):275-289. doi: 10.1007/s10571-016-0368-x. Epub 2016 Apr 23. Cell Mol Neurobiol. 2017. PMID: 27107758 Free PMC article.
-
Comparing stemness gene expression between stem cell subpopulations from peripheral blood and adipose tissue.Am J Stem Cells. 2018 Jun 1;7(2):38-47. eCollection 2018. Am J Stem Cells. 2018. PMID: 29938124 Free PMC article.
-
Potential therapeutic drugs and methods for the treatment of amyotrophic lateral sclerosis.Curr Med Chem. 2014;21(31):3583-93. doi: 10.2174/0929867321666140601162710. Curr Med Chem. 2014. PMID: 24934355 Free PMC article.
References
-
- Ringel SP, Murphy JR, Alderson MK, et al. The natural history of amyotrophic lateral sclerosis. Neurology. 1993;43:1316–1322. - PubMed
-
- Mills KR. The natural history of central motor abnormalities in amyotrophic lateral sclerosis. Brain. 2003;126:2558–2566. - PubMed
-
- Stambler N, Charatan M, Cedarbaum JM. Prognostic indicators of survival in ALS. ALS CNTF Treatment Study Group. Neurology. 1998;50:66–72. - PubMed
-
- Zoccolella S, Begh E, Palagano G, et al. Analysis of survival and prognostic factors in amyotrophic lateral sclerosis: A population based study. J Neurol Neurosurg Psychiatry. 2008;79:33–37. - PubMed
-
- Martínez HR, Molina-Lopez JF, Cantu-Martinez L, et al. Survival and clinical features in Hispanic amyotrophic lateral sclerosis patients. Amyotroph Lateral Scler. 2011;12:199–205. - PubMed
Publication types
MeSH terms
Substances
LinkOut - more resources
Full Text Sources
Other Literature Sources
Medical
Research Materials
Miscellaneous

