. 2013 Mar 28;121(13):2483-93.
doi: 10.1182/blood-2012-12-471201. Epub 2013 Jan 22.

Glucose metabolism impacts the spatiotemporal onset and magnitude of HSC induction in vivo

Affiliations

Glucose metabolism impacts the spatiotemporal onset and magnitude of HSC induction in vivo

James M Harris et al. Blood. .

Abstract

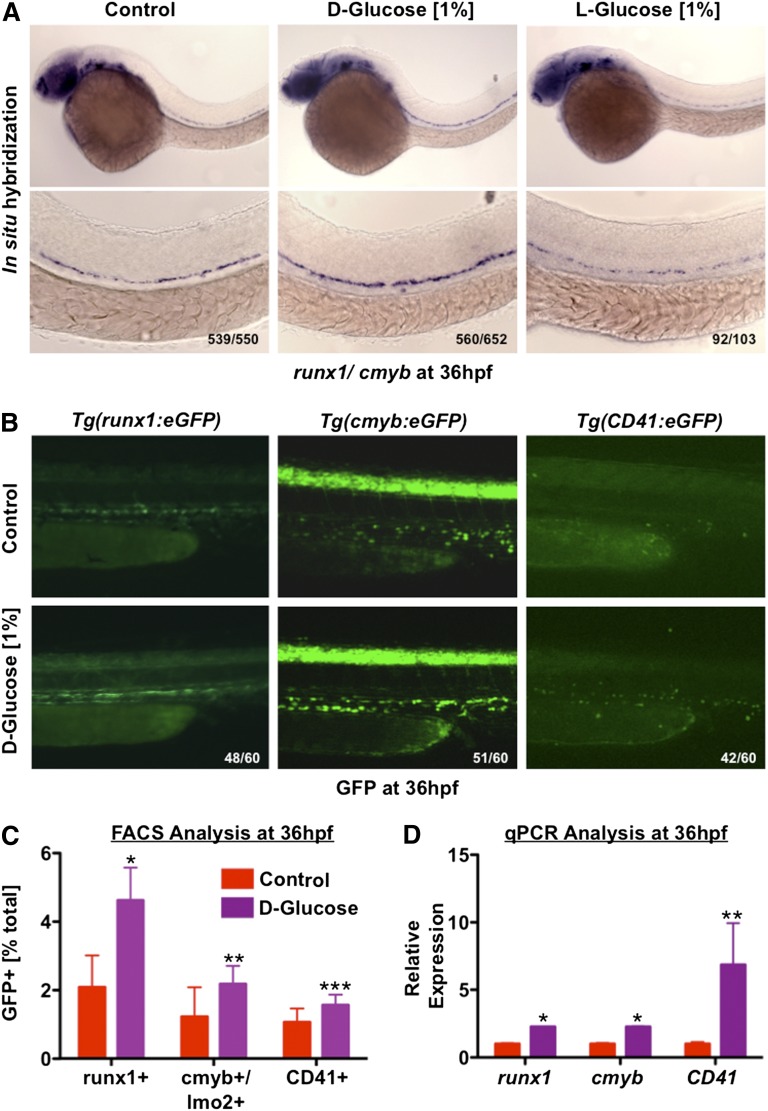
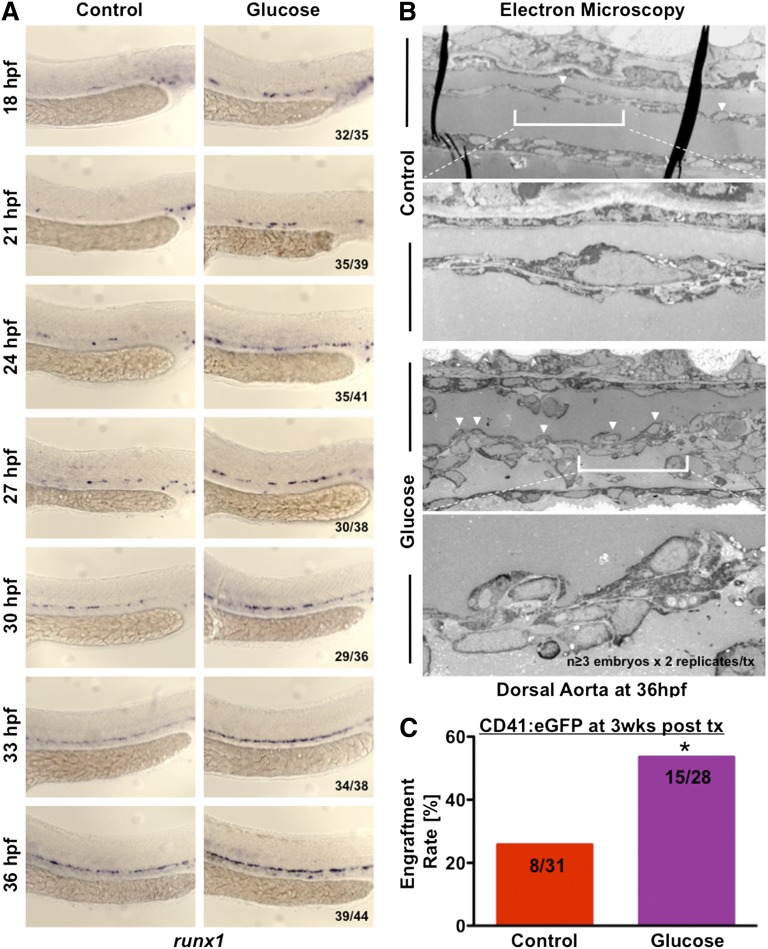
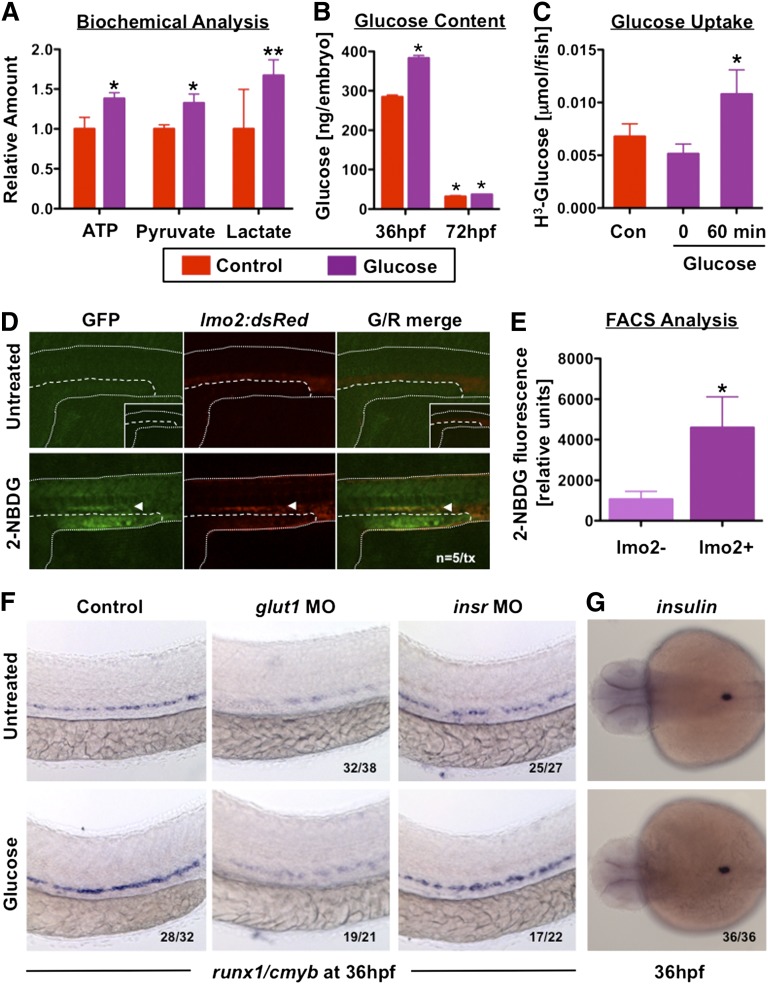
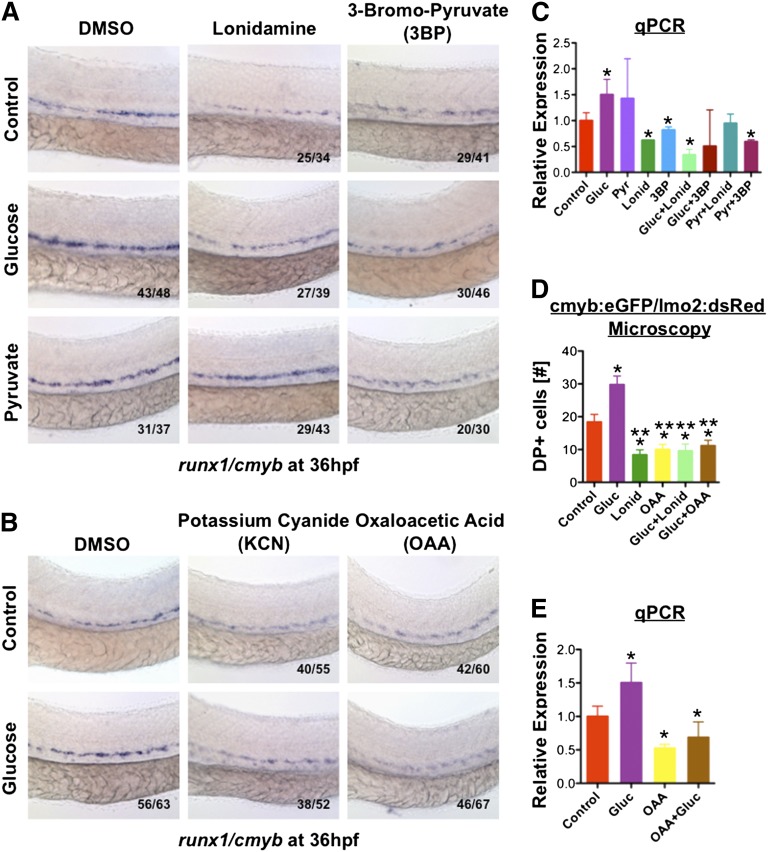
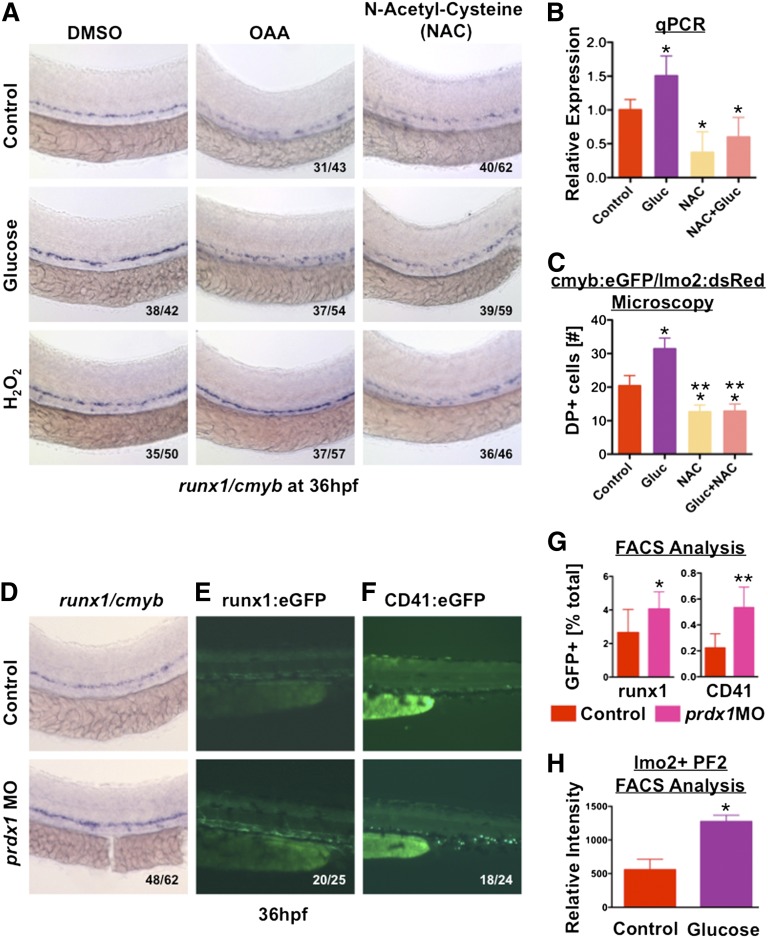
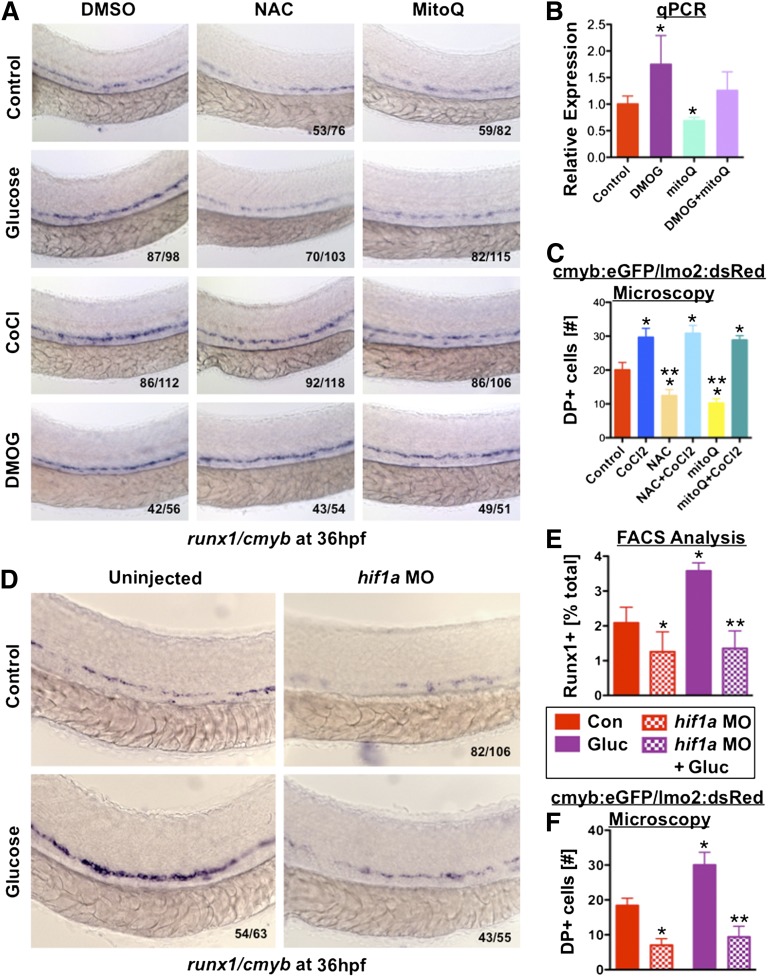
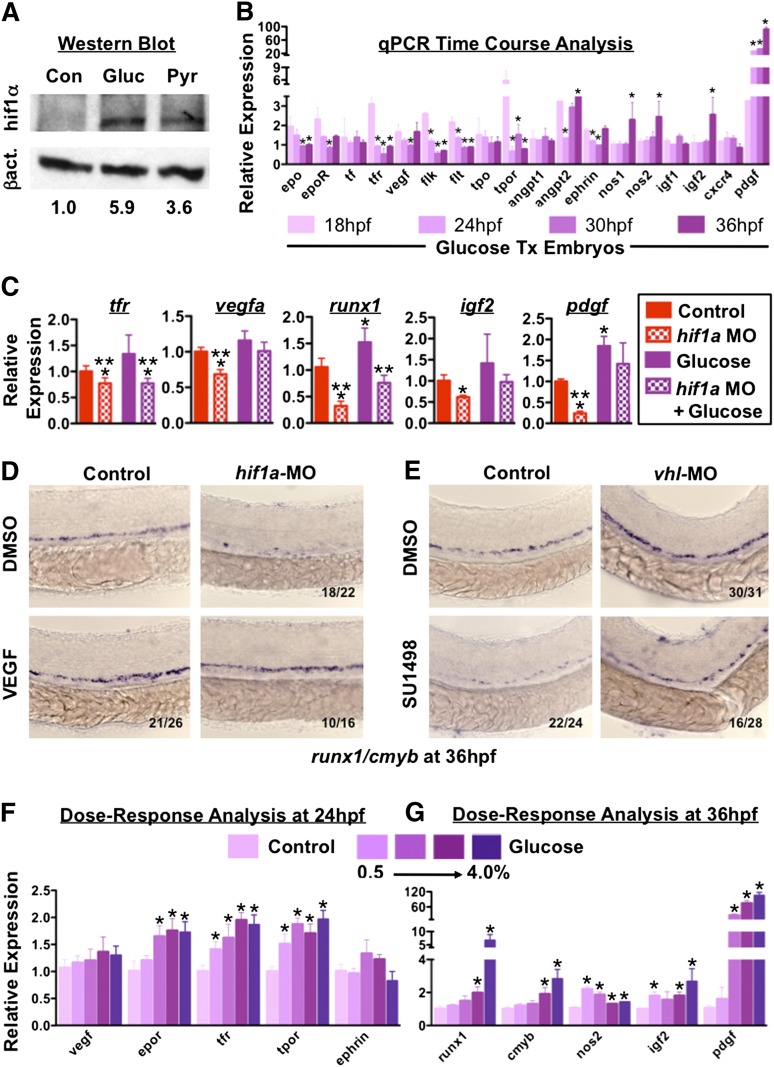
Many pathways regulating blood formation have been elucidated, yet how each coordinates with embryonic biophysiology to modulate the spatiotemporal production of hematopoietic stem cells (HSCs) is currently unresolved. Here, we report that glucose metabolism impacts the onset and magnitude of HSC induction in vivo. In zebrafish, transient elevations in physiological glucose levels elicited dose-dependent effects on HSC development, including enhanced runx1 expression and hematopoietic cluster formation in the aorta-gonad-mesonephros region; embryonic-to-adult transplantation studies confirmed glucose increased functional HSCs. Glucose uptake was required to mediate the enhancement in HSC development; likewise, metabolic inhibitors diminished nascent HSC production and reversed glucose-mediated effects on HSCs. Increased glucose metabolism preferentially impacted hematopoietic and vascular targets, as determined by gene expression analysis, through mitochondrial-derived reactive oxygen species (ROS)-mediated stimulation of hypoxia-inducible factor 1α (hif1α). Epistasis assays demonstrated that hif1α regulates HSC formation in vivo and mediates the dose-dependent effects of glucose metabolism on the timing and magnitude of HSC production. We propose that this fundamental metabolic-sensing mechanism enables the embryo to respond to changes in environmental energy input and adjust hematopoietic output to maintain embryonic growth and ensure viability.


Figures

Figure 1
Figure 1
Glucose enhances HSC formation in the zebrafish AGM region. Zebrafish were exposed to 1% glucose from 10 somites to 36 hpf and analyzed at 36 hpf. (A) D-glucose enhanced runx1/cmyb expression by in situ hybridization (560 increased/652 scored [85.9%↑]). The metabolically inactive enantiomer, L-glucose, had no effect (n > 100 embryos/treatment [tx]). Top panels show whole embryos, while bottom panels depict AGM regions. Numbers in lower right of panels, here and following, indicate embryos with altered HSC expression (as depicted) over the total number scored. (B) Glucose exposure increased HSC number as determined by in vivo fluorescent microscopy of runx1:eGFP, cmyb:eGFP, and CD41:eGFP transgenic reporter embryos (n = 60/tx). (C) Quantification of fluorescent cell number by FACS analysis of reporter embryos supported the effects of observed by microscopy (t test, runx1: *P < .0001; cmyb/lmo2: **P < .05; CD41: ***P < .01, n = 6-9). (D) qPCR confirmed significantly enhanced expression of HSC markers following glucose exposure (20 embryos/cohort, t test, runx1, cmyb: *P < .0001; CD41: **P < .05, n = 3).
Figure 2
Figure 2
Glucose accelerates the onset and output of definitive hematopoiesis in the AGM. (A) Time-course analysis by in situ hybridization for runx1 in 3-hour intervals from 18 to 36 hpf revealed earlier and enhanced expression after glucose exposure (n ≥ 35/tx). (B) Electron microscopy of sagittal sections of embryos at 36 hpf revealed increased budding (arrowheads) of hemogenic endothelial cells (HSCs) from the ventral wall of the dorsal aorta (magnification: ×1200, top panels; ×10 000, bottom panels). (C) Transplantation of AGM cells from glucose-exposed CD41:eGFP embryos into irradiated adult WT recipients led to increased engraftment, as indicated by the fraction of recipients containing GFP+ cells by fluorescence microscopy 3 weeks after transplantation (t test, *P < .05, n = 28-31).
Figure 3
Figure 3
The effect of glucose is dependent on uptake rather than insulin signaling. (A) Levels of ATP, pyruvate, and lactate in whole-embryo lysates increased significantly in response to glucose (t test, ATP, pyruvate: *P < .02; lactate: **P < .05, n = 3). (B) Measurement of total embryo glucose content by enzymatic assay revealed significantly elevated glucose levels at 36 hpf after exposure to 1% glucose in the fish water from 12 to 36 hpf, which declined back to baseline by 72 hpf (analysis of variance [ANOVA], *P < .05, n = 3). (C) Glucose uptake, measured by radioisotope labeling, was significantly enhanced in the embryo after 60 minutes of exposure in the fish water (ANOVA, P = .012, n = 3). (D) Confocal microscopy of lmo2:dsRed transgenic reporter embryos at 36 hpf following exposure to 2-NBDG reveals green fluorescent glucose signal in the zebrafish aorta (arrowhead), colocalized with an increased number of lmo2+ hematopoietic cells; white dotted lines indicate the trunk of the embryo, the dashed line demarks the yolk (below) from the embryo proper (above). The inset shows GFP levels in untreated fish at the same signal amplification as 2-NBDG–treated samples (n = 5/tx). (E) FACS analysis reveals significant and selective uptake of the fluorescent glucose analog 2-NBDG (green fluorescence) by hematopoietic and endothelial lmo2+ cells (t test, *P < .05, n = 10). (F) MO knockdown of glut1 (40μM) inhibited the effect of glucose on runx1/cmyb+ HSCs. insr (40μM) knockdown did not affect runx1/cmyb expression in the presence or absence of glucose (17 normal/22). (G) Glucose exposure did not affect insulin expression prior to islet formation at 36 hpf (36 normal/36).
Figure 4
Figure 4
Glucose levels influence HSC formation via increased energy metabolism. (A) Hexokinase inhibitors lonidamine (lonid; 10μM) and 3BP (20μM) decreased runx1/cymb staining and eliminated the effect of glucose on HSCs; addition of pyruvate (pyr; 1%) rescued the block in HSC formation elicited by lonid, but not 3BP, which inhibits both glycolysis and oxidative phosphorylation (n ≥ 30/tx). (B) Treatment with electron transport chain inhibitors potassium cyanide (KCN) (100μM) and OAA (50μM) decreased HSC gene expression and blocked the effect of glucose (n ≥ 50/tx). (C) Quantitative analysis of runx1 expression confirms the impact of hexokinase inhibition on mitigating the effect of glucose on HSCs (ANOVA, P < .05, n = 3). (D) Quantitative analysis of double-positive (DP) cells in the AGM by fluorescence microscopy of cmyb:eGFP;lmo2:dsRed transgenic embryos confirms the observed inhibitory effects of lonid and OAA in vivo (t test, *P < .01 vs con, **P < .001 vs gluc, n = 5). (E) The ability of OAA to eliminate the impact of glucose on runx1 expression was corroborated by qPCR (ANOVA, *P < .05, n = 3).
Figure 5
Figure 5
ROS produced by mitochondrial activity cause HSC expansion. (A) Treatment with the antioxidant NAC (10μM) reduced HSC formation and blocked the effect of glucose. Addition of exogenous hydrogen peroxide (0.05% H2O2) rescued HSC formation in OAA-treated embryos (n > 40/tx). (B) qPCR for runx1 expression confirmed the inhibitory impact of NAC exposure (ANOVA, P < .05, n = 3). (C) Quantitative analysis of double-positive (DP) cells in the AGM of cmyb:eGFP;lmo2:dsRed transgenic embryos by fluorescence microscopy confirms the inhibitory impact of NAC on HSC formation in vivo (t test, *P < .02 vs con, **P < .001 vs gluc, n = 5). (D-F) Morpholino knockdown of the endogenous metabolic antioxidant enzyme, peroxiredoxin (prdx1, 25μM) increased HSC formation as determined by (D) runx1/cmyb in situ hybridization, and observed in (E) runx1:eGFP and (F) CD41:eGFP transgenic zebrafish (n > 20/tx). (G) Quantification of runx1:eGFP and CD41:eGFP+ cells in prdx1 morphants by FACS revealed significant changes compared with controls (runx1: control 2.65% ± 1.38%; prdx1 MO 4.06% ± 1.02%, t test, *P = .023, n ≥ 9; CD41: control 0.22 ± 0.11%; prdx1 MO 0.533 ± 0.16%; t test, **P < .001, n = 10). (H) PF2 fluorescence intensity quantified by FACS in lmo2:dsRed endothelial cells revealed significantly increased ROS production after 1% glucose exposure (t test, *P < .0001, n = 4).
Figure 6
Figure 6
Hif1α activity induced by elevated ROS mediates the effect of glucose metabolism on HSCs. (A) Exposure to CoCl2 (500μM) or the hif1α prolyl hydroxylase inhibitor DMOG (500μM) expanded runx1/cmyb expression and rescued the impairment of HSC formation induced by antioxidants NAC and mitoQ (n > 50/tx). (B) qPCR demonstrated the effect of DMOG in enhancing runx1 expression and rescuing the effect of mitoQ exposure on HSCs (ANOVA, *P < .05, n = 3). (C) Fluorescent analysis of double-positive (DP) AGM cells in cmyb:eGFP;lmo2:dsRed transgenic embryos confirmed the positive impact of CoCl2 on HSC formation in vivo that rescued the inhibitory effects of the antioxidants NAC and mitoQ (t test, *P < .01 vs con, **P < .001 vs CoCl2, n = 5). (D) hif1a-MO knockdown decreased runx1/cmyb expression and blocked the effect of glucose on HSCs (43↓/55). (E) FACS quantification of runx1:eGFP+ cells following hif1a-MO knockdown revealed reduced HSC formation in the presence and absence of glucose (t test, *P < .001 vs con, **P < .001 vs gluc, n = 12). (F) Quantitative analysis of fluorescence microscopy images of cmyb:eGFP;lmo2:dsRed reporter embryos revealed the negative impact on HSCs of loss of hif1α function by morpholino knockdown could not be rescued by glucose exposure (t test, *P < .002 vs control, **P < .0001 vs glucose, n = 5).
Figure 7
Figure 7
Downstream targets of hif1α are temporally regulated to modulate HSC induction to match nutrient availability. (A) Western blot analysis of whole-embryo homogenates showed increased hif1α levels (top band) following exposure to glucose or pyruvate compared with untreated controls. β-actin is shown as a loading control (bottom band). Normalized quantification is below. (B) Analysis of temporal variation of gene expression from 18 to 36 hpf in glucose-treated embryos normalized pairwise to controls at each time point revealed enhanced induction of erythropoietic genes at early time points, and later induction of genes involved in definitive HSC development in response to glucose (t test vs 18 hpf, *P < .05, n = 3). (C) qPCR analysis indicated that functional hif1a is required to mediate the full effect of glucose exposure on hematopoietic-relevant targets (t test, * vs control, ** vs glucose, P < .05, n = 3). (D-E) Epistasis analysis demonstrated that (D) exogenous VEGF (10μM) could partially rescue a hif1a-MO knockdown on HSCs. (E) Elevations in runx1/cmyb expression mediated by loss of the negative hif1α regulator vhl by MO knockdown can be partially blocked if VEGF signaling is inhibited using SU1498 (10μM, n > 15/tx). (F) qPCR analysis following exposure to increasing glucose concentrations (0.5%-4%) in the fish water revealed a dose-dependent increase in genes involved in vascular and erythroid formation (ANOVA, P < .05, n = 3) at 24 hpf. (G) qPCR at 36 hpf following exposure to increasing glucose concentrations demonstrated increased expression of runx1, cmyb, and hif1α targets associated with definitive hematopoiesis (nos2, igf2, pdgf; ANOVA, P < .05, n = 3).

References

    1. Dzierzak E, Medvinsky A. The discovery of a source of adult hematopoietic cells in the embryo. Development. 2008;135(14):2343–2346. - PMC - PubMed
    1. Orkin SH, Zon LI. Hematopoiesis: an evolving paradigm for stem cell biology. Cell. 2008;132(4):631–644. - PMC - PubMed
    1. Wang Q, Stacy T, Binder M, et al. Disruption of the Cbfa2 gene causes necrosis and hemorrhaging in the central nervous system and blocks definitive hematopoiesis. Proc Natl Acad Sci U S A. 1996;93(8):3444–3449. - PMC - PubMed
    1. North TE, de Bruijn MF, Stacy T, et al. Runx1 expression marks long-term repopulating hematopoietic stem cells in the midgestation mouse embryo. Immunity. 2002;16(5):661–672. - PubMed
    1. North T, Gu TL, Stacy T, et al. Cbfa2 is required for the formation of intra-aortic hematopoietic clusters. Development. 1999;126(11):2563–2575. - PubMed

Publication types

MeSH terms

Substances