. 2013 Feb 19;110(8):3017-22.
doi: 10.1073/pnas.1212333110. Epub 2013 Jan 22.

Dependence receptor TrkC is a putative colon cancer tumor suppressor

Affiliations

Dependence receptor TrkC is a putative colon cancer tumor suppressor

Anne-Laure Genevois et al. Proc Natl Acad Sci U S A. .

Abstract

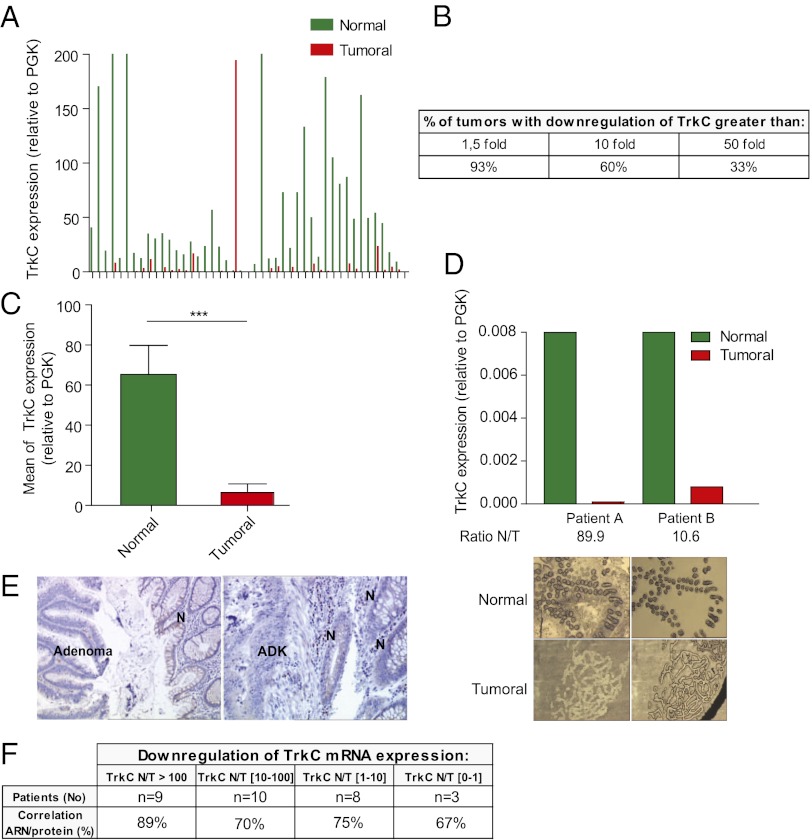
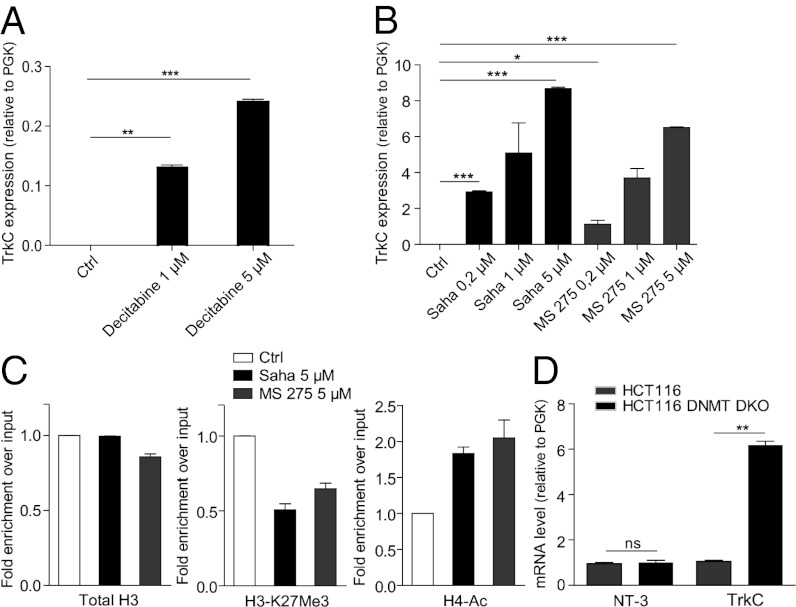
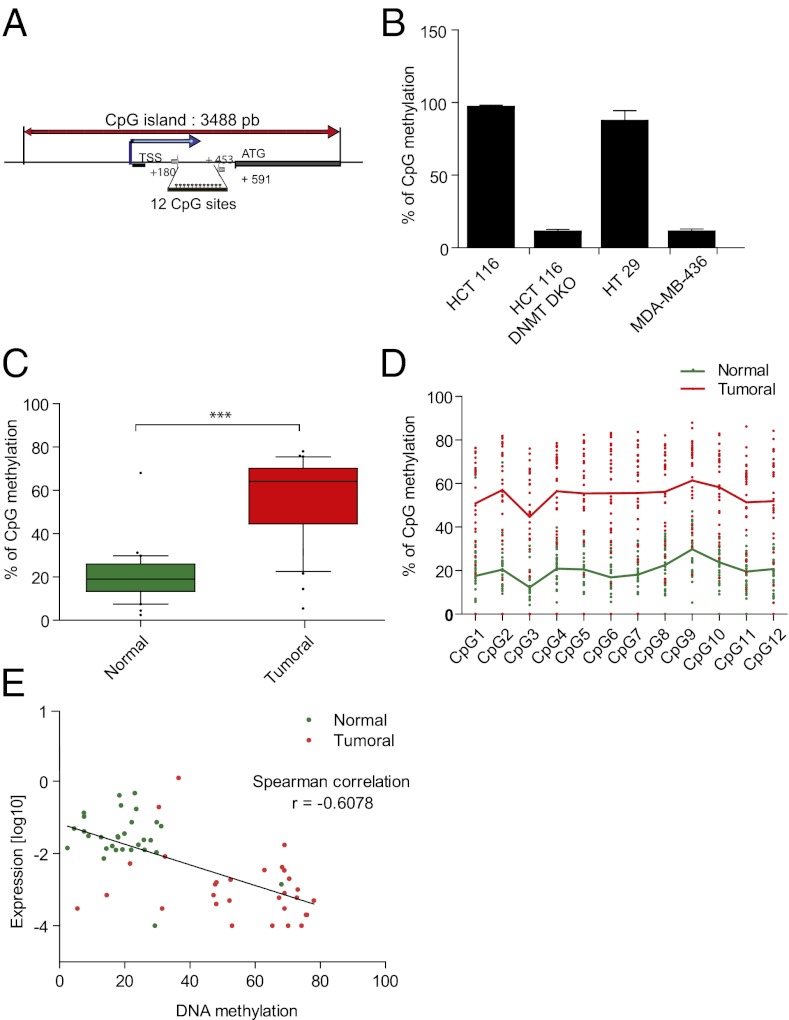
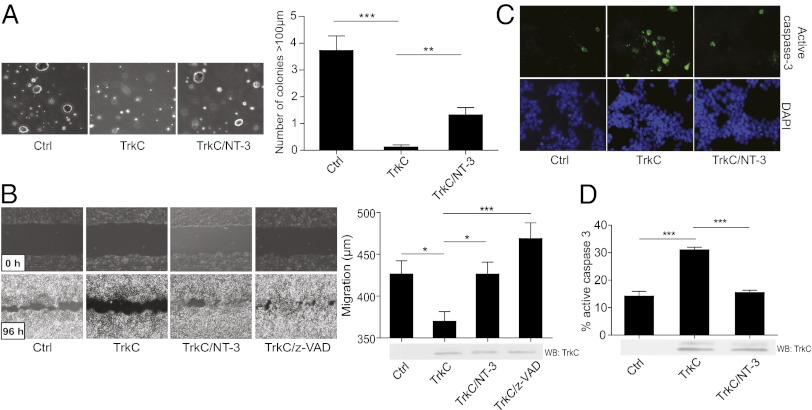
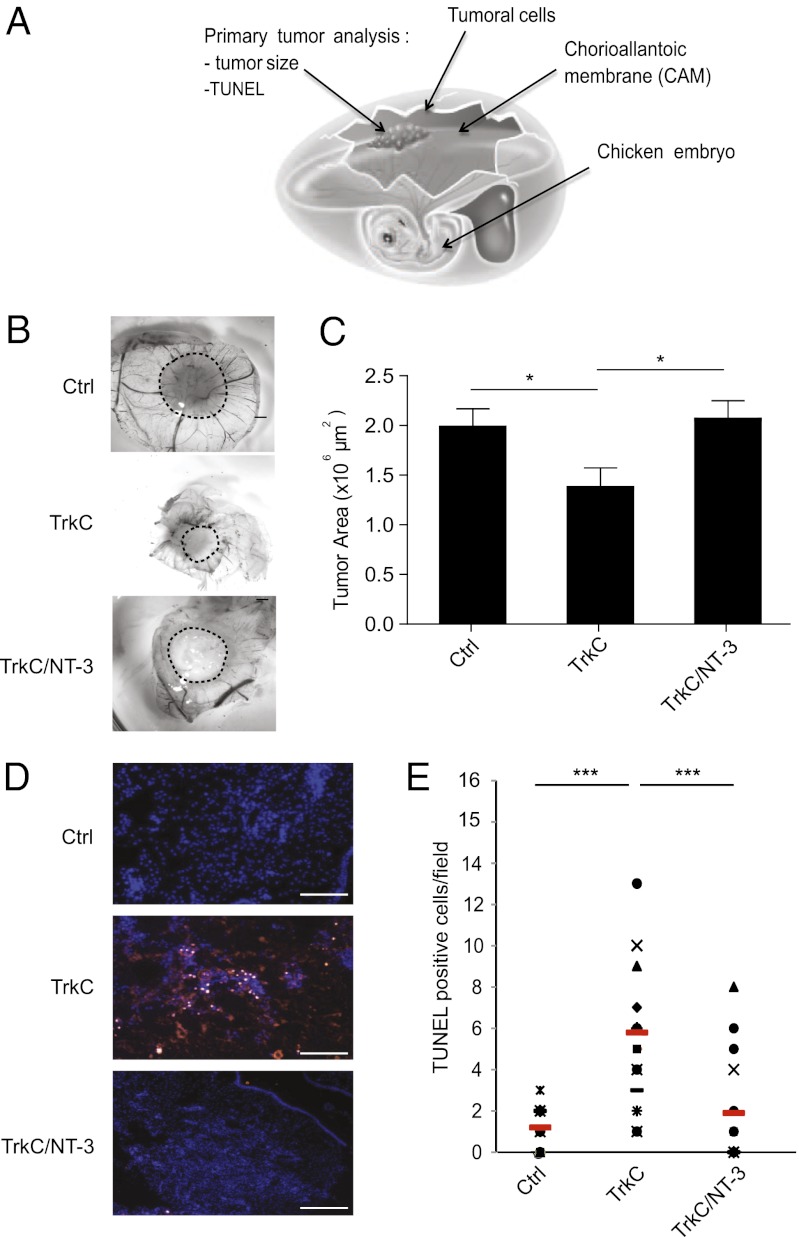
The TrkC neurotrophin receptor belongs to the functional dependence receptor family, members of which share the ability to induce apoptosis in the absence of their ligands. Such a trait has been hypothesized to confer tumor-suppressor activity. Indeed, cells that express these receptors are thought to be dependent on ligand availability for their survival, a mechanism that inhibits uncontrolled tumor cell proliferation and migration. TrkC is a classic tyrosine kinase receptor and therefore generally considered to be a proto-oncogene. We show here that TrkC expression is down-regulated in a large fraction of human colorectal cancers, mainly through promoter methylation. Moreover, we show that TrkC silencing by promoter methylation is a selective advantage for colorectal cell lines to limit tumor cell death. Furthermore, reestablished TrkC expression in colorectal cancer cell lines is associated with tumor cell death and inhibition of in vitro characteristics of cell transformation, as well as in vivo tumor growth. Finally, we provide evidence that a mutation of TrkC detected in a sporadic cancer is a loss-of-proapoptotic function mutation. Together, these data support the conclusion that TrkC is a colorectal cancer tumor suppressor.


Conflict of interest statement

The authors declare no conflict of interest.

Figures

Fig. 1.
Fig. 1.
TrkC expression is lost in colorectal tumors. (AC) Quantitative real-time RT-PCR was performed using total RNA extracted from normal (N) and tumoral (T) tissues with specific human TrkC primers. PGK showing the less variability in their expression between normal and colorectal tumoral tissues, as described previously (20), was used as housekeeping gene. (A) The expression levels in 45 colorectal tumors (Tumoral) and corresponding normal tissue (Normal) are given as a ratio between TrkC and PGK, the internal control. (B) Table indicating the percentage of patients showing a loss of TrkC expression in tumor compared with normal tissue. (C) Mean TrkC expression in tumoral tissues versus normal tissues is presented. ***P < 0.001, two-sided Mann–Whitney test, the two means being compared. (D) Laser capture microdissection (LCM) was performed on 8 pairs of tumor/normal tissues (two representative pairs being presented here), and TrkC expression was determined as in A. (Upper) The expression levels in 2 colorectal tumors (T) and corresponding normal tissue (N) are given as a ratio between TrkC and PGK. (Lower) Typical microscopic visualization of LCM on colon section from human normal (N) or tumoral biopsies (T). Sections are shown before LCM (Left) and after LCM (Right), as the captured material is confirmed under microscopic visualization before processing for RNA extraction. (E) Immunostaining of TrkC protein was performed on tissue sections isolated from biopsies of two different patients and counterstained with Mayer’s hematoxylin. N, normal tissue; ADK, adenocarcinoma. (F) Table showing the correlation between TrkC mRNA expression and TrkC protein expression determined by immunostaning in pair normal/tumor for 30 patients in the panel of 45 patients.
Fig. 2.
Fig. 2.
TrkC is re-expressed in HCT116 colorectal cancer cell line following epi-drugs treatment. (A and B) HCT116 cells were treated for 72 h with decitabine (A) or for 24 h with Saha or MS 275 (B) at the indicated concentrations. TrkC expression was measured by Q-RT-PCR, using PGK as internal control. (C) Chomatin immunoprecipitation performed on HCT116 cells treated or not with 5 μM Saha or 5 μM MS275 using the following antibodies: total H3, H3-K27Me3 (mark of transcription repression) or H4-pan-acetyl (mark of transcription activation). The experiments were done with one primers couple. Graphs show relative enrichment over input. Enrichment for control cells is set at 1 in each individual experiment. Data are the mean ± SEM of at least two independent experiments. (D) The level of TrkC and NT-3 mRNA was measured in wild-type (WT) and HCT116 cells invalidated for DNMT1 and -3B (DNMT DKO) by Q-RT-PCR.
Fig. 3.
Fig. 3.
TrkC promoter is hyper-methylated in tumoral colorectal tissue. (A) A schematic representation of TrkC promoter is shown. The main CpG island, the transcription start site (TSS), and translation starting codon (ATG) are represented. The primers used for the pyrosequencing of the 12 CpG sites indicated were located in (+180;+205) and (+453;+476). (B) Analysis by pyrosequencing of the TrkC promoter methylation in TrkC-negative cells (HCT116 WT, HT29) and in TrkC-positive cells (HCT116 DNMT DKO colorectal cell lines and MDA-MB-436 breast cell line). (C) Analysis by pyrosequencing of the TrkC promoter methylation in matched normal and tumoral colorectal tissues from 30 patients in the panel of 45 patients. Statistical analysis has been performed using two-sided Mann–Witney test. ***P < 0.001. (D) Pyrosequencing of the TrkC promoter methylation in matched normal and tumoral colorectal tissues from a single patient. A representative diagram showing the methylation level on each of the 12 CpG sites analyzed is shown. (E) Inverse correlation between the decrease of TrkC mRNA level and DNA methylation of the TrkC promoter.
Fig. 4.
Fig. 4.
Re-expression of TrkC limits the hallmarks of colorectal cancer cells transformation via apoptosis induction. (A) Control, TrkC, or both TrkC and NT-3 overexpressing HCT116 cells were grown in soft agar for two weeks. The number of colonies was counted in five random fields and the average number per field was calculated. Data represent mean ± SEM *P < 0.05, ***P < 0.001, two-sided Mann–Whitney test, compared with control. Photographs of representative colonies for each condition are shown. (B) Scratch assay was performed on HCT116 cells expressing control vector and TrkC with or without NT-3 and z-VAD-fmk addition. The scratch open area was measured at 0 h and 96 h and the migration distance was determined. Representative photographs are shown. (C and D) Control, TrkC or both TrkC and NT-3 overexpressing HCT116 cells were immunolabeled for active caspase-3. Representative photographs are shown in C. The quantification and the corresponding Western blot controlling TrkC expression level are shown in D. ***P < 0.001, two-sided Mann–Whitney test.
Fig. 5.
Fig. 5.
TrkC expression induces tumor growth inhibition in vivo. (A) Schematic representation of the experimental chick model. HCT116 cells, transiently transfected with various plasmids, were grafted in CAM at day 10. Tumors were harvested on day 17, measured, and sectioned for TUNEL staining. n = 10–15 for each condition. (B) Representative images of HCT116 primary tumors formed. HCT116 cells were either transfected with empty vector (Ctrl), TrkC and treated with NT-3 (10 ng/mL) or not, before graft. (Scale bar: 2 μm.) (C) Quantitative analysis showing the size of the respective primary tumors described in B; *P < 0.05, two-sided Mann–Whitney test. (D) Representative images of TUNEL-positive cells in sections performed on the respective primary tumors described in B. (Scale bar: 100 μm.) (E) Quantification of the TUNEL-positive cells described in D. The red bars indicate the respective mean of the various measures performed for each sample. ***P < 0.001, two-sided Mann–Whitney test.

Comment in

Similar articles

Cited by

  • Asparaginase treatment side-effects may be due to genes with homopolymeric Asn codons (Review-Hypothesis).
    Banerji J. Banerji J. Int J Mol Med. 2015 Sep;36(3):607-26. doi: 10.3892/ijmm.2015.2285. Epub 2015 Jul 15. Int J Mol Med. 2015. PMID: 26178806 Free PMC article. Review.
  • Emerging Roles of the Nervous System in Gastrointestinal Cancer Development.
    Wan C, Yan X, Hu B, Zhang X. Wan C, et al. Cancers (Basel). 2022 Jul 30;14(15):3722. doi: 10.3390/cancers14153722. Cancers (Basel). 2022. PMID: 35954387 Free PMC article. Review.
  • TrkC promotes colorectal cancer growth and metastasis.
    Kim MS, Suh KW, Hong S, Jin W. Kim MS, et al. Oncotarget. 2017 Jun 20;8(25):41319-41333. doi: 10.18632/oncotarget.17289. Oncotarget. 2017. PMID: 28455963 Free PMC article.
  • Molecular mechanisms of cell death: recommendations of the Nomenclature Committee on Cell Death 2018.
    Galluzzi L, Vitale I, Aaronson SA, Abrams JM, Adam D, Agostinis P, Alnemri ES, Altucci L, Amelio I, Andrews DW, Annicchiarico-Petruzzelli M, Antonov AV, Arama E, Baehrecke EH, Barlev NA, Bazan NG, Bernassola F, Bertrand MJM, Bianchi K, Blagosklonny MV, Blomgren K, Borner C, Boya P, Brenner C, Campanella M, Candi E, Carmona-Gutierrez D, Cecconi F, Chan FK, Chandel NS, Cheng EH, Chipuk JE, Cidlowski JA, Ciechanover A, Cohen GM, Conrad M, Cubillos-Ruiz JR, Czabotar PE, D'Angiolella V, Dawson TM, Dawson VL, De Laurenzi V, De Maria R, Debatin KM, DeBerardinis RJ, Deshmukh M, Di Daniele N, Di Virgilio F, Dixit VM, Dixon SJ, Duckett CS, Dynlacht BD, El-Deiry WS, Elrod JW, Fimia GM, Fulda S, García-Sáez AJ, Garg AD, Garrido C, Gavathiotis E, Golstein P, Gottlieb E, Green DR, Greene LA, Gronemeyer H, Gross A, Hajnoczky G, Hardwick JM, Harris IS, Hengartner MO, Hetz C, Ichijo H, Jäättelä M, Joseph B, Jost PJ, Juin PP, Kaiser WJ, Karin M, Kaufmann T, Kepp O, Kimchi A, Kitsis RN, Klionsky DJ, Knight RA, Kumar S, Lee SW, Lemasters JJ, Levine B, Linkermann A, Lipton SA, Lockshin RA, López-Otín C, Lowe SW, Luedde T, Lugli E, MacFarlane M, Madeo F, Malewicz M, Malorni W, Manic G, Marine JC, Marti… See abstract for full author list ➔ Galluzzi L, et al. Cell Death Differ. 2018 Mar;25(3):486-541. doi: 10.1038/s41418-017-0012-4. Epub 2018 Jan 23. Cell Death Differ. 2018. PMID: 29362479 Free PMC article. Review.
  • Modifying PCDH19 levels affects cortical interneuron migration.
    Pancho A, Mitsogiannis MD, Aerts T, Dalla Vecchia M, Ebert LK, Geenen L, Noterdaeme L, Vanlaer R, Stulens A, Hulpiau P, Staes K, Van Roy F, Dedecker P, Schermer B, Seuntjens E. Pancho A, et al. Front Neurosci. 2022 Oct 25;16:887478. doi: 10.3389/fnins.2022.887478. eCollection 2022. Front Neurosci. 2022. PMID: 36389226 Free PMC article.

References

    1. Martin-Zanca D, Hughes SH, Barbacid M. A human oncogene formed by the fusion of truncated tropomyosin and protein tyrosine kinase sequences. Nature. 1986;319(6056):743–748. - PubMed
    1. Nakagawara A. Trk receptor tyrosine kinases: A bridge between cancer and neural development. Cancer Lett. 2001;169(2):107–114. - PubMed
    1. Marshall JL, et al. Phase I trial of orally administered CEP-701, a novel neurotrophin receptor-linked tyrosine kinase inhibitor. Invest New Drugs. 2005;23(1):31–37. - PubMed
    1. Knapper S, et al. A phase 2 trial of the FLT3 inhibitor lestaurtinib (CEP701) as first-line treatment for older patients with acute myeloid leukemia not considered fit for intensive chemotherapy. Blood. 2006;108(10):3262–3270. - PubMed
    1. Chan E, et al. A phase I trial of CEP-701 + gemcitabine in patients with advanced adenocarcinoma of the pancreas. Invest New Drugs. 2008;26(3):241–247. - PubMed

Publication types