. 2013 Feb 5;110(6):2354-9.
doi: 10.1073/pnas.1221292110. Epub 2013 Jan 22.

Extensive changes in DNA methylation are associated with expression of mutant huntingtin

Affiliations

Extensive changes in DNA methylation are associated with expression of mutant huntingtin

Christopher W Ng et al. Proc Natl Acad Sci U S A. .

Abstract

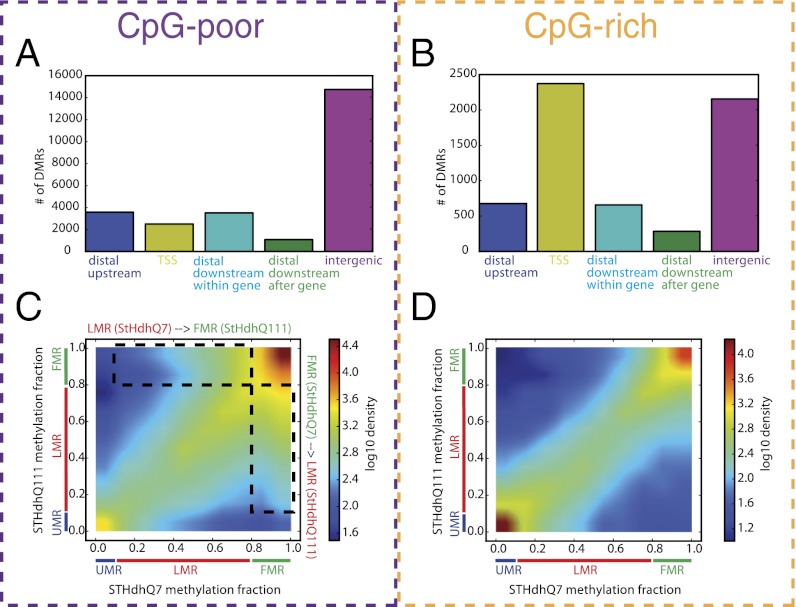
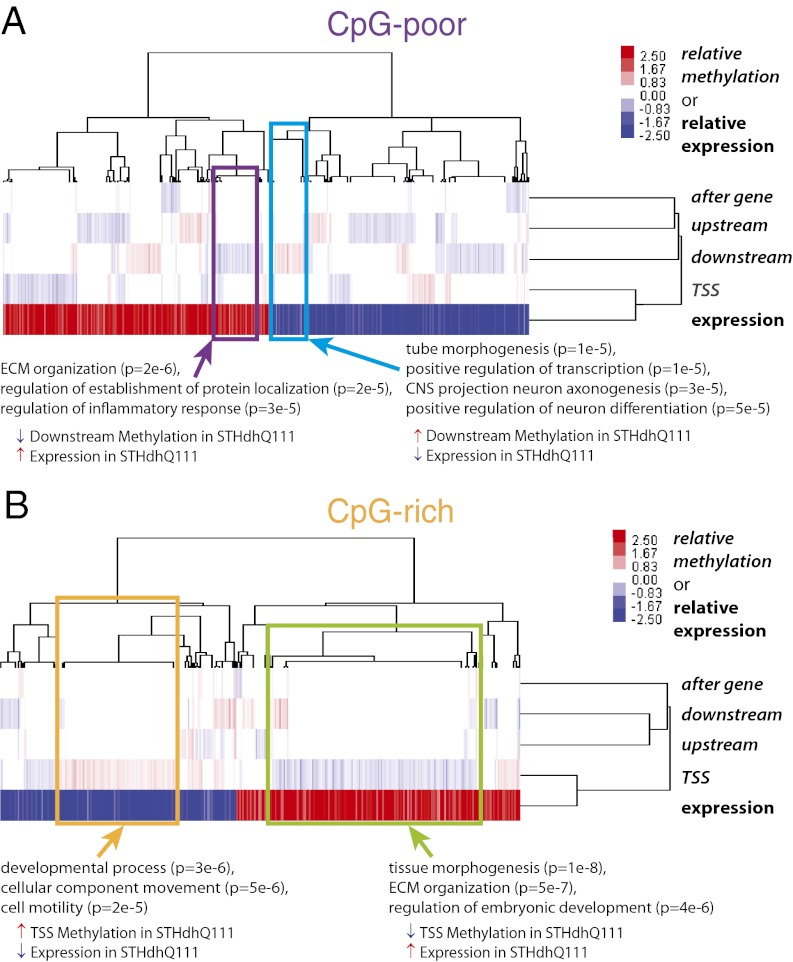
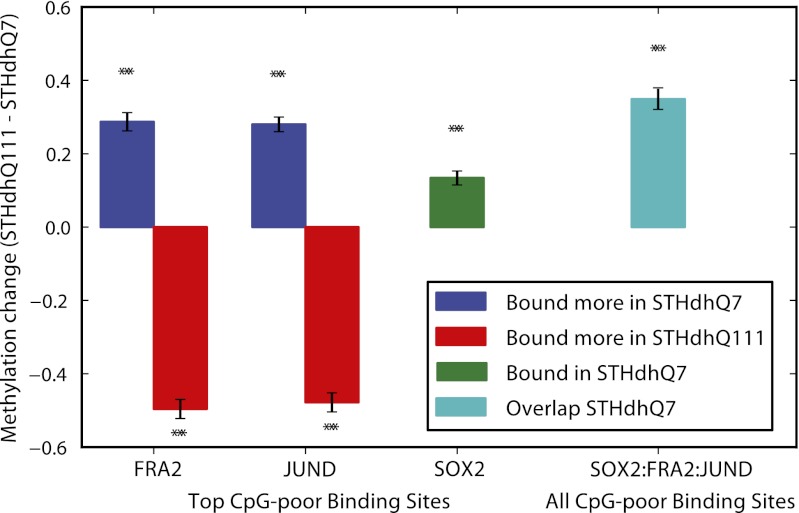
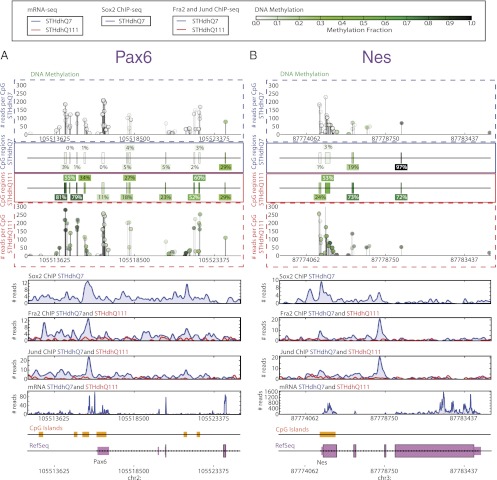
The earliest stages of Huntington disease are marked by changes in gene expression that are caused in an indirect and poorly understood manner by polyglutamine expansions in the huntingtin (HTT) protein. To explore the hypothesis that DNA methylation may be altered in cells expressing mutated HTT, we use reduced representation bisulfite sequencing (RRBS) to map sites of DNA methylation in cells carrying either wild-type or mutant HTT. We find that a large fraction of the genes that change in expression in the presence of mutant huntingtin demonstrate significant changes in DNA methylation. Regions with low CpG content, which have previously been shown to undergo methylation changes in response to neuronal activity, are disproportionately affected. On the basis of the sequence of regions that change in methylation, we identify AP-1 and SOX2 as transcriptional regulators associated with DNA methylation changes, and we confirm these hypotheses using genome-wide chromatin immunoprecipitation sequencing (ChIP-Seq). Our findings suggest new mechanisms for the effects of polyglutamine-expanded HTT. These results also raise important questions about the potential effects of changes in DNA methylation on neurogenesis and cognitive decline in patients with Huntington disease.


Conflict of interest statement

The authors declare no conflict of interest.

Figures

Fig. 1.
Fig. 1.
Characterization of differentially methylated regions. (A and B) Number of differentially methylated regions adjacent to the TSS (−2 kb to +2 kb from the TSS), upstream (−20 kb to −2 kb from the TSS), downstream within gene (+2 kb to +20 kb from the TSS and before the transcription end site), downstream after gene (+2 kb to +20 kb from the TSS and after the transcription end site), and intergenic (farther than 20 kb to closest TSS) for CpG-poor regions (A) and CpG-rich regions (B). (C and D) Comparison of the fraction of CpGs that are methylated in each region in STHdhQ7 (x axis) and STHdhQ111 (y axis). The color scale indicates the density of regions with corresponding levels of methylation (increases from blue to red). CpG-poor regions (C) and CpG-rich regions (D) are shown separately. Unmethylated regions (UMRs) are defined as regions with 0–10% methylation, low methylated regions (LMRs) as 10–80%, and fully methylated regions (FMRs) as 80–100%.
Fig. 2.
Fig. 2.
Overall relation between differential methylation and expression. Shown is hierarchical clustering of the relative levels of methylation (RRBS) and mRNA-Seq. Color indicates difference in methylation fraction for RRBS and log2 of the fold change in gene expression for mRNA-Seq . Methylation regions are broken down by their distance to the TSS as in Fig. 1. (A and B) CpG-poor regions (A) and CpG-rich regions (B). Enriched GO biological processes of select gene clusters are presented (P < 1e-4).
Fig. 3.
Fig. 3.
FRA-2, JUND, and SOX2 binding is associated with methylation changes. Regions that change in binding also change in methylation. Shown is a plot of the differences in fractional methylation between STHdhQ7 and STHdhQ111 (mean ± SEM) at CpG-poor regions within 150 bp of binding sites for FRA-2, JUND, and SOX2. FRA-2 and JUND ChIP-Seq binding sites were ranked by statistical significance of differential binding between cell lines. SOX2 data were ranked by statistical significance of binding against IgG for SOX2. (No binding data for SOX2 were collected in STHdhQ111, as the protein is not detectable in these cells.) Results are shown for the top 5,000 sites bound more in STHdhQ111 (red), the top 5,000 sites bound more in STHdhQ7 (blue) for FRA-2 and JUND, and for the top 5,000 SOX2 binding sites in STHdhQ7 (green). Sites bound by SOX2 that were also significantly bound more by both FRA-2 and JUND in STHdhQ7 relative to STHdhQ111 are shown in cyan. Asterisks indicate that the methylation change is significantly greater or less than that observed at all regions (P < 1e-14 by Mann–Whitney–Wilcoxon test).
Fig. 4.
Fig. 4.
Pax6 and Nes regulatory regions are bound less by SOX2, FRA-2, and JUND and increase in DNA methylation and the genes decrease in expression in STHdhQ111 relative to STHdhQ7. (A and B) DNA methylation (STHdhQ7 and STHdhQ111), SOX2 ChIP-Seq (STHdhQ7 only), FRA-2 ChIP-Seq (STHdhQ7 and STHdhQ111), JUND ChIP-Seq (STHdhQ7 and STHdhQ111), mRNA-Seq (STHdhQ7 and STHdhQ111), RefSeq gene annotation, and University of California, Santa Cruz (UCSC) CpG island tracks around the Pax6 (A) and Nes (B) loci. Data for DNA methylation are shown at the level of base pairs and regions (see Materials and Methods for definition of regions). The ball-and-stick plots illustrate RRBS read depth (y axis) and methylation fraction (marker color scale) at base pair resolution, whereas regions are depicted by colored boxes. For ChIP-Seq and mRNA-Seq tracks, the y axis indicates the number of reads.

Comment in

References

    1. Hodges A, et al. Regional and cellular gene expression changes in human Huntington’s disease brain. Hum Mol Genet. 2006;15(6):965–977. - PubMed
    1. Kuhn A, et al. Mutant huntingtin’s effects on striatal gene expression in mice recapitulate changes observed in human Huntington’s disease brain and do not differ with mutant huntingtin length or wild-type huntingtin dosage. Hum Mol Genet. 2007;16(15):1845–1861. - PubMed
    1. Luthi-Carter R, et al. Dysregulation of gene expression in the R6/2 model of polyglutamine disease: Parallel changes in muscle and brain. Hum Mol Genet. 2002;11(17):1911–1926. - PubMed
    1. Luthi-Carter R, et al. Decreased expression of striatal signaling genes in a mouse model of Huntington’s disease. Hum Mol Genet. 2000;9(9):1259–1271. - PubMed
    1. Trettel F, et al. Dominant phenotypes produced by the HD mutation in STHdh(Q111) striatal cells. Hum Mol Genet. 2000;9(19):2799–2809. - PubMed

Publication types

Associated data