. 2013;9(1):e1002881.
doi: 10.1371/journal.pcbi.1002881. Epub 2013 Jan 17.

Binding of nucleoid-associated protein fis to DNA is regulated by DNA breathing dynamics

Affiliations

Binding of nucleoid-associated protein fis to DNA is regulated by DNA breathing dynamics

Kristy Nowak-Lovato et al. PLoS Comput Biol. 2013.

Abstract

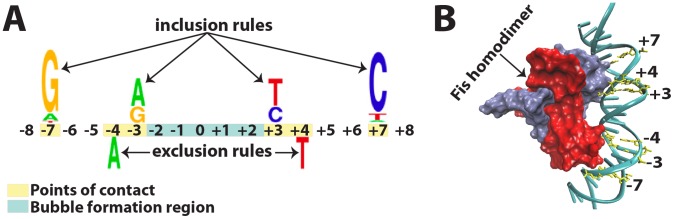
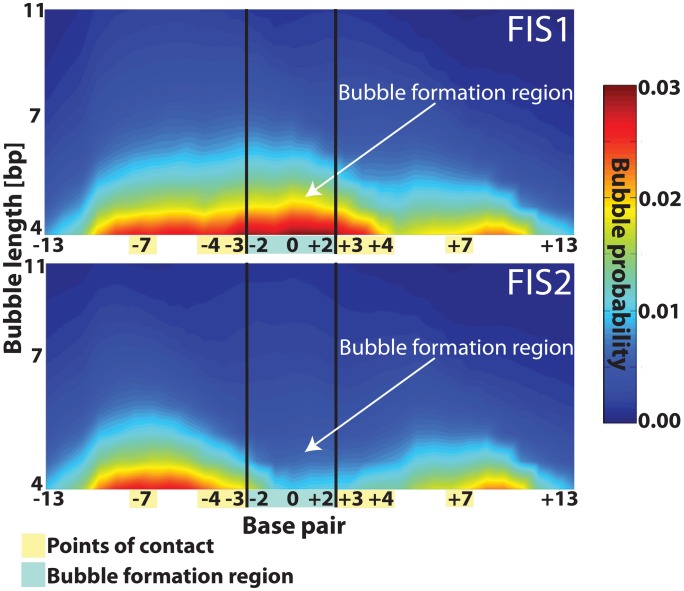
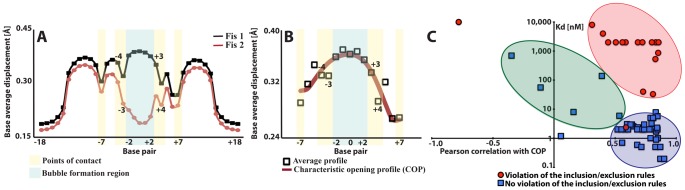
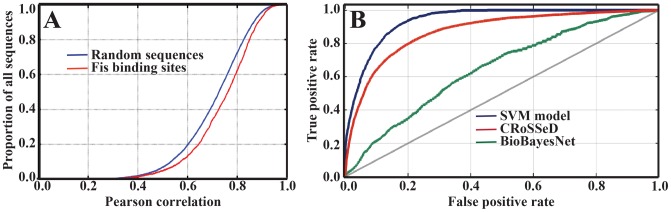
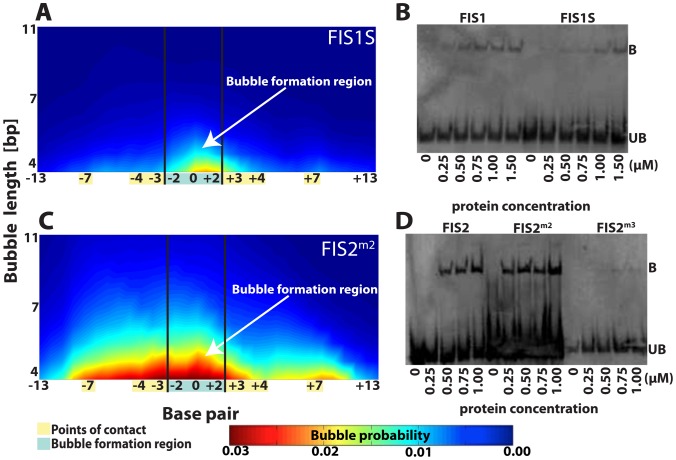
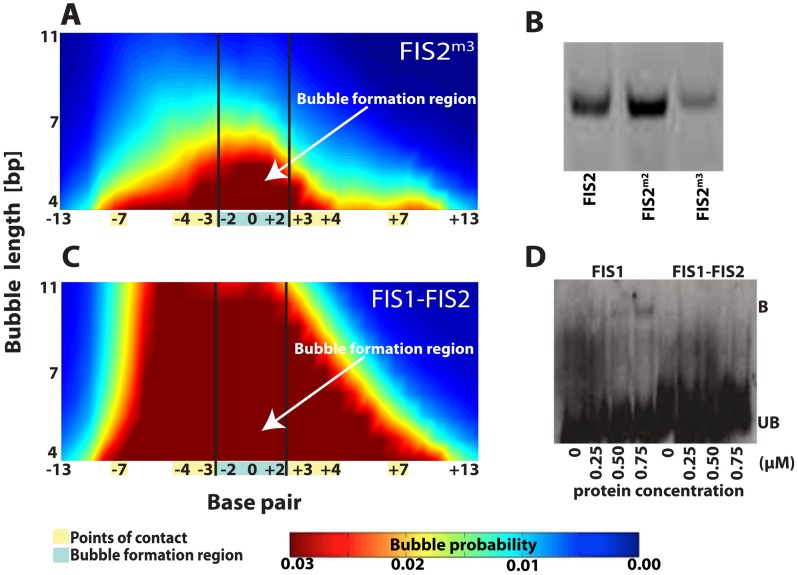
Physicochemical properties of DNA, such as shape, affect protein-DNA recognition. However, the properties of DNA that are most relevant for predicting the binding sites of particular transcription factors (TFs) or classes of TFs have yet to be fully understood. Here, using a model that accurately captures the melting behavior and breathing dynamics (spontaneous local openings of the double helix) of double-stranded DNA, we simulated the dynamics of known binding sites of the TF and nucleoid-associated protein Fis in Escherichia coli. Our study involves simulations of breathing dynamics, analysis of large published in vitro and genomic datasets, and targeted experimental tests of our predictions. Our simulation results and available in vitro binding data indicate a strong correlation between DNA breathing dynamics and Fis binding. Indeed, we can define an average DNA breathing profile that is characteristic of Fis binding sites. This profile is significantly enriched among the identified in vivo E. coli Fis binding sites. To test our understanding of how Fis binding is influenced by DNA breathing dynamics, we designed base-pair substitutions, mismatch, and methylation modifications of DNA regions that are known to interact (or not interact) with Fis. The goal in each case was to make the local DNA breathing dynamics either closer to or farther from the breathing profile characteristic of a strong Fis binding site. For the modified DNA segments, we found that Fis-DNA binding, as assessed by gel-shift assay, changed in accordance with our expectations. We conclude that Fis binding is associated with DNA breathing dynamics, which in turn may be regulated by various nucleotide modifications.


Conflict of interest statement

The authors have declared that no competing interests exist.

Figures

Figure 1
Figure 1. Fis-DNA points-of-contact and inclusion/exclusion rules.
(A) Qualitative depiction of the sequence logo for a palindromic Fis binding site, emphasizing inclusion rules (above the numbers indicating the locations in the binding segment) and exclusion rules (below the numbers). The rules were derived from previous studies (see the main text). Yellow indicates direct points-of-contact or positions of inclusion/exclusion rules; blue indicates location of the Fis bubble formation region. The colors of the nucleic acids are chosen as the commonly used ones in consensus sequence logos. (B) Crystal structure example of Fis-DNA binding complex visualized by the data from PDB code 3IV5 as submitted in . The nucleotides (direct points-of-contact) participating in the inclusion/exclusion rules are labeled and highlighted in yellow.
Figure 2
Figure 2. DNA local breathing dynamics of FIS1 and FIS2.
The nucleotide positions are shown along the horizontal axis. Positions corresponding to points-of-contact are highlighted in yellow while the bubble formation region is highlighted in blue. The length of the transient bubbles (in number of base pairs [bp]) is shown along the vertical axis. The color map represents the probability for bubble openings where the red color denotes high probability and blue color denotes low probability. The name of the sequence for each variant is shown in the panel (all sequences can be found in Table 1).
Figure 3
Figure 3. Correlation between Fis binding affinity and the generalized opening profile.
(A) The MCMC average opening profiles (vertical axis in [Å]) of FIS1 and FIS2 as a function of the nucleotide position. The bubble formation region is highlighted in blue while the points-of-contact are highlighted in yellow. (B) Characteristic MCMC opening profile (COP) obtained as the average of the profiles (black squares) of the oligomers with in vitro Fis-DNA binding affinity with KD<1 nM (Table S1). The red line represents a polynomial fit to the data. The bubble formation region is highlighted in blue while the points-of-contact are highlighted in yellow. In panels (A) and (B), the horizontal axes indicate base pair position whereas the vertical axes indicate base pair average displacement (see Materials and Methods). (C) Schematic affinity shape-correlation diagram of the examined in vitro sequences. Each point represents an oligomer with specific direct points-of-contact, correlation with the COP, and measured dissociation constant KD (the data is from Table S1). The Pearson's correlation coefficient (horizontal axis) between the COP and the sequence shape and the KD (vertical logarithmic axis) are the (x, y) coordinates for each oligomer. The red circles depict sequences that violate at least two of the inclusion/exclusion rules while the blue squares correspond to the remaining sequences. The blue ellipse schematically depicts the majority of DNA sequences with good Fis-DNA binding (KD< = 3 nM), and the other two ellipses schematically depict the majority of sequences with low affinity to Fis caused by bad point-of-contacts (pink) or low correlation with COP (green).
Figure 4
Figure 4. Fis in vivo binding sites vs. randomly selected E. coli genomic sequences.
(A) Cumulative density functions of subsequences with most significant correlation with COP. The Fis binding sites dataset is shown as a red curve while the random sequences dataset is depicted as a blue curve. The x-axis is the Pearson correlation coefficient while the y-axis is the proportion of subsequences with a maximum correlation with the COP profile worst or equal to the corresponding x value. (B) Receiver-operating curves base on our SVM model as well as models built with CRoSSeD and BioBayesNet. The x-axis depicts the false positive rate while the y-axis depicts true positive predictions. The blue curve corresponds to the results from our SVM classifier, the red curve to ones from the CRoSSeD model, and the green curve to ones from the BioBayesNet model.
Figure 5
Figure 5. Fis binding site modifications, Langevin dynamics simulations of DNA breathing, and EMSA experiments, the first set.
(A) Langevin dynamics simulations demonstrating suppressed local DNA breathing dynamics in the FIS1S sequence (compare to FIS1 in Figure 2). Base pair substitutions were made in the left and right flank regions of FIS1 to create a stiffer sequence while the direct points-of-contact remained unchanged (Table 1). (B) EMSA demonstrating the decrease in affinity of bound FIS1S sequence in complex with purified Fis protein vs. the FIS1 sequence. FIS1 and FIS1S oligonucleotides were constant at 100 nM, and Fis protein ranged from 0 to 1.5 µM. (C) Langevin dynamics simulations demonstrating enhanced FIS2m2 local DNA breathing dynamics (compare to FIS2 in Figure 2). FIS2m2 was designed by introducing two O6-methylguanine in the bubble formation region of FIS2 (Table 1) while the direct points-of-contacts remain unchanged. (D) EMSA demonstrating the increase in complex formation of FIS2m2 vs. FIS2 as well as the decrease in complex formation in FIS2m3 (third set of lanes). Oligonucleotide sequences were constant at 100 nM, and Fis protein ranged from 0 to 1.5 µM (for each of the lanes). Sonicated salmon sperm DNA at 0.5–1 µg/µl was added to the binding reactions to eliminate non-specific binding. In Langevin dynamics (panels A and C) the probability of bubble openings is represented by the same color map; red denotes high probability and blue denotes low probability of opening. The length of the transient bubbles, given in base pairs [bp], is shown along the vertical axis. The horizontal axis depicts base pair position; the bubble formation region is highlighted in blue while the points-of-contact are highlighted in yellow. The names of each of the sequences are shown in the panels while the complete nucleotide sequences could be found in Table 1.
Figure 6
Figure 6. Fis binding site modifications, Langevin dynamics simulations of DNA breathing, and EMSA experiments, the second set.
(A) Langevin dynamics simulations reinforcing the local DNA breathing dynamics in FIS2m3 via three O6-methylguanine modifications in the bubble formation region of FIS2 (Table 1). The direct points-of-contacts remain unchanged. (B) Polyacrylamide gel electrophoresis of dsDNA oligonucleotides sequences - FIS2, FIS2m2, and FIS2m3 - demonstrating gel migratory effects due to possible bubble formation (gel at 15%). (C) Langevin dynamics simulations demonstrating local disruption of the hydrogen bonds in the super-enhanced DNA local openings of the FIS1–FIS2 sequence (Table 1) caused by the presence of five mismatches at the FIS1 bubble formation region. (D) EMSA demonstrating the lack in complex formation in FIS1–FIS2. Concentration of the FIS1 and FIS1–FIS2 oligomers were constant at 100 nM and Fis protein ranged from 0 to 0.75 µM. Sonicated salmon sperm DNA at 0.5–1 µg/µl was added to the binding reactions to eliminate non-specific binding. In Langevin dynamics simulations (panels A and C) the probability of bubble openings is represented by the same color map as in Figure 5; red denotes high probability and blue denotes low probability of opening. The probability is determined from the lifetimes of all open states with a given length (bp) and above amplitude of 1.0 (Å), normalized over the complete time of the simulation. The length of the transient bubbles, given in base pairs [bp], is shown along the vertical axis. The horizontal axis depicts base pair position; the bubble formation region is highlighted in blue while the points-of-contact are highlighted in yellow. The names of each of the sequences are shown in the panels while the complete nucleotide sequences could be found in Table 1.

Similar articles

Cited by

References

    1. Farnham PJ (2009) Insights from genomic profiling of transcription factors. Nature reviews Genetics 10: 605–616. - PMC - PubMed
    1. Badis G, Berger MF, Philippakis AA, Talukder S, Gehrke AR, et al. (2009) Diversity and complexity in DNA recognition by transcription factors. Science 324: 1720–1723. - PMC - PubMed
    1. Hobert O (2008) Gene regulation by transcription factors and microRNAs. Science 319: 1785–1786. - PubMed
    1. Valouev A, Johnson DS, Sundquist A, Medina C, Anton E, et al. (2008) Genome-wide analysis of transcription factor binding sites based on ChIP-Seq data. Nature methods 5: 829–834. - PMC - PubMed
    1. Johnson DS, Mortazavi A, Myers RM, Wold B (2007) Genome-wide mapping of in vivo protein-DNA interactions. Science 316: 1497–1502. - PubMed

Publication types

LinkOut - more resources