

Magel2 is required for leptin-mediated depolarization of POMC neurons in the hypothalamic arcuate nucleus in mice
- PMID: 23341784
- PMCID: PMC3547795
- DOI: 10.1371/journal.pgen.1003207
Magel2 is required for leptin-mediated depolarization of POMC neurons in the hypothalamic arcuate nucleus in mice
Abstract
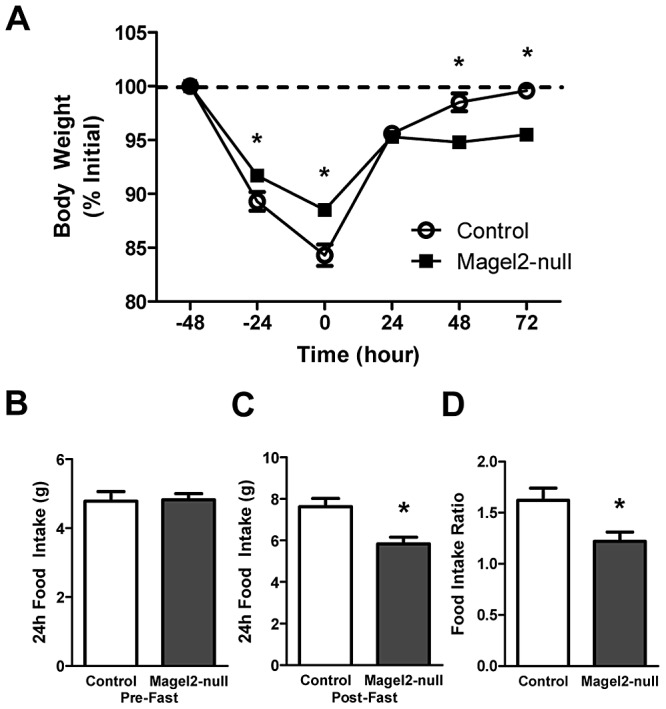
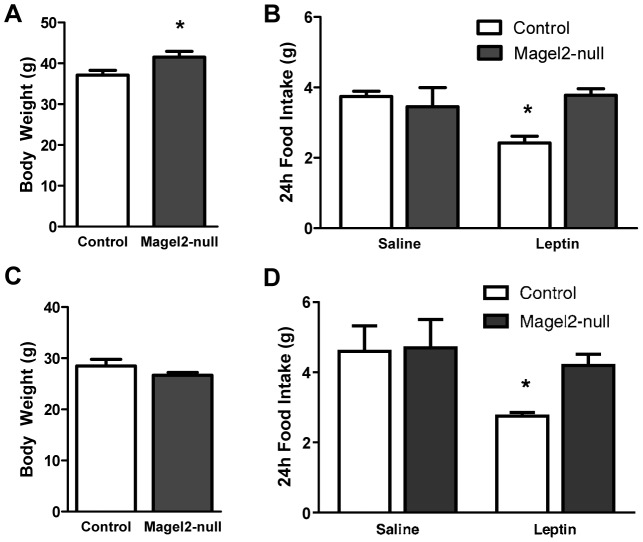
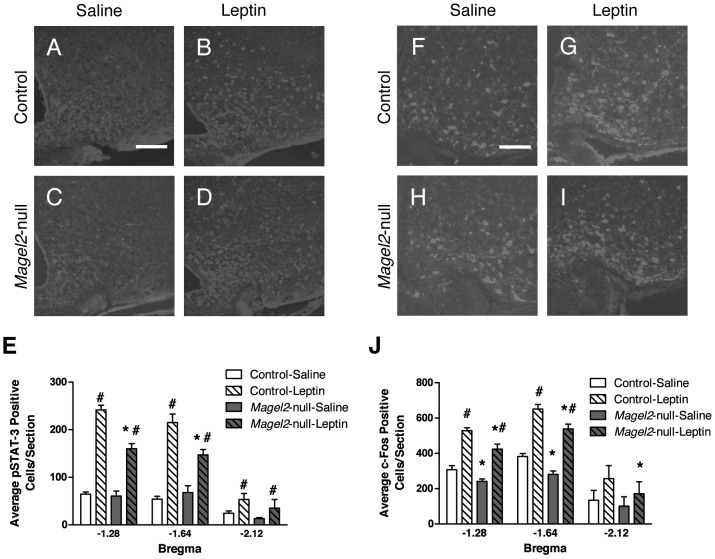
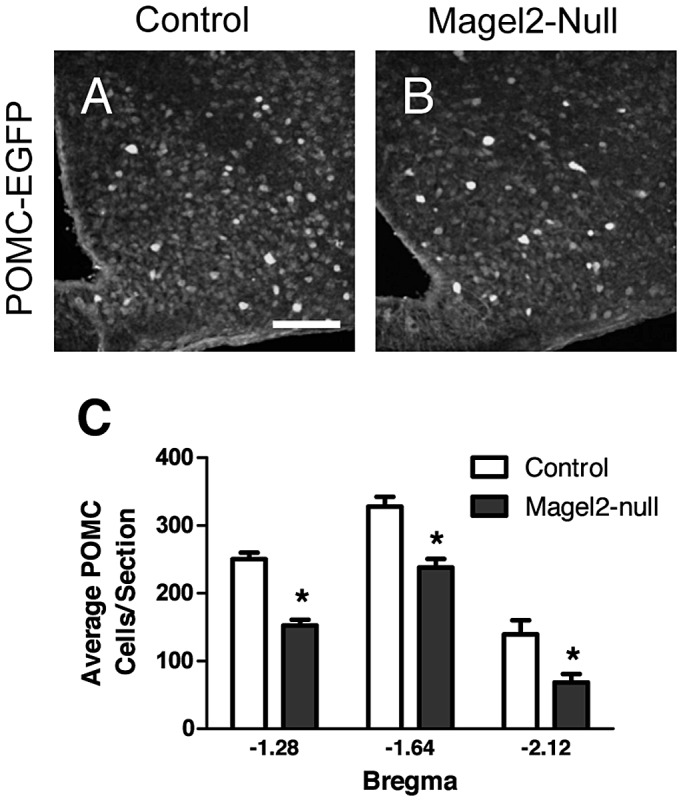
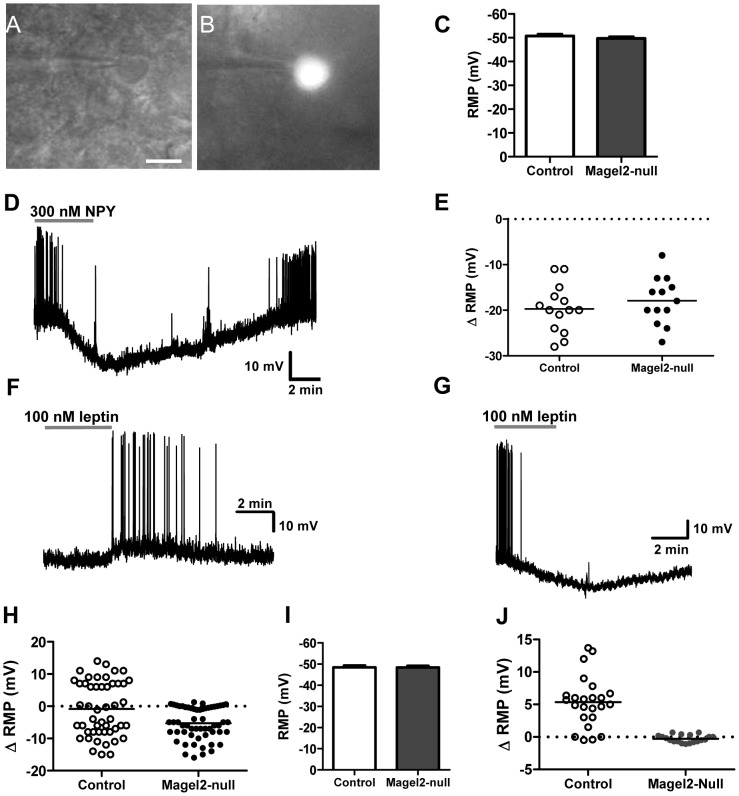
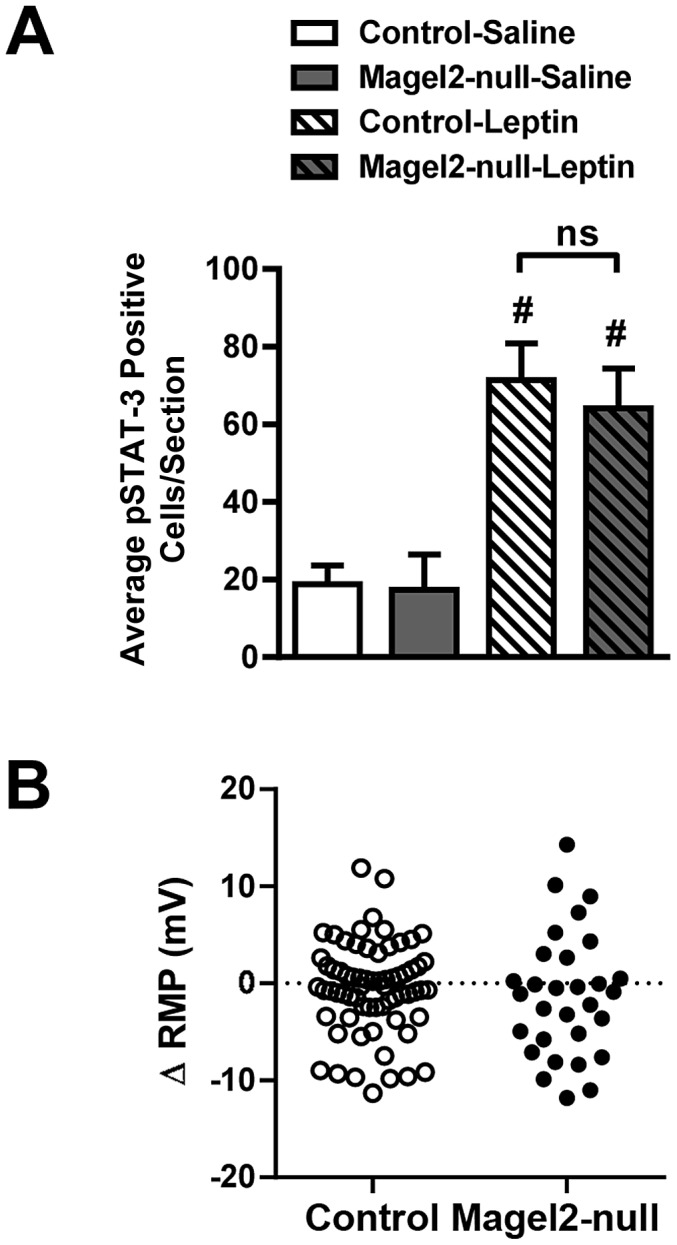
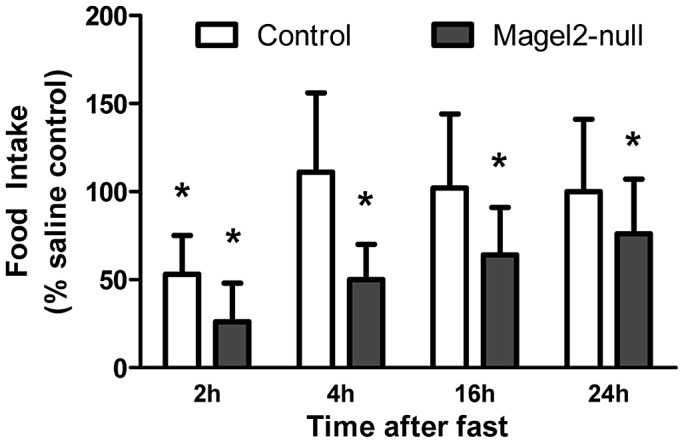
Prader-Willi Syndrome is the most common syndromic form of human obesity and is caused by the loss of function of several genes, including MAGEL2. Mice lacking Magel2 display increased weight gain with excess adiposity and other defects suggestive of hypothalamic deficiency. We demonstrate Magel2-null mice are insensitive to the anorexic effect of peripherally administered leptin. Although their excessive adiposity and hyperleptinemia likely contribute to this physiological leptin resistance, we hypothesized that Magel2 may also have an essential role in intracellular leptin responses in hypothalamic neurons. We therefore measured neuronal activation by immunohistochemistry on brain sections from leptin-injected mice and found a reduced number of arcuate nucleus neurons activated after leptin injection in the Magel2-null animals, suggesting that most but not all leptin receptor-expressing neurons retain leptin sensitivity despite hyperleptinemia. Electrophysiological measurements of arcuate nucleus neurons expressing the leptin receptor demonstrated that although neurons exhibiting hyperpolarizing responses to leptin are present in normal numbers, there were no neurons exhibiting depolarizing responses to leptin in the mutant mice. Additional studies demonstrate that arcuate nucleus pro-opiomelanocortin (POMC) expressing neurons are unresponsive to leptin. Interestingly, Magel2-null mice are hypersensitive to the anorexigenic effects of the melanocortin receptor agonist MT-II. In Prader-Willi Syndrome, loss of MAGEL2 may likewise abolish leptin responses in POMC hypothalamic neurons. This neural defect, together with increased fat mass, blunted circadian rhythm, and growth hormone response pathway defects that are also linked to loss of MAGEL2, could contribute to the hyperphagia and obesity that are hallmarks of this disorder.
Conflict of interest statement
The authors have declared that no competing interests exist.
Figures
Similar articles
-
Magel2 knockdown in hypothalamic POMC neurons innervating the medial amygdala reduces susceptibility to diet-induced obesity.Life Sci Alliance. 2022 Aug 25;5(11):e202201502. doi: 10.26508/lsa.202201502. Print 2022 Nov. Life Sci Alliance. 2022. PMID: 36007929 Free PMC article.
-
Progressive postnatal decline in leptin sensitivity of arcuate hypothalamic neurons in the Magel2-null mouse model of Prader-Willi syndrome.Hum Mol Genet. 2015 Aug 1;24(15):4276-83. doi: 10.1093/hmg/ddv159. Epub 2015 Apr 29. Hum Mol Genet. 2015. PMID: 25926624
-
The Prader-Willi syndrome proteins MAGEL2 and necdin regulate leptin receptor cell surface abundance through ubiquitination pathways.Hum Mol Genet. 2017 Nov 1;26(21):4215-4230. doi: 10.1093/hmg/ddx311. Hum Mol Genet. 2017. PMID: 28973533 Free PMC article.
-
Monogenic human obesity syndromes.Handb Clin Neurol. 2021;181:301-310. doi: 10.1016/B978-0-12-820683-6.00022-1. Handb Clin Neurol. 2021. PMID: 34238466 Review.
-
Electrophysiological actions of peripheral hormones on melanocortin neurons.Ann N Y Acad Sci. 2003 Jun;994:175-86. doi: 10.1111/j.1749-6632.2003.tb03178.x. Ann N Y Acad Sci. 2003. PMID: 12851314 Review.
Cited by
-
Baby food and bedtime: Evidence for opposite phenotypes from different genetic and epigenetic alterations in Prader-Willi and Angelman syndromes.SAGE Open Med. 2019 Jan 28;7:2050312118823585. doi: 10.1177/2050312118823585. eCollection 2019. SAGE Open Med. 2019. PMID: 30728968 Free PMC article. Review.
-
Hormonal Imbalances in Prader-Willi and Schaaf-Yang Syndromes Imply the Evolution of Specific Regulation of Hypothalamic Neuroendocrine Function in Mammals.Int J Mol Sci. 2023 Aug 23;24(17):13109. doi: 10.3390/ijms241713109. Int J Mol Sci. 2023. PMID: 37685915 Free PMC article. Review.
-
Magel2-null mice are hyper-responsive to setmelanotide, a melanocortin 4 receptor agonist.Br J Pharmacol. 2016 Sep;173(17):2614-21. doi: 10.1111/bph.13540. Epub 2016 Jul 27. Br J Pharmacol. 2016. PMID: 27339818 Free PMC article.
-
Magel2 knockdown in hypothalamic POMC neurons innervating the medial amygdala reduces susceptibility to diet-induced obesity.Life Sci Alliance. 2022 Aug 25;5(11):e202201502. doi: 10.26508/lsa.202201502. Print 2022 Nov. Life Sci Alliance. 2022. PMID: 36007929 Free PMC article.
-
AAV-BDNF gene therapy ameliorates a hypothalamic neuroinflammatory signature in the Magel2-null model of Prader-Willi syndrome.Mol Ther Methods Clin Dev. 2023 Sep 13;31:101108. doi: 10.1016/j.omtm.2023.09.004. eCollection 2023 Dec 14. Mol Ther Methods Clin Dev. 2023. PMID: 37766791 Free PMC article.
References
-
- Graham M, Shutter JR, Sarmiento U, Sarosi I, Stark KL (1997) Overexpression of Agrt leads to obesity in transgenic mice. Nat Genet 17: 273–274. - PubMed
-
- Ollmann MM, Wilson BD, Yang YK, Kerns JA, Chen Y, et al. (1997) Antagonism of central melanocortin receptors in vitro and in vivo by agouti-related protein. Science 278: 135–138. - PubMed
-
- Tiesjema B, la Fleur SE, Luijendijk MC, Adan RA (2009) Sustained NPY overexpression in the PVN results in obesity via temporarily increasing food intake. Obesity 17: 1448–1450. - PubMed
-
- Morton GJ, Cummings DE, Baskin DG, Barsh GS, Schwartz MW (2006) Central nervous system control of food intake and body weight. Nature 443: 289–295. - PubMed
Publication types
MeSH terms
Substances
Grants and funding
LinkOut - more resources
Full Text Sources
Other Literature Sources
Medical
Molecular Biology Databases
Miscellaneous
