Clinical Trial
. 2013;8(1):e52477.
doi: 10.1371/journal.pone.0052477. Epub 2013 Jan 14.

Alterations with movement duration in the kinematics of a whole body pointing movement

Affiliations
Clinical Trial

Alterations with movement duration in the kinematics of a whole body pointing movement

Matthieu Casteran et al. PLoS One. 2013.

Abstract

Our aim was to investigate how the organization of a whole body movement is altered when movement duration (MD) is varied. Subjects performed the same whole body pointing movement over long, normal and short MDs. The kinematic trajectories were then analyzed on a normalized time base. A principal components analysis (PCA) revealed that the degree of coordination between the elevation angles of the body did not change with MD. This lack of significant differences in the coordination was interesting given that small spatial and temporal differences were observed in the individual kinematic trajectories. They were revealed by studying the trajectories of the elevation angles, joint markers and center of mass. The elevation angle excursions displayed modifications primarily in their spatial characteristics. These alterations were more marked for the short rather than long duration movements. The temporal characteristics of the elevation angles as measured by the time to peak of angular velocity were not modified in the same fashion hence displaying a dissociation in the tuning of the spatial and temporal aspects of the elevation angles. Modifications in the temporal characteristics of the movement were also studied by examining the velocity profiles of the joint markers. Interestingly, unlike the disordered nature of this variable for the elevation angles, the time to peak velocity was neatly ordered as a function of MD for the joint markers - It arrived first for the short duration movements, followed by those of the normal and finally long duration movements. Despite the modifications observed in the kinematic trajectories, a PCA with the elevation angle excursions at different MDs revealed that two principal components were sufficient to account for nearly all the variance in the data. Our results suggest that although similar, the kinematic trajectories at different MDs are not achieved by a simple time scaling.


Conflict of interest statement

Competing Interests: The authors have declared that no competing interests exist.

Figures

Figure 1
Figure 1. Stick diagrams.
a) Stick diagrams of a whole body pointing movement to a target that is placed at 15% on the anteroposterior axis and on the vertical axis. b) The computed elevation angles for the movements were the Shank (Sk), Thigh (Th), Pelvis (Pe), Truck (Tr), Head (He), Humerus (Hu), Forearm (Fo) and Hand (Ha).
Figure 2
Figure 2. Elevation angle excursion.
The kinematic trajectories of eight different elevation angles at three different movement durations for a typical subject. Beside each kinematic trace is the bar graph of the amplitudes recorded at long (Lo, black line and histogram), normal (N, grey line and histogram) and short (Sh, dotted line and hatching histogram) MDs. The amplitude of each angular displacement was defined as the absolute value of the difference between the initial and final angle. Each bar displays the mean and the SEM for all the subjects. Significantly different values are marked with an arrow.
Figure 3
Figure 3. VAFs from a Principal Components Analysis of the Elevation Angles of Individual Movement Types.
The eight kinematic trajectories from each type of whole body pointing could be represented using two principal components. Each bar displays the mean and the SEM for all the subjects. The VAF accounted by these components were not found to be significantly different for the different MDs (p>0.05, repeated measures ANOVA). This indicated a similar degree of correlation between the body segments at all three MDs.
Figure 4
Figure 4. Principal component trajectories.
The superimposed principal component trajectories for all the subjects at each MD. Each trace is the average for each subject. While the trajectory of the first principal component was similar for every subject and every MD, this was not the case for the second principal component (<20% VAF).
Figure 5
Figure 5. Time to peak of the elevation angle velocity profiles.
The histograms display the mean and SEM of the times to peak for the velocity profiles of the elevation angle trajectories at three different MDs. This variable was normally distributed for the head, trunk, pelvis and shank elevation angles. A significant difference was only observed between the long and short MD pelvic elevation angle (p<0.05, repeated measures ANOVA, Tukey HSD posthoc).
Figure 6
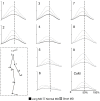
Figure 6. Velocity profiles of the joint markers.
The inset box represents the stick diagram with the number for each marker. The velocity profiles corresponding to each marker are displayed (1–9). The last figure displays the velocity profile for the CoM. The dotted line in each case represents 50% of the movement. On the x-axis is normalized time (percentage of total movement %) and on the y-axis, the velocity (m.s−1).
Figure 7
Figure 7. Time to peak velocity of the joint markers.
After constructing the velocity profiles for the markers at each joint along a normalized time base, we examined the times at which the peak velocity occurred. The mean and SEM of these values are displayed. The dotted line marks the half-way point for each movement. With the exception of the cases marked NS, all comparisons were found to be statistically significant. The figure shows that in most cases the markers for the movements at normal durations (grey histogram) had their peak velocities close to the half-way point of the movement. The peak velocities for movements at long (black histogram) and short (hatching histogram) durations occurred slightly later or earlier respectively.
Figure 8
Figure 8. Position of the Centre of Mass (CoM).
A comparison of the CoM for the movements conducted over short, normal and long MDs. All displacements were measured with respects to starting CoM positions. Significant differences for the vertical as well as anterior-posterior displacements were observed only between the movements at normal and short MDs. The inset box represents CoM trajectories for the three durations.
Figure 9
Figure 9. Combinations of common waveforms can be used to represent the kinematic trajectories executed over different MDs.
A comparison of the VAFs of the first two principal components (PC1-PC2) when comparing the WBP at three different durations. The trajectories of the eight elevation angles were used for carrying out the PCA. In one case it was done using the long (Lo) duration and normal duration (N) trajectories together while in the second case it was done using the short (Sh) duration and normal (N) duration trajectories together. Two principal components were sufficient to represent almost all the information from movements of different durations. This suggested that combinations of common waveforms can be used to generate the trajectories for the whole body pointing over different durations. No significant differences were found between the Lo-N and Sh-N principal components (p>0.05, repeated measures ANOVA, Tukey HSD).

Similar articles

References

    1. Soechting JF, Lacquaniti F (1981) Invariant characteristics of pointing movement in man. J Neuroscience 7: 710–720. - PMC - PubMed
    1. Hollerbach JM, Flash T (1982) Dynamic interaction between limb segments during planar arm movements. Biol Cybern 44: 67–77. - PubMed
    1. Atkeson CG, Hollerbach JM (1985) Kinematic features of unrestrained vertical arm movements. J Neuroscience 5: 2318–2330. - PMC - PubMed
    1. Gottlieb GL, Corcos DM, Agarwal G (1989) Strategies for the control of voluntary movements with one mechanical degree of freedom. Behavioral and Brain Sciences 12: 189–250.
    1. Gottlieb GL, Song Q, Hong DA, Almeida GL, Corcos D (1996) Coordinating movement at two joints: a principal of linear covariance. J Neurophysiol 75: 1760–1764. - PubMed

Publication types