

Mechanisms underlying ectopic persistent tooth-pulp pain following pulpal inflammation
- PMID: 23341909
- PMCID: PMC3547043
- DOI: 10.1371/journal.pone.0052840
Mechanisms underlying ectopic persistent tooth-pulp pain following pulpal inflammation
Abstract
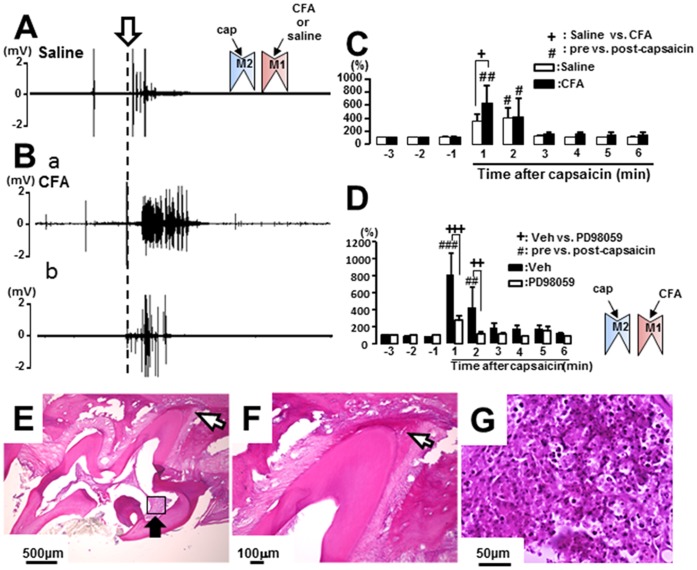
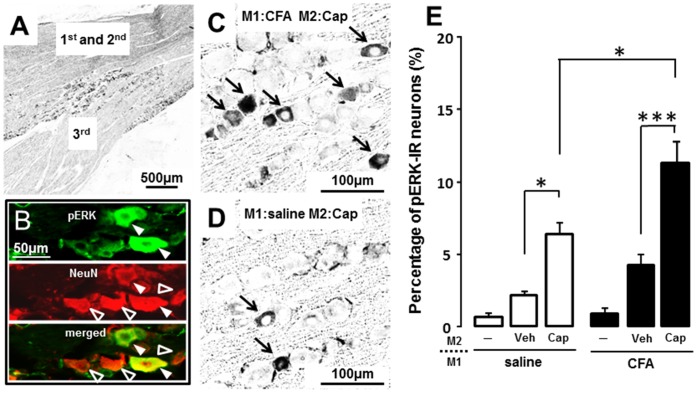
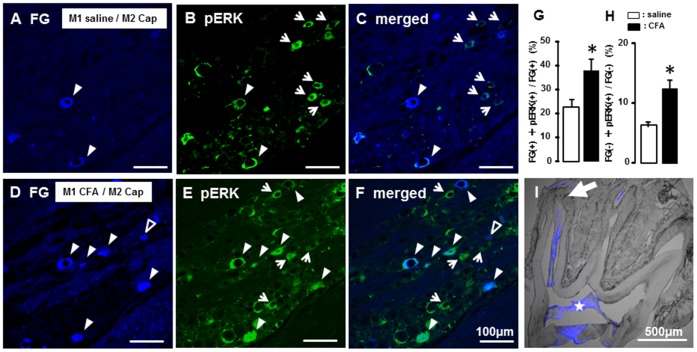
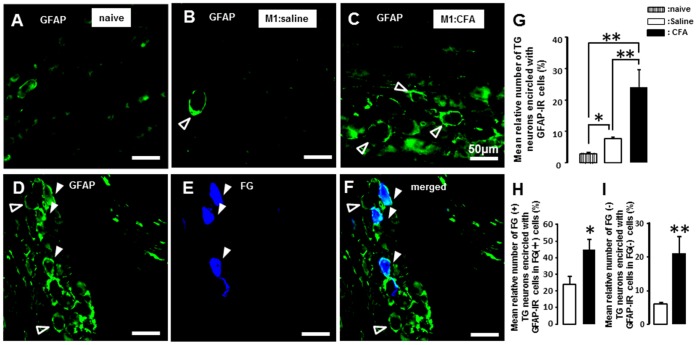
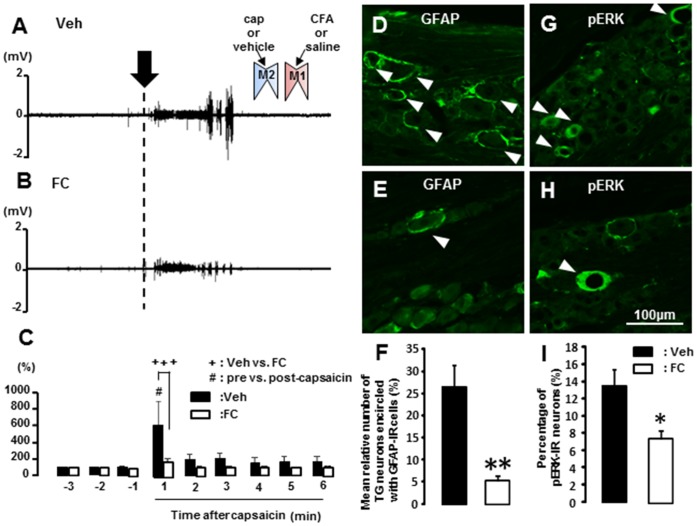
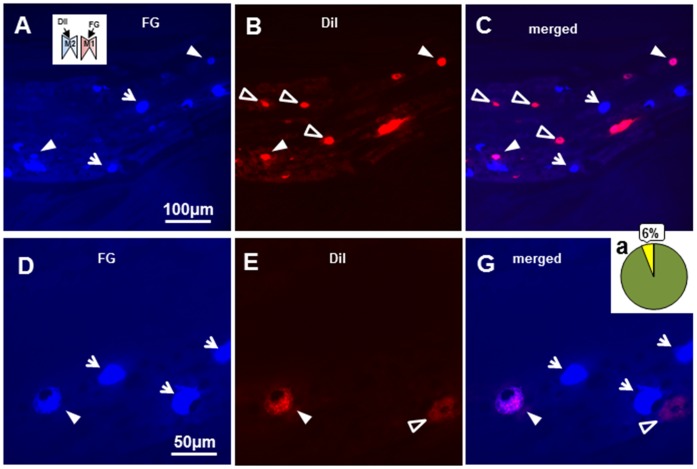
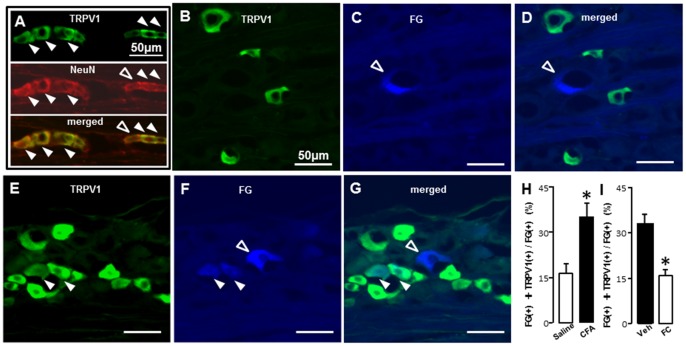
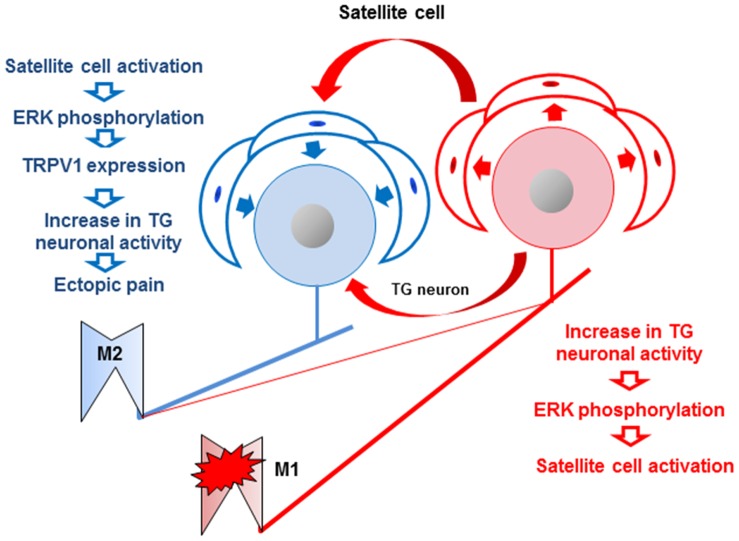
In order to clarify the peripheral mechanisms of ectopic persistent pain in a tooth pulp following pulpal inflammation of an adjacent tooth, masseter muscle activity, phosphorylated extracellular signal-regulated protein kinase (pERK) and TRPV1 immunohistochemistries and satellite cell activation using glial fibrillary acidic protein (GFAP) immunohistochemistry in the trigeminal ganglion (TG) were studied in the rats with molar tooth-pulp inflammation. And, Fluorogold (FG) and DiI were also used in a neuronal tracing study to analyze if some TG neurons innervate more than one tooth pulp. Complete Freund's adjuvant (CFA) or saline was applied into the upper first molar tooth pulp (M1) in pentobarbital-anesthetized rats, and capsaicin was applied into the upper second molar tooth pulp (M2) on day 3 after the CFA or saline application. Mean EMG activity elicited in the masseter muscle by capsaicin application to M2 was significantly larger in M1 CFA-applied rats compared with M1 vehicle-applied rats. The mean number of pERK-immunoreactive (IR) TG cells was significantly larger in M1 CFA-applied rats compared with M1 vehicle-applied rats. Application of the satellite cell inhibitor fluorocitrate (FC) into TG caused a significant depression of capsaicin-induced masseter muscle activity and a significant reduction of satellite cell activation. The number of TRPV1-IR TG cells innervating M2 was significantly larger in M1 CFA-applied rats compared with M1 vehicle-applied rats, and that was decreased following FC injection into TG. Furthermore, 6% of TG neurons innervating M1 and/or M2 innervated both M1 and M2. These findings suggest that satellite cell activation following tooth pulp inflammation and innervation of multiple tooth pulps by single TG neurons may be involved in the enhancement of the activity of TG neurons innervating adjacent non-inflamed teeth that also show enhancement of TRPV1 expression in TG neurons, resulting in the ectopic persistent tooth-pulp pain following pulpal inflammation of adjacent teeth.
Conflict of interest statement
Figures
Similar articles
-
Role of Neuron-Glial Interaction Mediated by IL-1β in Ectopic Tooth Pain.J Dent Res. 2018 Apr;97(4):467-475. doi: 10.1177/0022034517741253. Epub 2017 Nov 13. J Dent Res. 2018. PMID: 29131694
-
Toll-like receptor 4 signaling in trigeminal ganglion neurons contributes tongue-referred pain associated with tooth pulp inflammation.J Neuroinflammation. 2013 Nov 23;10:139. doi: 10.1186/1742-2094-10-139. J Neuroinflammation. 2013. PMID: 24267924 Free PMC article.
-
Involvement of trigeminal transition zone and laminated subnucleus caudalis in masseter muscle hypersensitivity associated with tooth inflammation.PLoS One. 2014 Oct 3;9(10):e109168. doi: 10.1371/journal.pone.0109168. eCollection 2014. PLoS One. 2014. PMID: 25279551 Free PMC article.
-
Morphological foundations of pain processing in dental pulp.J Oral Sci. 2020;62(2):126-130. doi: 10.2334/josnusd.19-0451. J Oral Sci. 2020. PMID: 32224566 Review.
-
The paradox of pain from tooth pulp: low-threshold "algoneurons"?Pain. 2011 Dec;152(12):2685-2689. doi: 10.1016/j.pain.2011.08.004. Epub 2011 Sep 1. Pain. 2011. PMID: 21889261 Free PMC article. Review. No abstract available.
Cited by
-
Ion Channels Involved in Tooth Pain.Int J Mol Sci. 2019 May 8;20(9):2266. doi: 10.3390/ijms20092266. Int J Mol Sci. 2019. PMID: 31071917 Free PMC article. Review.
-
Glial interleukin-1β upregulates neuronal sodium channel 1.7 in trigeminal ganglion contributing to temporomandibular joint inflammatory hypernociception in rats.J Neuroinflammation. 2018 Apr 20;15(1):117. doi: 10.1186/s12974-018-1154-0. J Neuroinflammation. 2018. PMID: 29678208 Free PMC article.
-
Trigeminal Nerve Transection-Induced Neuroplastic Changes in the Somatosensory and Insular Cortices in a Rat Ectopic Pain Model.eNeuro. 2019 Jan 28;6(1):ENEURO.0462-18.2019. doi: 10.1523/ENEURO.0462-18.2019. eCollection 2019 Jan-Feb. eNeuro. 2019. PMID: 30693315 Free PMC article.
-
Connexin 43 contributes to ectopic orofacial pain following inferior alveolar nerve injury.Mol Pain. 2016 Mar 8;12:1744806916633704. doi: 10.1177/1744806916633704. Print 2016. Mol Pain. 2016. PMID: 27030716 Free PMC article.
-
The Phytochemical, Quercetin, Attenuates Nociceptive and Pathological Pain: Neurophysiological Mechanisms and Therapeutic Potential.Molecules. 2024 Aug 21;29(16):3957. doi: 10.3390/molecules29163957. Molecules. 2024. PMID: 39203035 Free PMC article. Review.
References
-
- Glick DH (1962) Locating referred pulpal pains. Oral Surg Oral Med Oral Pathol 15: 613–623. - PubMed
-
- Zhang S, Chiang CY, Xie YF, Park SJ, Lu Y, et al. (2006) Central sensitization in thalamic nociceptive neurons induced by mustard oil application to rat molar tooth pulp. Neuroscience 142: 833–842. - PubMed
-
- Imbe H, Iwata K, Zhou QQ, Zou S, Dubner R, et al. (2001) Orofacial deep and cutaneous tissue inflammation and trigeminal neuronal activation. Implications for persistent temporomandibular pain. Cells Tissues Organs 169: 238–247. - PubMed
Publication types
MeSH terms
Substances
Grants and funding
LinkOut - more resources
Full Text Sources
Other Literature Sources
Miscellaneous
