

The effects of target skeletal muscle cells on dorsal root ganglion neuronal outgrowth and migration in vitro
- PMID: 23341911
- PMCID: PMC3544851
- DOI: 10.1371/journal.pone.0052849
The effects of target skeletal muscle cells on dorsal root ganglion neuronal outgrowth and migration in vitro
Abstract
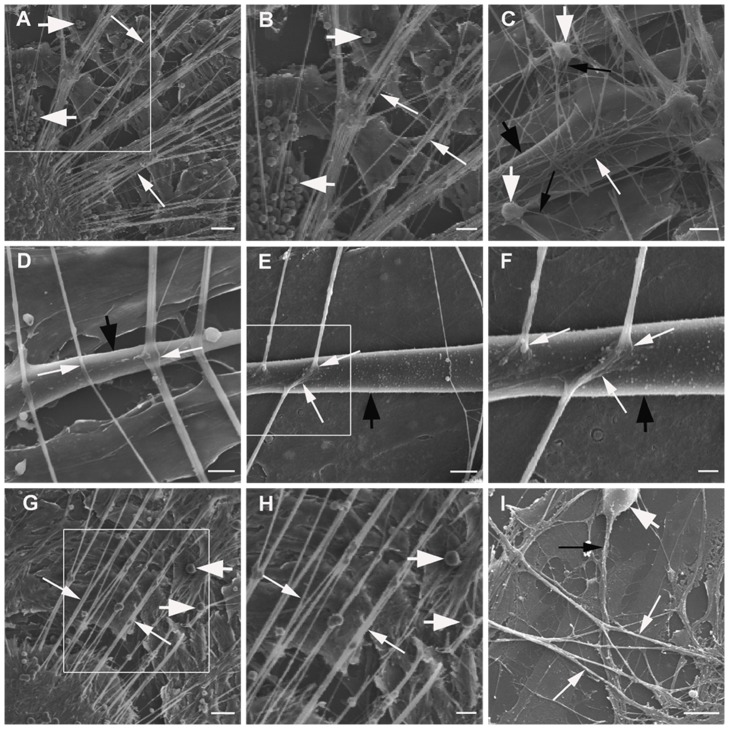
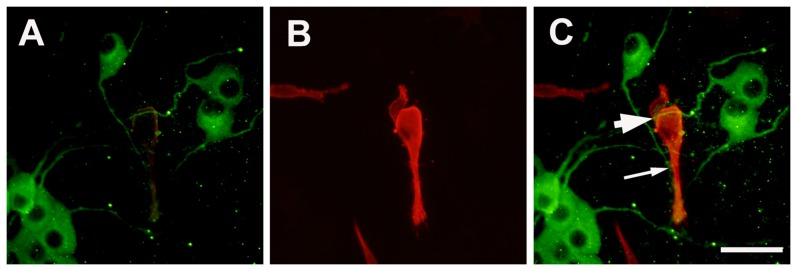
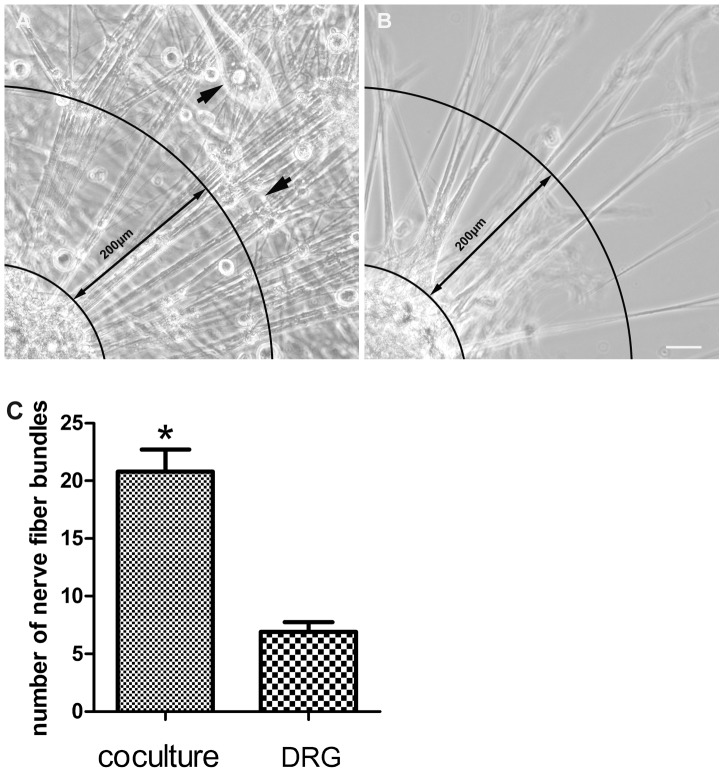
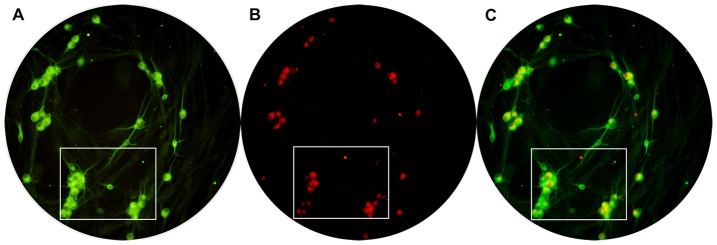
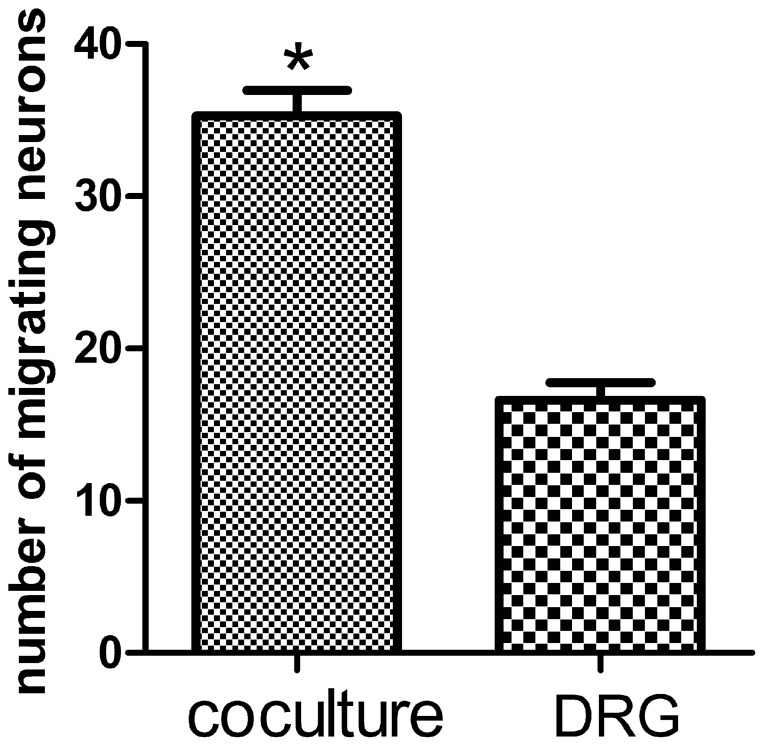
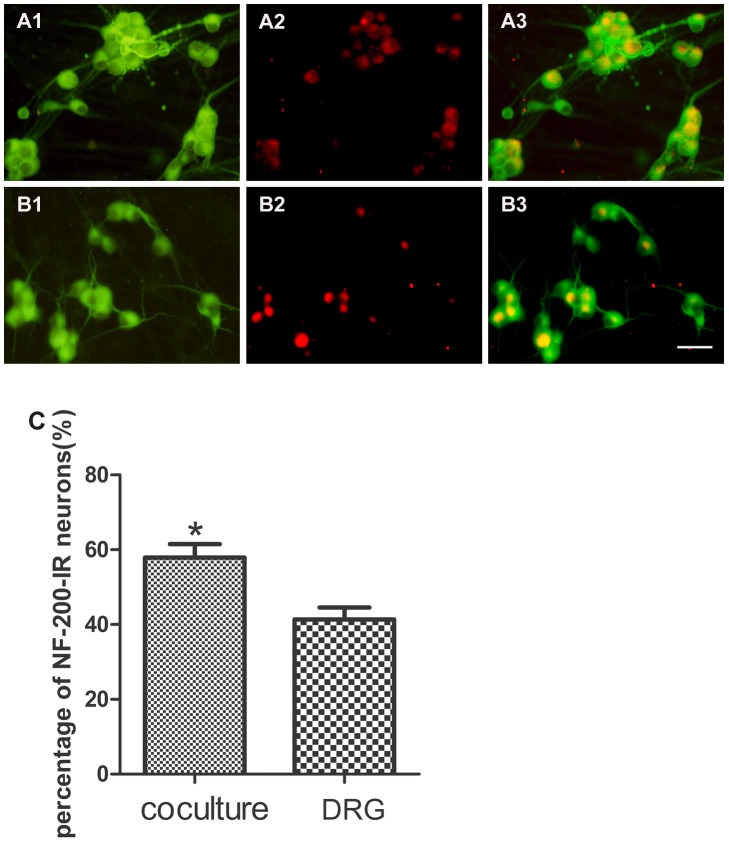
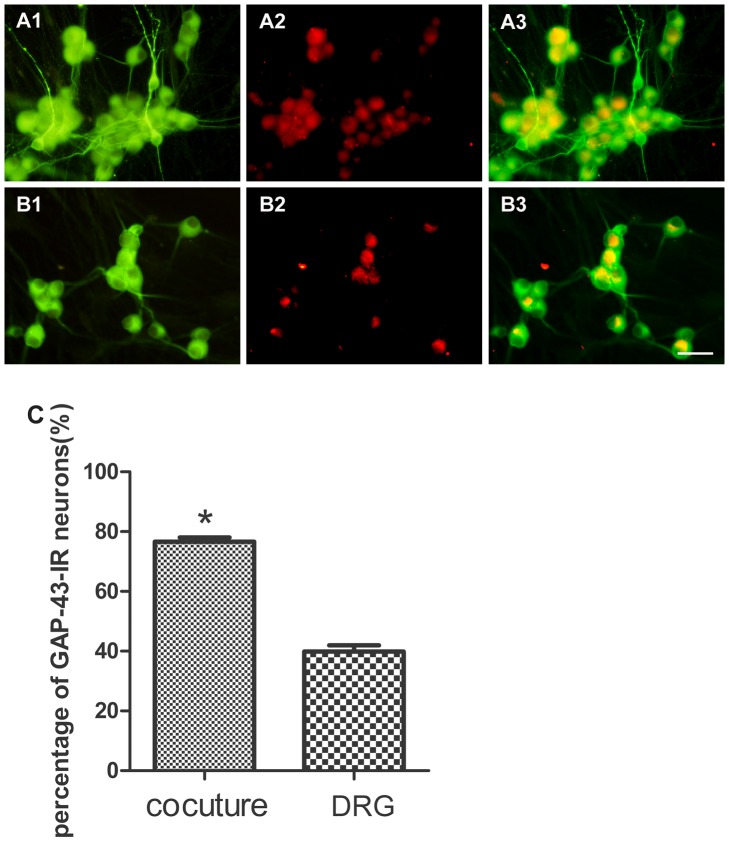
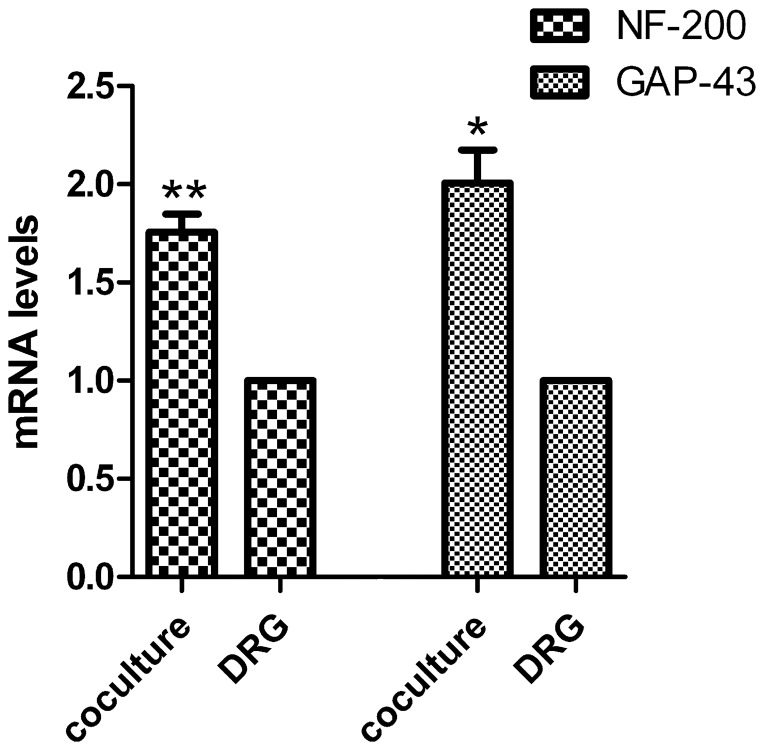
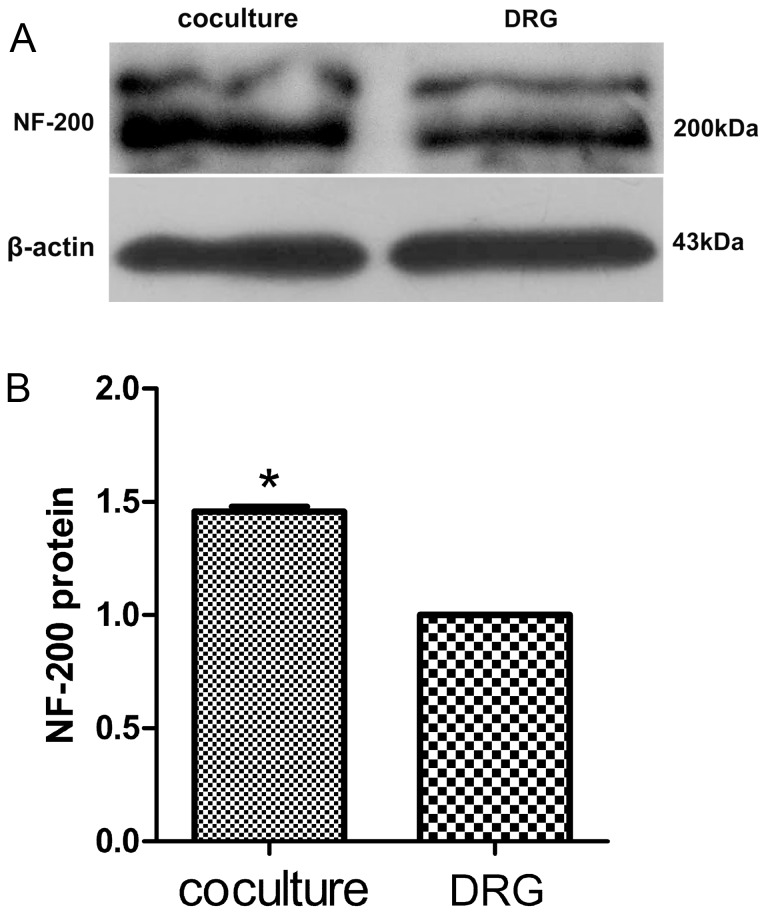
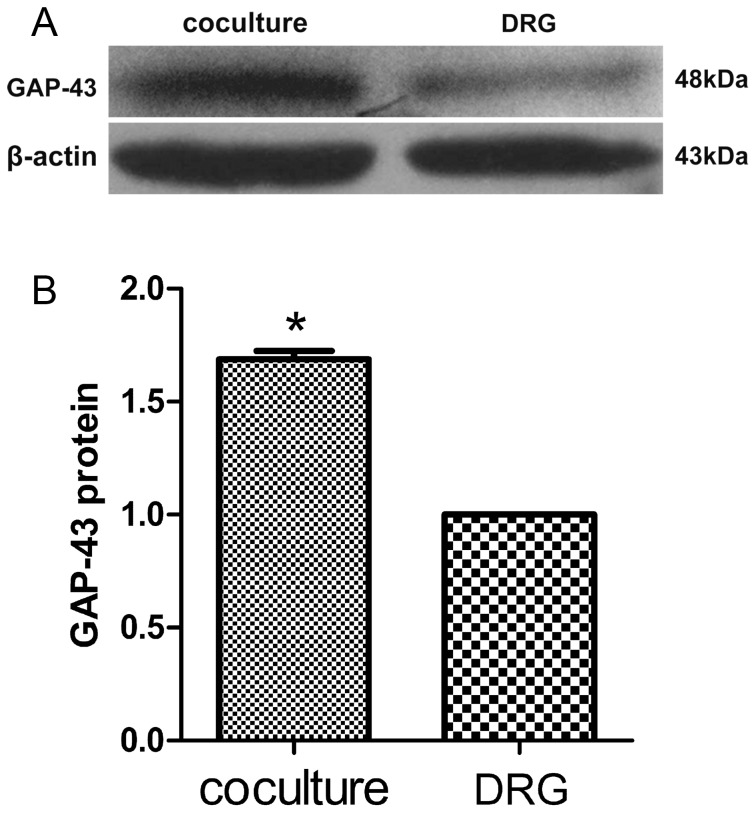
Targets of neuronal innervations play a vital role in regulating the survival and differentiation of innervating neurotrophin-responsive neurons. During development, neurons extend axons to their targets, and then their survival become dependent on the trophic substances secreted by their target cells. Sensory endings were present on myoblasts, myotubes, and myofibers in all intrafusal bundles regardless of age. The interdependence of sensory neurons and skeletal muscle (SKM) cells during both embryonic development and the maintenance of the mature functional state has not been fully understood. In the present study, neuromuscular cocultures of organotypic dorsal root ganglion (DRG) explants and dissociate SKM cells were established. Using this culture system, the morphological relationship between DRG neurons and SKM cells, neurites growth and neuronal migration were investigated. The migrating neurons were determined by fluorescent labeling of microtubule-associated protein-2 (MAP-2) and neurofilament 200 (NF-200) or growth-associated protein 43 (GAP-43). The expression of NF-200 and GAP-43 and their mRNAs was evaluated by Western blot assay and real time-PCR analysis. The results reveal that DRG explants showed more dense neurites outgrowth in neuromuscular cocultures as compared with that in the culture of DRG explants alone. The number of total migrating neurons (the MAP-2-expressing neurons) and the percentage NF-200-immunoreactive (IR) and GAP-43-IR neurons increased significantly in the presence of SKM cells. The levels of NF-200 and GAP-43 and their mRNAs increased significantly in neuromuscular cocultures as compared with that in the culture of DRG explants alone. These results suggested that target SKM cells play an important role in regulating neuronal protein synthesis, promoting neuritis outgrowth and neuronal migration of DRG explants in vitro. These results not only provide new clues for a better understanding of the association of SKM cells with DRG sensory neurons during development, they may also have implications for axonal regeneration after nerve injury.
Conflict of interest statement
Figures
Similar articles
-
The effects of neuregulin-1β on intrafusal muscle fiber formation in neuromuscular coculture of dorsal root ganglion explants and skeletal muscle cells.Skelet Muscle. 2018 Sep 15;8(1):29. doi: 10.1186/s13395-018-0175-9. Skelet Muscle. 2018. PMID: 30219099 Free PMC article.
-
Expression of mRNAs for PPT, CGRP, NF-200, and MAP-2 in cocultures of dissociated DRG neurons and skeletal muscle cells in administration of NGF or NT-3.Folia Histochem Cytobiol. 2012 Jul 5;50(2):312-8. doi: 10.5603/fhc.2012.0041. Folia Histochem Cytobiol. 2012. PMID: 22763971 Free PMC article.
-
Co-administration of monosialoganglioside and skeletal muscle cells on dorsal root ganglion neuronal phenotypes in vitro.Cell Mol Neurobiol. 2010 Jan;30(1):43-9. doi: 10.1007/s10571-009-9429-8. Epub 2009 Jul 7. Cell Mol Neurobiol. 2010. PMID: 19582569 Free PMC article.
-
Growth-associated protein-43 expression in cocultures of dorsal root ganglion neurons and skeletal muscle cells with different neurotrophins.Muscle Nerve. 2013 Jun;47(6):909-15. doi: 10.1002/mus.23689. Epub 2013 May 11. Muscle Nerve. 2013. PMID: 23666783
-
Neuregulin-1β Regulates the migration of Different Neurochemical Phenotypic Neurons from Organotypically Cultured Dorsal Root Ganglion Explants.Cell Mol Neurobiol. 2016 Jan;36(1):69-81. doi: 10.1007/s10571-015-0221-7. Epub 2015 Jun 21. Cell Mol Neurobiol. 2016. PMID: 26093851 Free PMC article.
Cited by
-
Specific effects of neuregulin-1β on the communication between DRG neurons and skeletal muscle cells in vitro.J Muscle Res Cell Motil. 2018 Aug;39(3-4):117-134. doi: 10.1007/s10974-018-9498-8. Epub 2018 Sep 12. J Muscle Res Cell Motil. 2018. PMID: 30209718
-
ECM-Mimetic Nylon Nanofiber Scaffolds for Neurite Growth Guidance.Nanomaterials (Basel). 2021 Feb 18;11(2):516. doi: 10.3390/nano11020516. Nanomaterials (Basel). 2021. PMID: 33670540 Free PMC article.
-
The mechanism of astragaloside IV promoting sciatic nerve regeneration.Neural Regen Res. 2013 Aug 25;8(24):2256-65. doi: 10.3969/j.issn.1673-5374.2013.24.005. Neural Regen Res. 2013. PMID: 25206535 Free PMC article.
-
Axonal outgrowth, neuropeptides expression and receptors tyrosine kinase phosphorylation in 3D organotypic cultures of adult dorsal root ganglia.PLoS One. 2017 Jul 24;12(7):e0181612. doi: 10.1371/journal.pone.0181612. eCollection 2017. PLoS One. 2017. PMID: 28742111 Free PMC article.
-
The effects of neuregulin-1β on intrafusal muscle fiber formation in neuromuscular coculture of dorsal root ganglion explants and skeletal muscle cells.Skelet Muscle. 2018 Sep 15;8(1):29. doi: 10.1186/s13395-018-0175-9. Skelet Muscle. 2018. PMID: 30219099 Free PMC article.
References
-
- Howe CL, Valletta JS, Rusnak AS, Mobley WC (2001) NGF signaling from clathrin-coated vesicles: evidence that signaling endosomes serve as a platform for the Ras-MAPK pathway. Neuron 32: 801–814. - PubMed
-
- Mars T, Martincic DS (2001) Apoptosis in co-cultures of human muscle and rat spinal cord during the formation of the neuromuscular junction. Pflugers Arch 442: R177–178. - PubMed
-
- Lohof AM, Ip NY, Poo MM (1993) Potentiation of developing neuromuscular synapses by the neurotrophins NT-3 and BDNF. Nature 363: 350–353. - PubMed
Publication types
MeSH terms
Substances
LinkOut - more resources
Full Text Sources
Other Literature Sources
Miscellaneous
