

Two weeks of metformin treatment enhances mitochondrial respiration in skeletal muscle of AMPK kinase dead but not wild type mice
- PMID: 23341947
- PMCID: PMC3544921
- DOI: 10.1371/journal.pone.0053533
Two weeks of metformin treatment enhances mitochondrial respiration in skeletal muscle of AMPK kinase dead but not wild type mice
Abstract
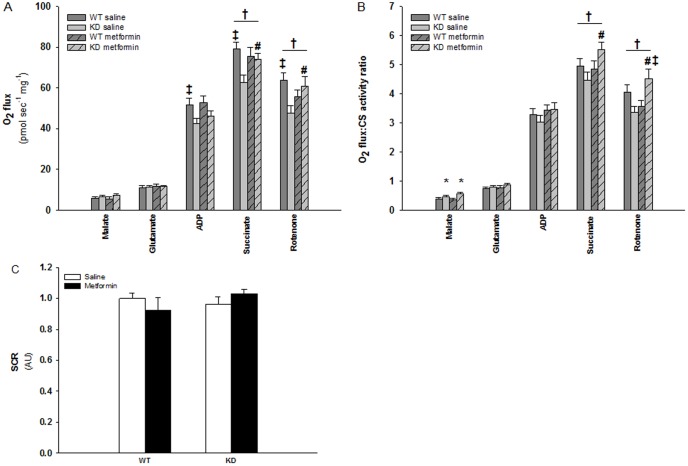
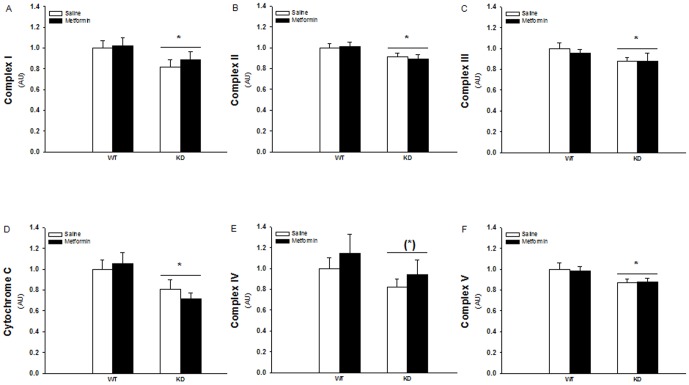
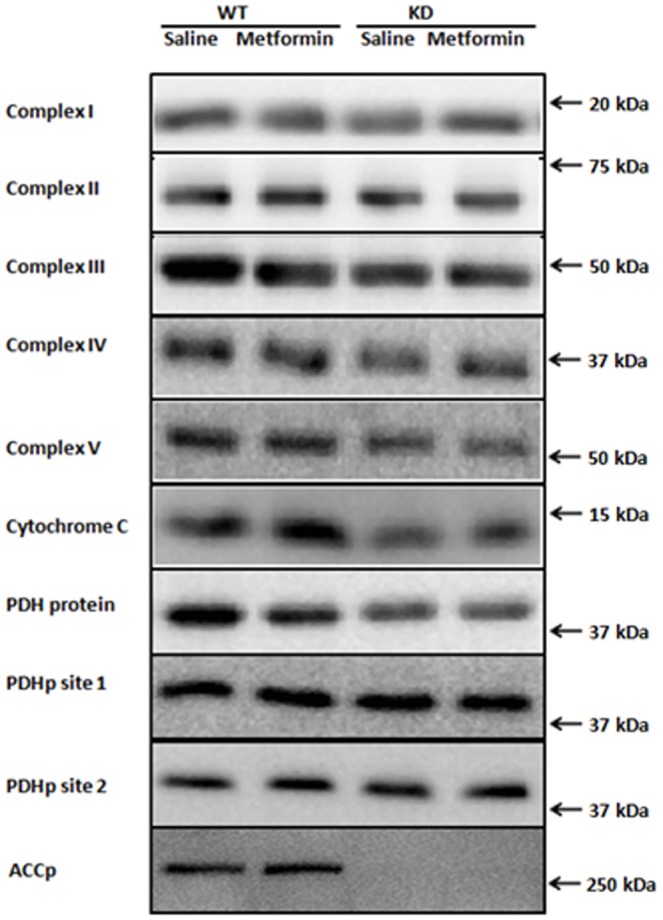
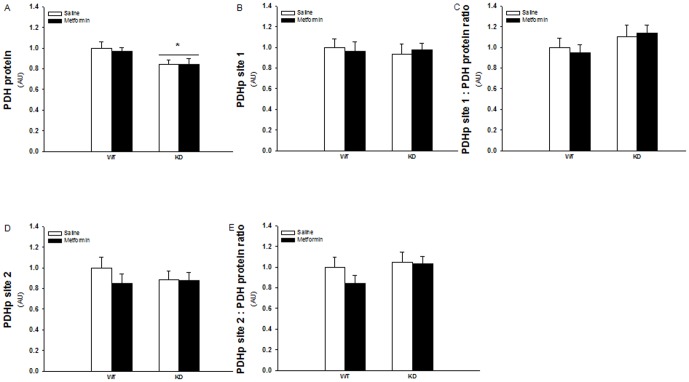
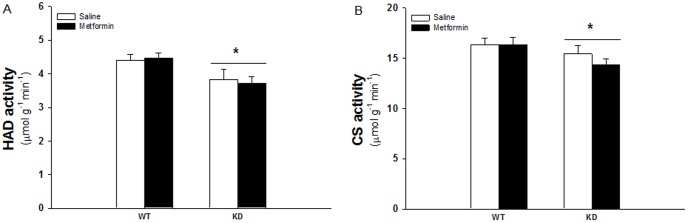
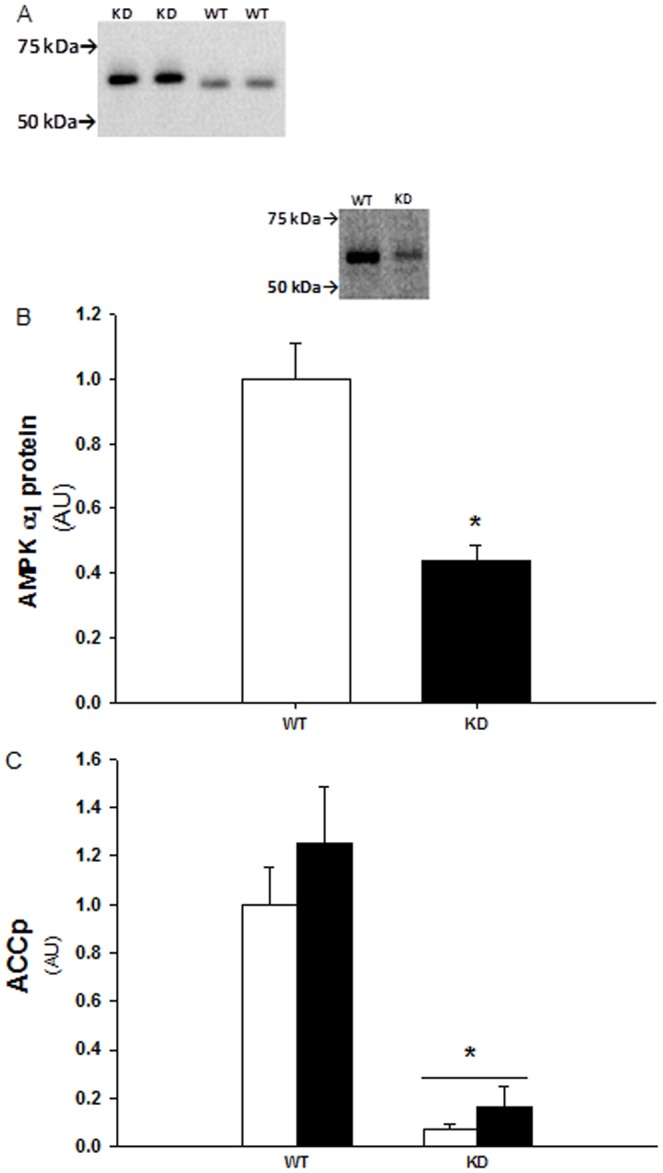
Metformin is used as an anti-diabetic drug. Metformin ameliorates insulin resistance by improving insulin sensitivity in liver and skeletal muscle. Reduced mitochondrial content has been reported in type 2 diabetic muscles and it may contribute to decreased insulin sensitivity characteristic for diabetic muscles. The molecular mechanism behind the effect of metformin is not fully clarified but inhibition of complex I in the mitochondria and also activation of the 5'AMP activated protein kinase (AMPK) has been reported in muscle. Furthermore, both AMPK activation and metformin treatment have been associated with stimulation of mitochondrial function and biogenesis. However, a causal relationship in skeletal muscle has not been investigated. We hypothesized that potential effects of in vivo metformin treatment on mitochondrial function and protein expressions in skeletal muscle are dependent upon AMPK signaling. We investigated this by two weeks of oral metformin treatment of muscle specific kinase dead α(2) (KD) AMPK mice and wild type (WT) littermates. We measured mitochondrial respiration and protein activity and expressions of key enzymes involved in mitochondrial carbohydrate and fat metabolism and oxidative phosphorylation. Mitochondrial respiration, HAD and CS activity, PDH and complex I-V and cytochrome c protein expression were all reduced in AMPK KD compared to WT tibialis anterior muscles. Surprisingly, metformin treatment only enhanced respiration in AMPK KD mice and thereby rescued the respiration defect compared to the WT mice. Metformin did not influence protein activities or expressions in either WT or AMPK KD mice.We conclude that two weeks of in vivo metformin treatment enhances mitochondrial respiration in the mitochondrial deficient AMPK KD but not WT mice. The improvement seems to be unrelated to AMPK, and does not involve changes in key mitochondrial proteins.
Conflict of interest statement
Figures
Similar articles
-
Two weeks of metformin treatment induces AMPK-dependent enhancement of insulin-stimulated glucose uptake in mouse soleus muscle.Am J Physiol Endocrinol Metab. 2014 May 15;306(10):E1099-109. doi: 10.1152/ajpendo.00417.2013. Epub 2014 Mar 18. Am J Physiol Endocrinol Metab. 2014. PMID: 24644243 Free PMC article.
-
The effects of apelin treatment on skeletal muscle mitochondrial content.Am J Physiol Regul Integr Comp Physiol. 2009 Dec;297(6):R1761-8. doi: 10.1152/ajpregu.00422.2009. Epub 2009 Sep 30. Am J Physiol Regul Integr Comp Physiol. 2009. PMID: 19793954
-
Chronic AMP-activated protein kinase activation and a high-fat diet have an additive effect on mitochondria in rat skeletal muscle.J Appl Physiol (1985). 2010 Aug;109(2):511-20. doi: 10.1152/japplphysiol.00126.2010. Epub 2010 Jun 3. J Appl Physiol (1985). 2010. PMID: 20522731 Free PMC article.
-
The mechanisms of action of metformin.Diabetologia. 2017 Sep;60(9):1577-1585. doi: 10.1007/s00125-017-4342-z. Epub 2017 Aug 3. Diabetologia. 2017. PMID: 28776086 Free PMC article. Review.
-
Targeting the Electron Transport System for Enhanced Longevity.Biomolecules. 2025 Apr 23;15(5):614. doi: 10.3390/biom15050614. Biomolecules. 2025. PMID: 40427507 Free PMC article. Review.
Cited by
-
Swim Training Modulates Skeletal Muscle Energy Metabolism, Oxidative Stress, and Mitochondrial Cholesterol Content in Amyotrophic Lateral Sclerosis Mice.Oxid Med Cell Longev. 2018 Apr 11;2018:5940748. doi: 10.1155/2018/5940748. eCollection 2018. Oxid Med Cell Longev. 2018. PMID: 29849903 Free PMC article.
-
Metformin ameliorates gender-and age-dependent hemodynamic instability and myocardial injury in murine hemorrhagic shock.Biochim Biophys Acta Mol Basis Dis. 2017 Oct;1863(10 Pt B):2680-2691. doi: 10.1016/j.bbadis.2017.05.027. Epub 2017 Jun 1. Biochim Biophys Acta Mol Basis Dis. 2017. PMID: 28579457 Free PMC article.
-
Exercise-Pharmacology Interactions: Metformin, Statins, and Healthspan.Physiology (Bethesda). 2020 Sep 1;35(5):338-347. doi: 10.1152/physiol.00013.2020. Physiology (Bethesda). 2020. PMID: 32783612 Free PMC article. Review.
-
PGC-1α activity and mitochondrial dysfunction in preterm infants.Front Physiol. 2022 Sep 26;13:997619. doi: 10.3389/fphys.2022.997619. eCollection 2022. Front Physiol. 2022. PMID: 36225305 Free PMC article. Review.
-
Sedentary Lifestyles and a Hypercaloric Diets During Middle Age, are Binomial Conducive to Fatal Progression, That is Counteracted by the Hormetic Treatment of Exercise, Metformin, and Tert-Butyl Hydroquinone: An Analysis of Female Middle-Aged Rat Liver Mitochondria.Dose Response. 2024 Oct 10;22(4):15593258241272619. doi: 10.1177/15593258241272619. eCollection 2024 Oct-Dec. Dose Response. 2024. PMID: 39399210 Free PMC article.
References
-
- Halimi S (2006) Metformin: 50 years old, fit as a fiddle, and indispensable for its pivotal role in type 2 diabetes management. Diabetes Metab 32: 555–556 S1262-3636(07)70309-9 [pii];10.1016/S1262-3636(07)70309-9 [doi]. - PubMed
-
- Stumvoll M, Haring HU, Matthaei S (2007) Metformin. Endocr Res 32: 39–57. - PubMed
-
- Lowell BB, Shulman GI (2005) Mitochondrial dysfunction and type 2 diabetes. Science 307: 384–387 307/5708/384 [pii];10.1126/science.1104343 [doi]. - PubMed
-
- Moreira PI, Oliveira CR (2011) Mitochondria as potential targets in antidiabetic therapy. Handb Exp Pharmacol 331–356 10.1007/978-3-642-17214-4_14 [doi]. - PubMed
Publication types
MeSH terms
Substances
LinkOut - more resources
Full Text Sources
Other Literature Sources
Molecular Biology Databases
