. 2013;8(1):e53649.
doi: 10.1371/journal.pone.0053649. Epub 2013 Jan 14.

Biased diversity metrics revealed by bacterial 16S pyrotags derived from different primer sets

Affiliations

Biased diversity metrics revealed by bacterial 16S pyrotags derived from different primer sets

Lin Cai et al. PLoS One. 2013.

Abstract

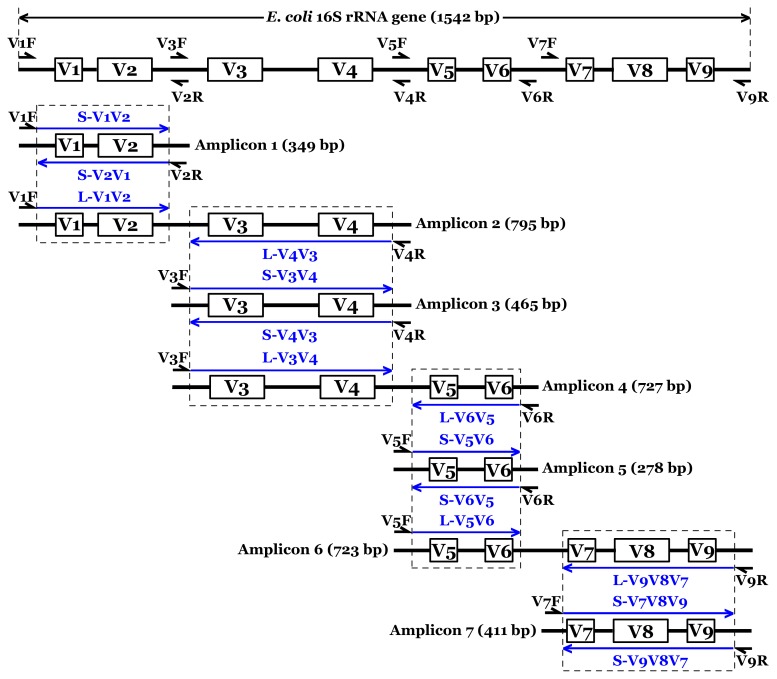
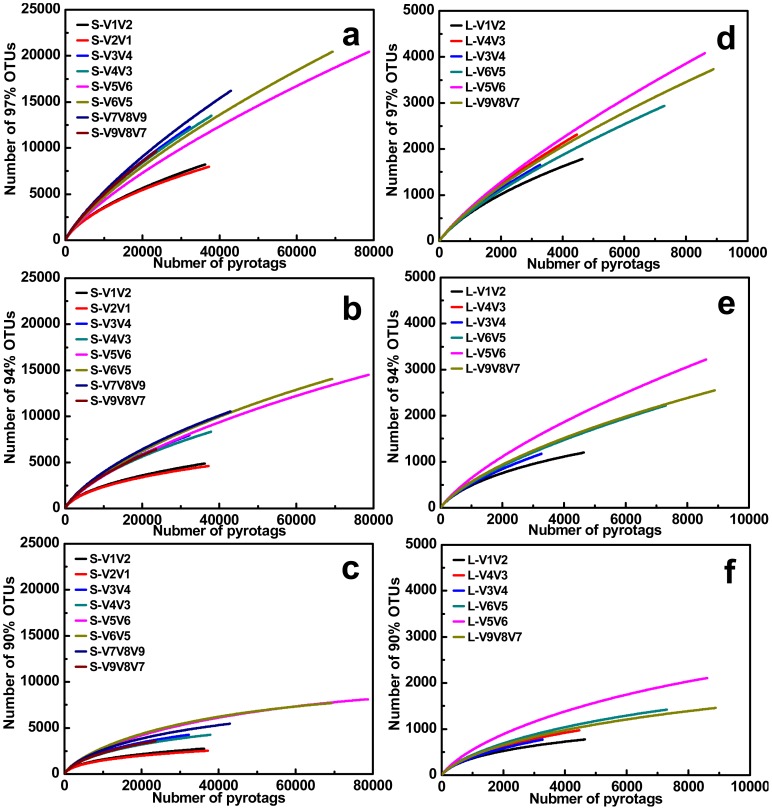
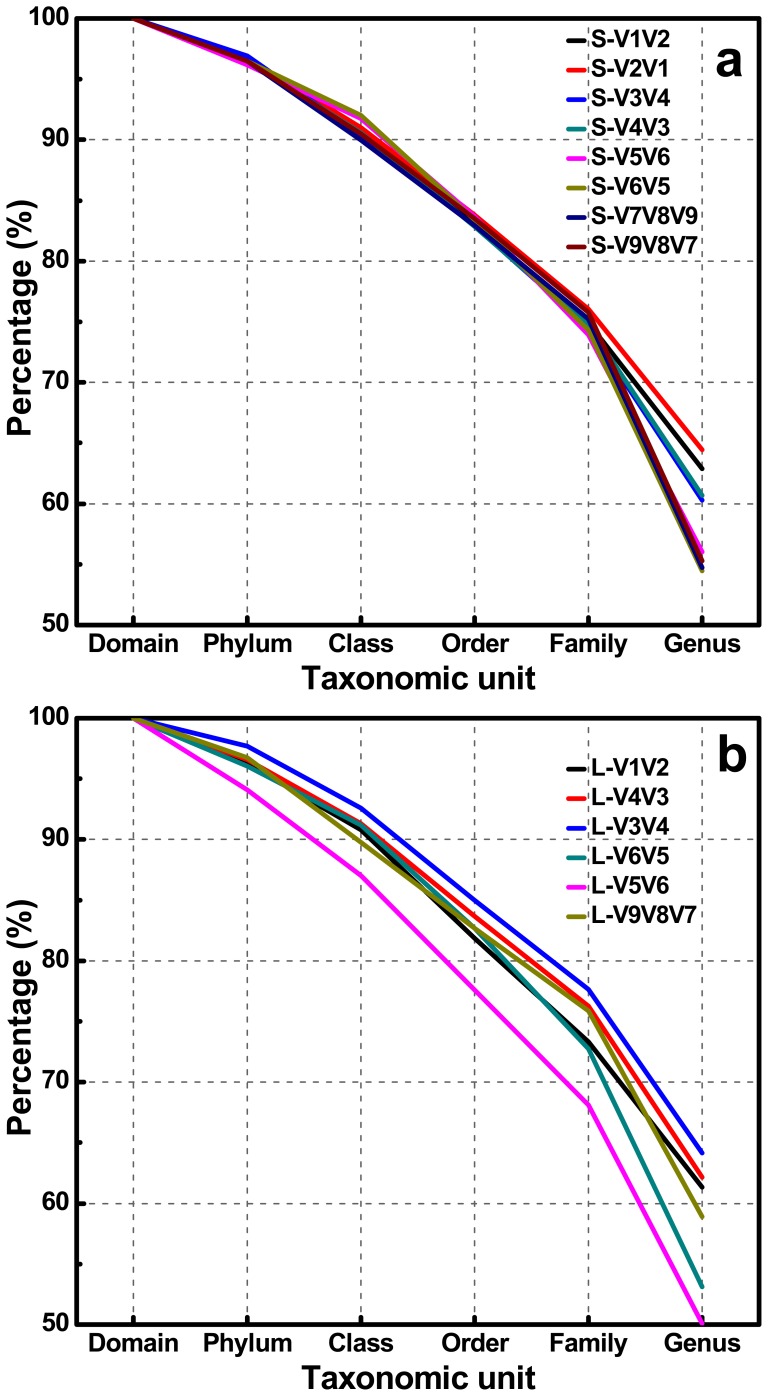
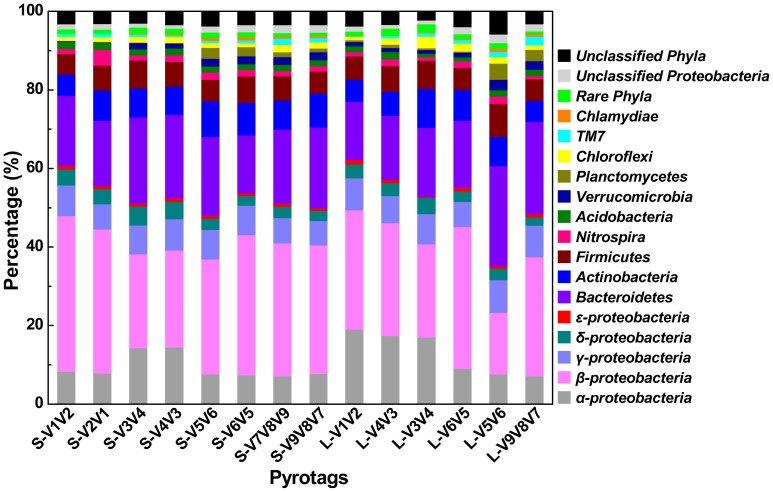
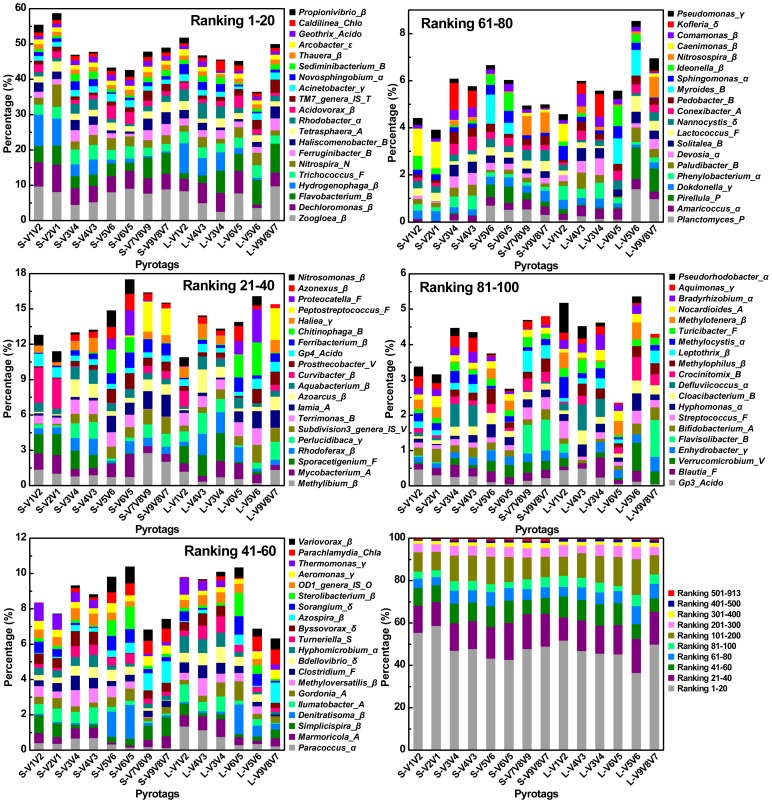
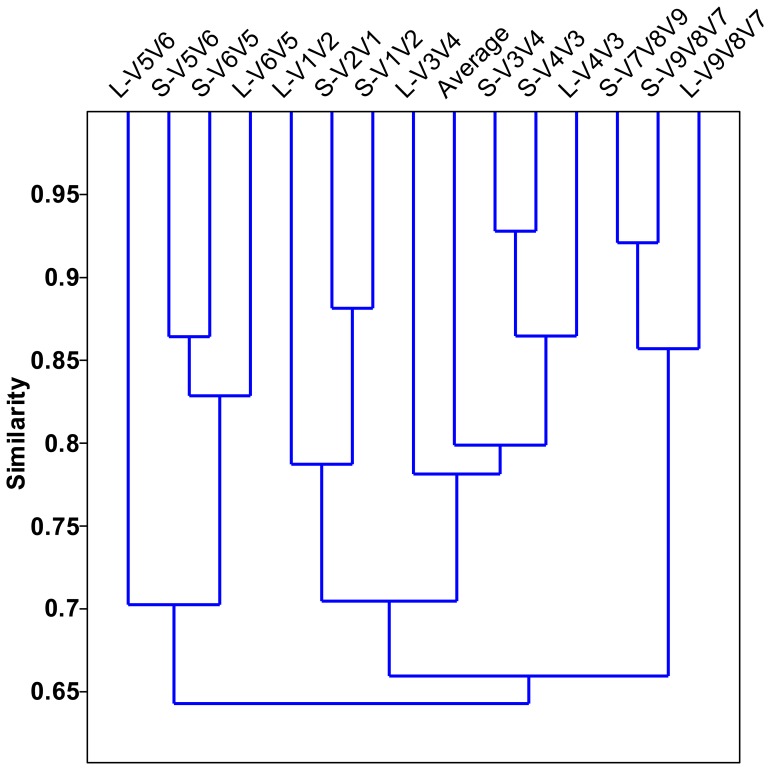
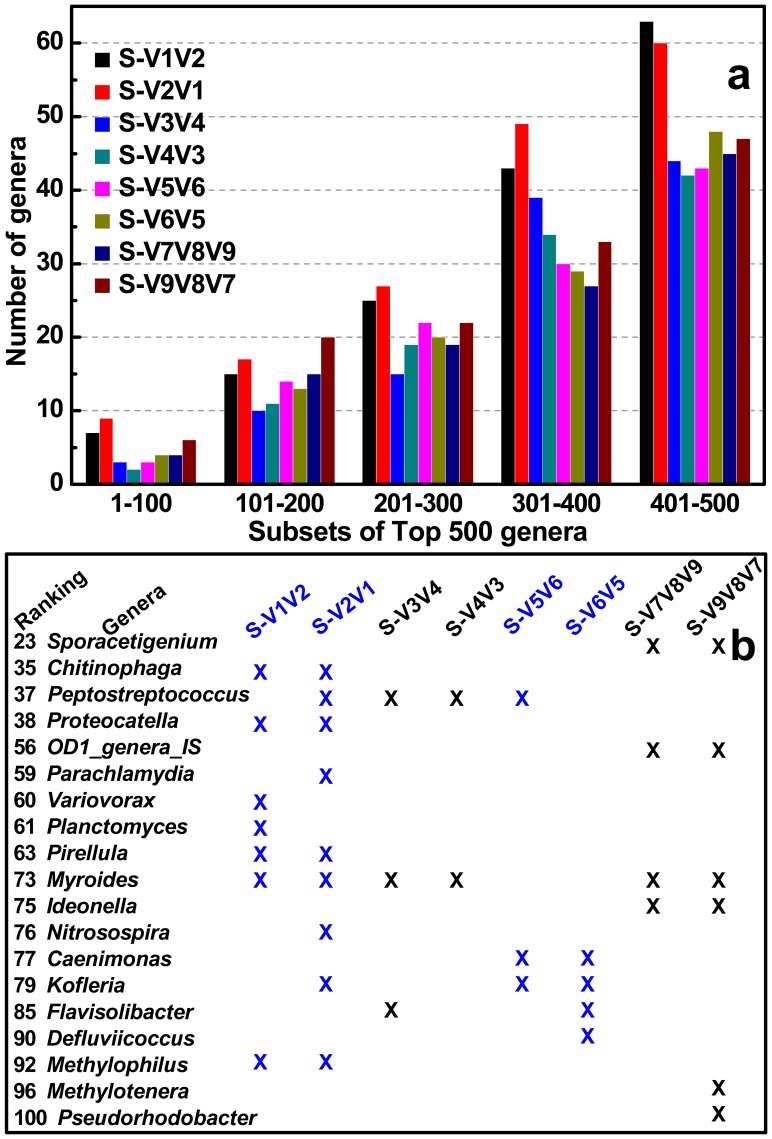
In recent years, PCR-based pyrosequencing of 16S rRNA genes has continuously increased our understanding of complex microbial communities in various environments of the Earth. However, there is always concern on the potential biases of diversity determination using different 16S rRNA gene primer sets and covered regions. Here, we first report how bacterial 16S rRNA gene pyrotags derived from a series of different primer sets resulted in the biased diversity metrics. In total, 14 types of pyrotags were obtained from two-end pyrosequencing of 7 amplicon pools generated by 7 primer sets paired by 1 of 4 forward primers (V1F, V3F, V5F, and V7F) and 1 of 4 reverse primers (V2R, V4R, V6R, and V9R), respectively. The results revealed that: i) the activated sludge exhibited a large bacterial diversity that represented a broad range of bacterial populations and served as a good sample in this methodology research; ii) diversity metrics highly depended on the selected primer sets and covered regions; iii) paired pyrotags obtained from two-end pyrosequencing of each short amplicon displayed different diversity metrics; iv) relative abundance analysis indicated the sequencing depth affected the determination of rare bacteria but not abundant bacteria; v) the primer set of V1F and V2R significantly underestimated the diversity of activated sludge; and vi) the primer set of V3F and V4R was highly recommended for future studies due to its advantages over other primer sets. All of these findings highlight the significance of this methodology research and offer a valuable reference for peer researchers working on microbial diversity determination.


Conflict of interest statement

Competing Interests: The authors have declared that no competing interests exist.

Figures

Figure 1
Figure 1. Schematic representation of experimental design employed in this study.
The full length of E. coli 16S rRNA gene was used as the reference scale. Fourteen blue arrow lines indicated all pyrotags analyzed in this study. S (L)-V1V2 represented the pyrotag contained 16S V1V2 region derived from a Short (Long) amplicon. Four small PCR fragments covered 16S V1V2, V3V4, V5V6, and V7V8V9 regions were defined as Short amplicons. The remainder three large PCR fragments targeted 16S regions of V1–V4, V3–V6, and V5–V9 were defined as Long amplicons.
Figure 2
Figure 2. Rarefaction curves of 97%, 94%, and 90% OTUs for eight S-type pyrotags (S-V1V2, S-V2V1, S-V3V4, S-V4V3, S-V5V6, S-V6V5, S-V7V8V9, and S-V9V8V7) and six L-type pyrotags (L-V1V2, L-V4V3, L-V3V4, L-V6V5, L-V5V6, and L-V9V8V7), respectively.
Figure 3
Figure 3. S-type and L-type pyrotags classified into six different taxonomic units assigned by RDP Classifier at 50% bootstrap cutoffs.
The equal sequencing depths of 23609 reads and 3276 reads were subsampled to make fair comparison for S-type and L-type pyrotags, respectively.
Figure 4
Figure 4. Relative abundance at phylum or class (only for Proteobacteria) level assigned by RDP Classifier at 50% confidence thresholds.
The extremely low percentage phyla of ‘Aquificae, BRC1, Caldiserica, Chlorobi, Cyanobacteria, Deferribacteres, Deinococcus-Thermus, Fibrobacteres, Fusobacteria, Gemmatimonadetes, Lentisphaerae, OD1, OP10, OP11, Spirochaetes, SR1, Synergistetes, Tenericutes, Thermotogae, and WS3’ were not displayed in detail and summarized as rare phyla.
Figure 5
Figure 5. Relative abundance of Top 100 genera assigned by RDP Classifier at 50% bootstrap cutoffs and percentage of ten divided subsets for all ranked genera.
The genera were ranked based on the average relative abundance for each pyrotag. All rankings in each subfigure were sorted from high to low level and displayed in the right column from bottom to top accordingly. For instance, Ranking 1, 2, 3, …, and 100 represented genera of Zoogloea, Dechloromonas, Flavobacteria, …, and Pseudorhodobacter, respectively. Greek letters of α, β, γ, δ, or ε modified in the terminus of genus name represented classes of α-, β-, γ-, δ-, or ε- Proteobacteria, respectively. Similarly, A, Acido, B, Chla, Chlo, F, N, O, P, S, T, and V, indicated phyla of Actinobacteria, Acidobacteria, Bacteroidetes, Chlamydiae, Chloroflexi, Firmicutes, Nitrospira, OD1, Planctomycetes, Spirochaetes, TM7, and Verrucomicrobia, respectively. The total number of these Top 100 genera assigned into the phyla/class was summarized as: α (13), β (27), γ (9), δ (5), ε (1), A (9), Acido (3), B (13), Chla (1), Chlo (1), F (9), N (1), O (1), P (2), S (1), T (1), and V (3).
Figure 6
Figure 6. Cluster analysis of all pyrotags based on relative abundance of Top 100 genera.
‘Average’ represented the average relative abundance. The Past statistical software was used to calculate the distance using Bray-Curtis similarity measure.
Figure 7
Figure 7. Statistical data of Top 500 (a) and Top 100 (b) genera not detected for each S-type pyrotag.
Every subset of 100 genera was divided and calculated independently (a). Genera detected by all S-type pyrotags simultaneously were not listed and the not detected genera were all marked with crosses (b).

References

    1. Handelsman J (2004) Metagenomics: application of genomics to uncultured microorganisms. Microbiol Mol Biol Rev 68: 669–685. - PMC - PubMed
    1. Muyzer G, de Waal EC, Uitterlinden AG (1993) Profiling of complex microbial populations by denaturing gradient gel electrophoresis analysis of polymerase chain reaction-amplified genes coding for 16S rRNA. Appl Environ Microbiol 59: 695–700. - PMC - PubMed
    1. Liu WT, Marsh TL, Cheng H, Forney LJ (1997) Characterization of microbial diversity by determining terminal restriction fragment length polymorphisms of genes encoding 16S rRNA. Appl Environ Microbiol 63: 4516–4522. - PMC - PubMed
    1. Wagner M, Noguera DR, Juretschko S, Rath G, Koops HP, et al. (1998) Combining fluorescent in situ hybridization (FISH) with cultivation and mathematical modeling to study population structure and function of ammonia-oxidizing bacteria in activated sludge. Water Sci Technol 37: 441–449.
    1. He ZL, Van Nostrand JD, Zhou JZ (2012) Applications of functional gene microarrays for profiling microbial communities. Curr Opin Biotech 23: 460–466. - PubMed

Publication types