. 2013;8(1):e53662.
doi: 10.1371/journal.pone.0053662. Epub 2013 Jan 14.

The protective effect of glycyrrhetinic acid on carbon tetrachloride-induced chronic liver fibrosis in mice via upregulation of Nrf2

Affiliations

The protective effect of glycyrrhetinic acid on carbon tetrachloride-induced chronic liver fibrosis in mice via upregulation of Nrf2

Shaoru Chen et al. PLoS One. 2013.

Abstract

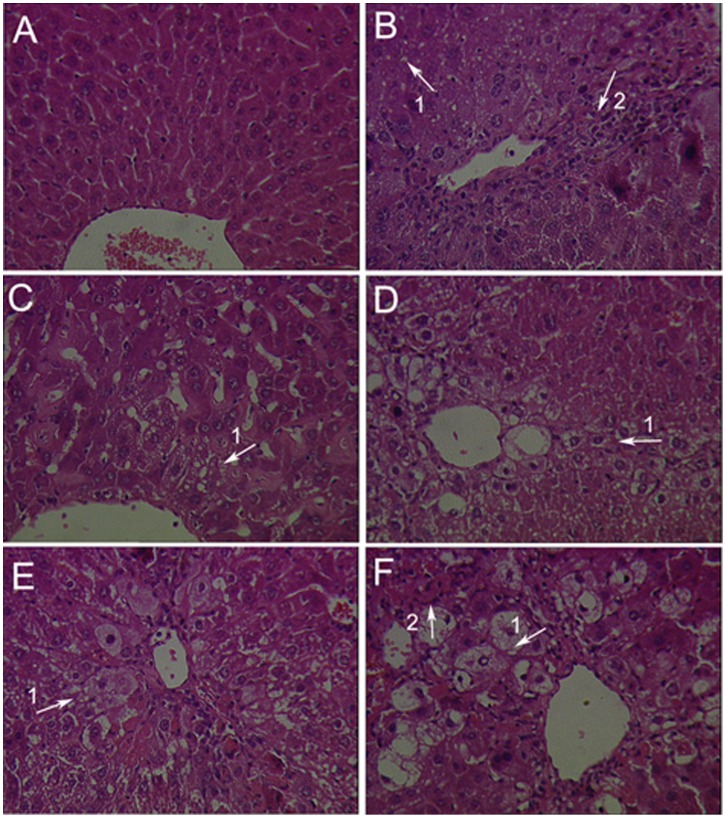
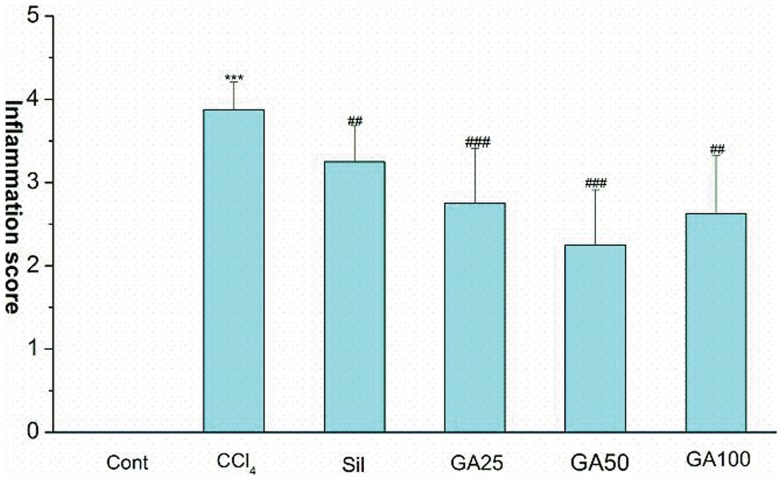
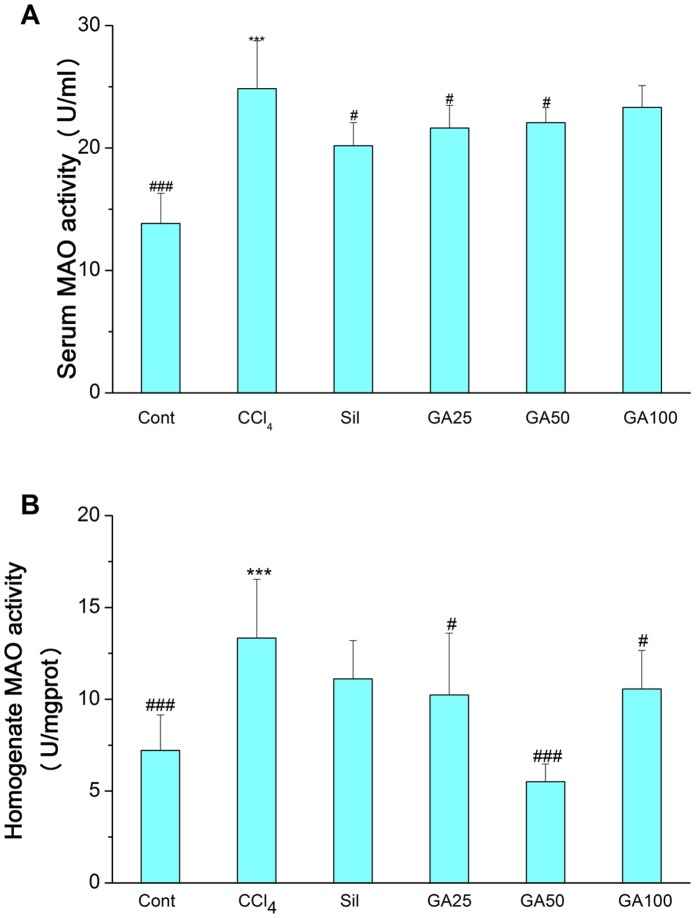
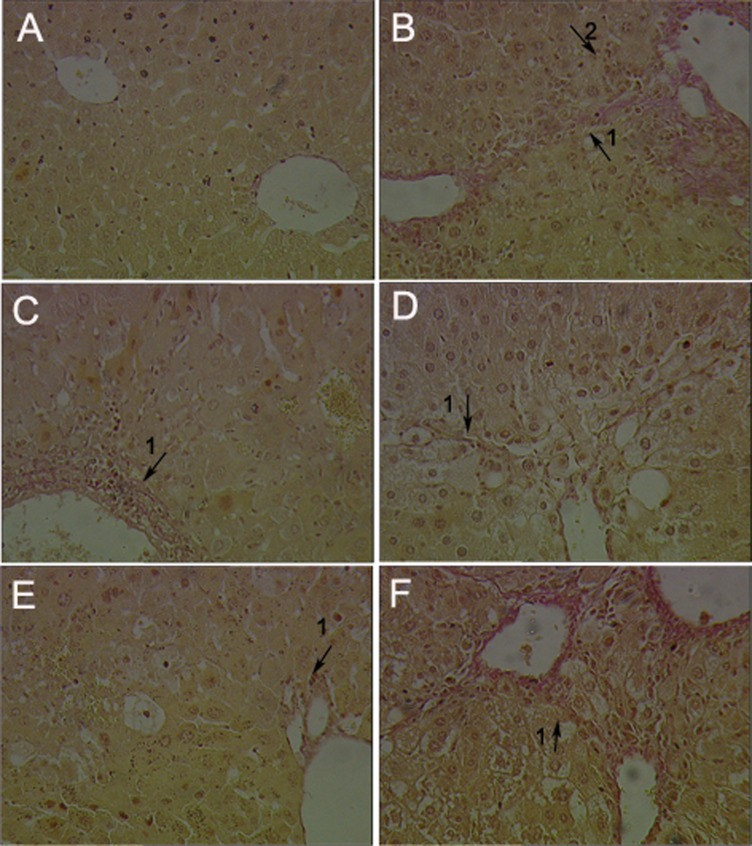
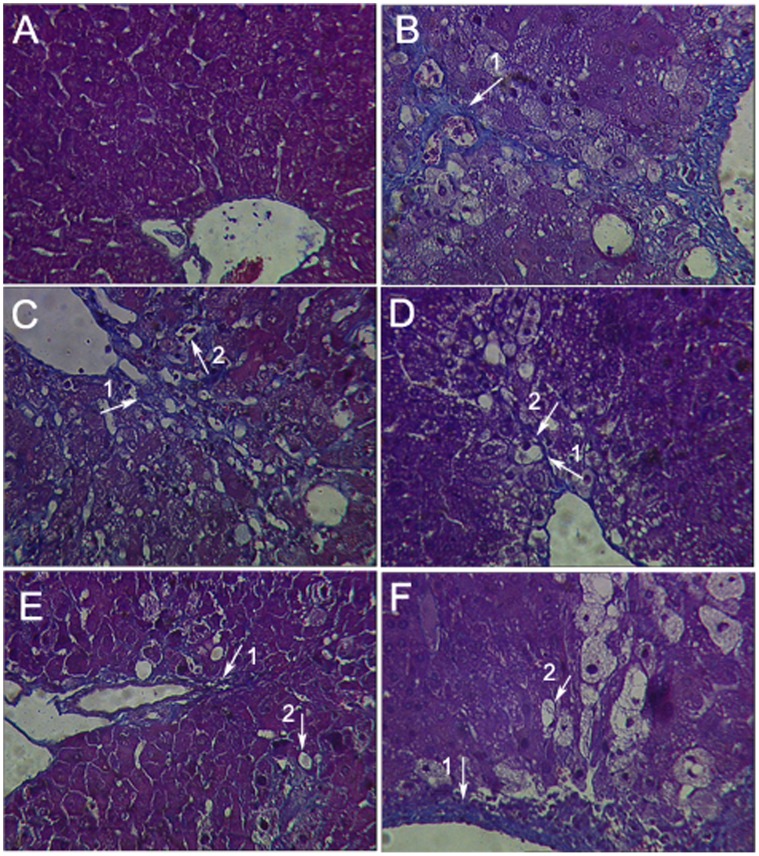
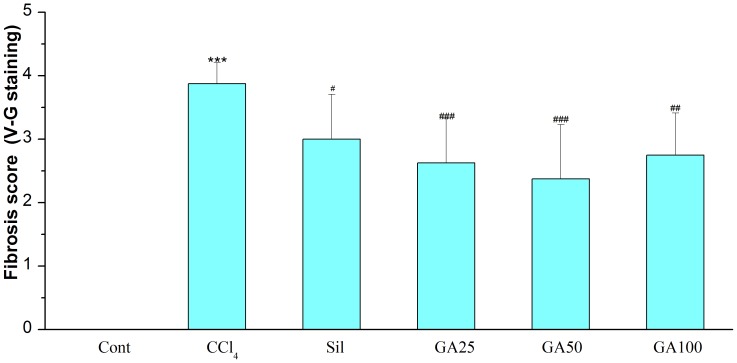
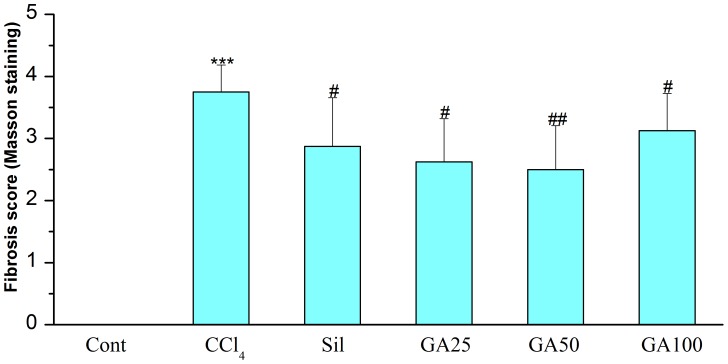
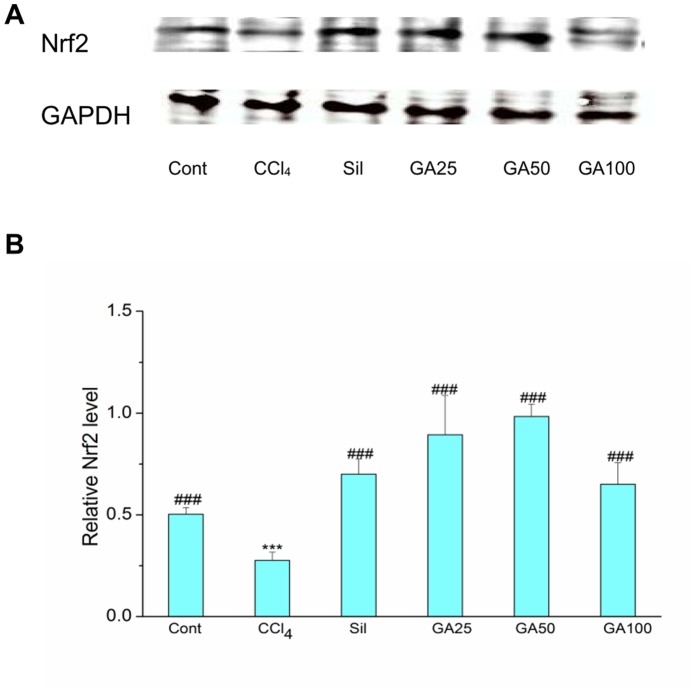
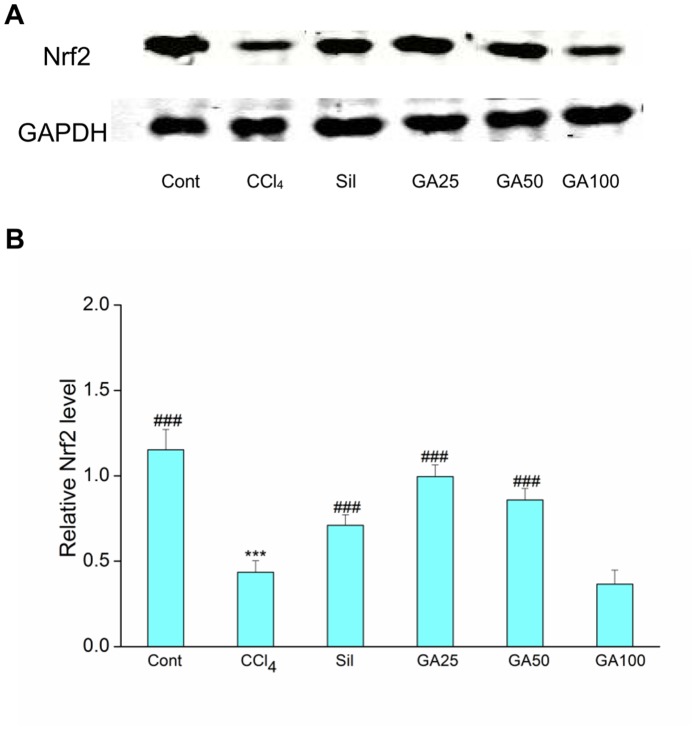
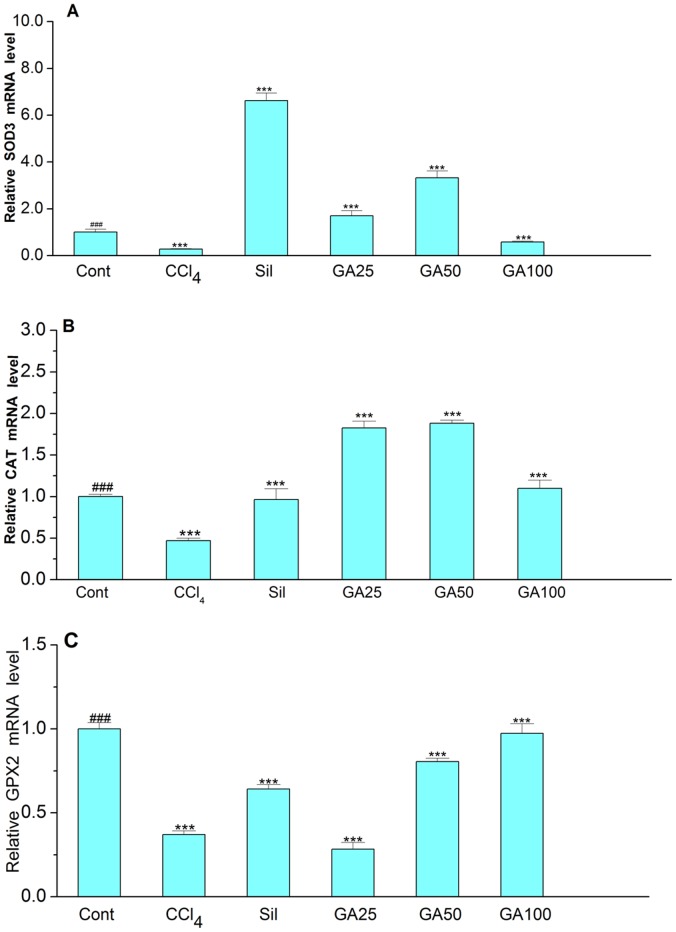
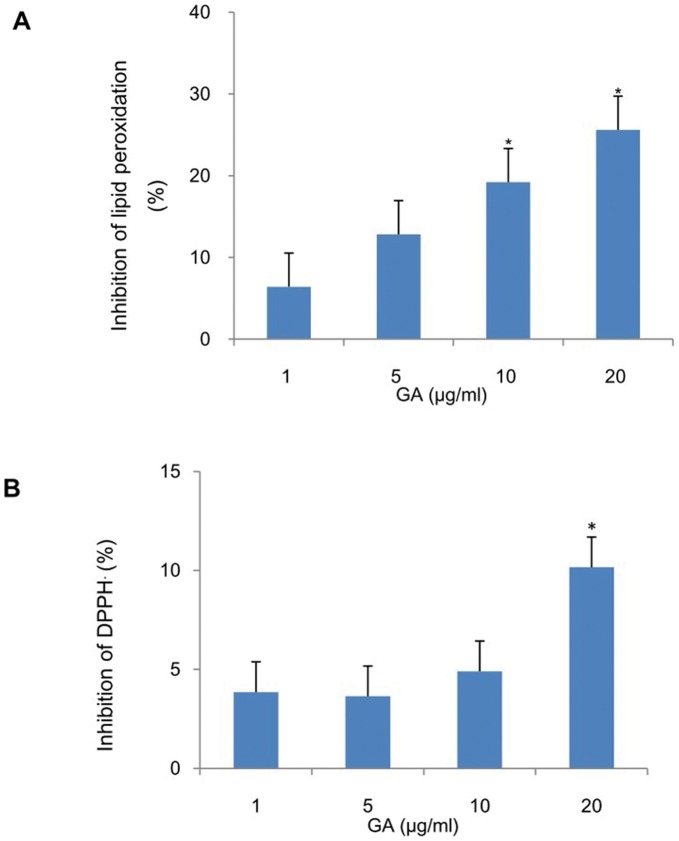
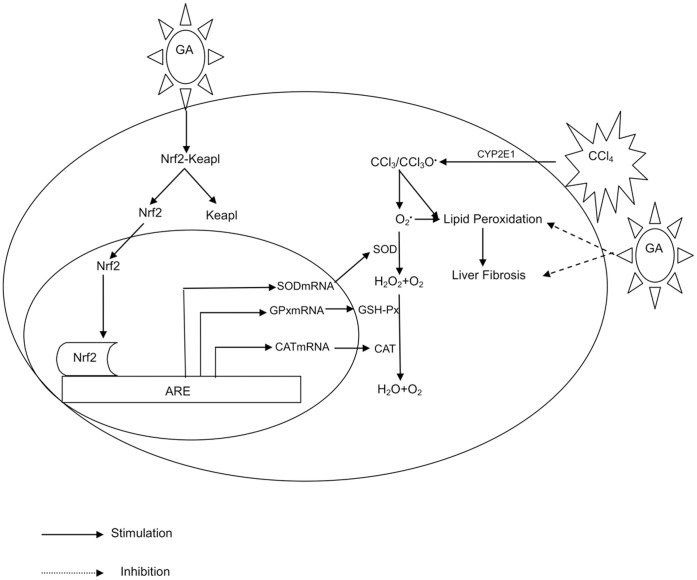
This study was designed to investigate the potentially protective effects of glycyrrhetinic acid (GA) and the role of transcription factor nuclear factor-erythroid 2(NF-E2)-related factor 2 (Nrf2) signaling in the regulation of Carbon Tetrachloride (CCl(4))-induced chronic liver fibrosis in mice. The potentially protective effects of GA on CCl(4)-induced chronic liver fibrosis in mice were depicted histologically and biochemically. Firstly, histopathological changes including regenerative nodules, inflammatory cell infiltration and fibrosis were induced by CCl(4).Then, CCl(4) administration caused a marked increase in the levels of serum aminotransferases (GOT, GPT), serum monoamine oxidase (MAO) and lipid peroxidation (MDA) as well as MAO in the mice liver homogenates. Also, decreased nuclear Nrf2 expression, mRNA levels of its target genes such as superoxide dismutase 3 (SOD3), catalase (CAT), glutathione peroxidase 2 (GPX2), and activity of cellular antioxidant enzymes were found after CCl(4) exposure. All of these phenotypes were markedly reversed by the treatment of the mice with GA. In addition, GA exhibited the antioxidant effects in vitro by on FeCl(2)-ascorbate induced lipid peroxidation in mouse liver homogenates, and on DPPH scavenging activity. Taken together, these results suggested that GA can protect the liver from oxidative stress in mice, presumably through activating the nuclear translocation of Nrf2, enhancing the expression of its target genes and increasing the activity of the antioxidant enzymes. Therefore, GA may be an effective hepatoprotective agent and viable candidate for treating liver fibrosis and other oxidative stress-related diseases.


Conflict of interest statement

Competing Interests: The authors have declared that no competing interests exist.

Figures

Figure 1
Figure 1. Effects of GA on histopathological changes by CCl4 in mice were evaluated in sections stained with hematoxyline-eosin.
Mice in all groups were treated as the same with the front method. The animals were sacrificed 24 h after the last CCl4 administration and the liver was removed, fixed and embedded in paraffin. Sections were stained with hematoxyline-eosin (H-E, 200×). (A) Liver tissue of a control mouse. (B) Liver tissue of a mouse treated with CCl4, presenting severe hepatocyte necrosis with neutrophil clusters and mononuclear cells infiltration (arrow 2) around the portal vein. (C) Liver tissue of a mouse treated with silymarin (100 mg/kg, i.g.), showing mild hepatocyte necrosis with inflammatory cell infiltration and steatosis (arrow 1) around the portal vein. (D) Liver tissue of a mouse treated with GA (25 mg/kg, i.g.), showing moderate hepatocyte necrosis with inflammatory cell infiltration and moderate steatosis (arrow 1). (E) Liver tissue of a mouse treated with GA (50 mg/kg, i.g.), showing mild steatosis (arrow 1) around centrilobular and midzone region. (F) Liver tissue of a mouse treated with GA (100 mg/kg, i.g.), showing mild hepatocyte necrosis with inflammatory cell infiltration (arrow 2) and severe steatosis (arrow 1).
Figure 2
Figure 2. The inflammation score was evaluated in the livers of surviving animals by certified pathologist in a blinded fashion.
Cont, normal control; CCl4, CCl4 alone; Sil, CCl4+100 mg/kg silymarin; GA25, CCl4+25 mg/kg GA; GA50, CCl4+50 mg/kg GA; GA100, CCl4+100 mg/kg GA. Datas are presented as the mean ± SD (n = 8) in each group. *** Significantly different from the control at p<0.001; ## Significantly different from the CCl4 at p<0.01; ### Significantly different from the CCl4at p<0.001.
Figure 3
Figure 3. Effects of GA on serum and homogenate MAO changes by CCl4 in mice.
Mice in all groups were treated as the same with the front method. Liver fibrosis was determined by quantifying the serum activities of MAO (Fig. 3A) as well as liver homogenate MAO (Fig. 3B). Cont, normal control; CCl4, CCl4 alone; Sil, CCl4+100 mg/kg silymarin; GA25, CCl4+25 mg/kg GA; GA50, CCl4+50 mg/kg GA; GA100, CCl4+100 mg/kg GA. Datas are presented as the mean± SD (n = 8) in each group. *** Significantly different from the control at p<0.001; # Significantly different from the CCl4 at p<0.05; ### Significantly different from the CCl4 at p<0.001.
Figure 4
Figure 4. Effects of GA on histopathological changes by CCl4 in mice were evaluated in sections stained with collagenous fiber.
Mice in all groups were treated as the same with the front method. The animals were sacrificed 24 h after the last CCl4 administration and the liver was removed, fixed and embedded in paraffin. Sections were stained with collagenous fiber (V-G, 200×). (A) Liver tissue of a control mouse. (B) Liver tissue of a mouse treated with CCl4, numerous fibrocytes appeared at the periphery of the lesions, and the collagen fibers became longer and thicker, presenting severe liver fibrosis and severe hepatocyte necrosis with inflammatory cell infiltration around the portal vein. (C) Liver tissue of a mouse treated with silymarin (100 mg/kg, i.g.), showing broad-develop septa and moderate liver fibrosis around the portal vein. (D) Liver tissue of a mouse treated with GA (25 mg/kg, i.g.), showing slender septa linking hepatic vein and mild hepatic fibrogenesis. (E) Liver tissue of a mouse treated with GA (50 mg/kg, i.g.), showing mild fibrosis around centrilobular and midzone region. (F) Liver tissue of a mouse treated with GA (100 mg/kg, i.g.), showing moderate fibrosis. Arrow 1 shows collagen fibers which was stained red, while arrow 2 shows inflammatory cell infiltration.
Figure 5
Figure 5. Effects of GA on histopathological changes by CCl4 in mice were evaluated in sections stained with Masson.
Mice in all groups were treated as the same with the front method. The animals were sacrificed 24 h after the last CCl4 administration and the liver was removed, fixed and embedded in paraffin. Sections were stained with Masson (200×). (A) Liver tissue of a control mouse. (B) Liver tissue of a mouse treated with CCl4, presenting severe liver fibrosis (arrow 1) and ballooning degeneration (arrow 2) aroud the portal vein. (C) Liver tissue of a mouse treated with silymarin (100 mg/kg, i.g.), presenting well-developed septa, showing moderate liver fibrosis (arrow 1) and hepatocyte necrosis with inflammatory cell (arrow 2) infiltration around the portal vein. (D) Liver tissue of a mouse treated with GA (25 mg/kg, i.g.), presenting slender septa linking hepatic veins, showing mild liver fibrosis (arrow 1) and severe sreatosis (arrow 2). (E) Liver tissue of a mouse treated with GA (50 mg/kg, i.g.), presenting slender septa, showing mild fibrosis (arrow 1) and sreatosis (arrow 2) around centrilobular and midzone region. (F) Liver tissue of a mouse treated with GA (100 mg/kg, i.g.), showing severe fibrosis (arrow 1) and sreatosis (arrow 2). Arrows show collagen fibers, which were stained blue (Masson trichrome staining).
Figure 6
Figure 6. Fibrosis score.
Fibrosis score was evaluated in the liver sections stained with V-G of surviving animals by certified pathologist in a blinded fashion. Cont, normal control; CCl4, CCl4 alone; Sil, CCl4+100 mg/kg silymarin; GA25, CCl4+25 mg/kg GA; GA50, CCl4+50 mg/kg GA; GA100, CCl4+100 mg/kg GA. Datas are presented as the mean ± SD (n = 8) in each group. *** Significantly different from the control at p<0.001; # Significantly different from the CCl 4 at p<0.05; ## Significantly different from the CCl4 at p<0.01; ### Significantly different from the CCl4 at p<0.001.
Figure 7
Figure 7. Fibrosis score.
Fibrosis score was evaluated in the liver sections stained with Masson of surviving animals by certified pathologist in a blinded fashion. Cont, normal control; CCl4, CCl4 alone; Sil, CCl4+100 mg/kg silymarin; GA25, CCl4+25 mg/kg GA; GA50, CCl4+50 mg/kg GA; GA100, CCl4+100 mg/kg GA. Datas are presented as the mean ± SD (n = 8) in each group. *** Significantly different from the control at p<0.001; # Significantly different from the CCl4 at p<0.05; ## Significantly different from the CCl4 at p<0.01.
Figure 8
Figure 8. Effects of GA on CCl4 bioactivation related Nrf2 expression in cytoplasm.
Mice in all groups were treated as the same with the front method. The animals were sacrificed 24 h after the last CCl4 administration. (A) The expression of Nrf2 and GAPDH in the liver microsomes was determined by western blotting. GAPDH was used as an internal control. (B) Quantitative analysis of the Nrf2 proteins. Cont, normal control; CCl4, CCl4 alone; Sil, CCl4+100 mg/kg silymarin; GA25, CCl4+25 mg/kg GA; GA50, CCl4+50 mg/kg GA; GA100, CCl4+100 mg/kg GA. Data are presented as the mean± SD for three independent experiments, performed in triplicate. *** Significantly different from the control at p<0.001; ### Significantly different from CCl4 at p<0.001.
Figure 9
Figure 9. Effects of GA on CCl4 bioactivation related Nrf2 expression in nuclear.
Mice in all groups were treated as the same with the front method. The animals were sacrificed 24 h after the last CCl4 administration. (A) The expression of Nrf2 and GAPDH in the liver microsomes was determined by western blotting. GAPDH was used as an internal control. (B) Quantitative analysis of the Nrf2 proteins. Cont, normal control; CCl4, CCl4 alone; Sil, CCl4+100 mg/kg silymarin; GA25, CCl4+25 mg/kg GA; GA50, CCl4+50 mg/kg GA; GA100, CCl4+100 mg/kg GA. Data are presented as the mean± SD for three independent experiments, performed in triplicate. *** Significantly different from the control at p<0.001; ### Significantly different from CCl4 at p<0.001.
Figure 10
Figure 10. Effect of GA on the mRNA expression levels of SOD3, CAT, and GPX2 genes.
Total RNA was extracted from mice liver tissues of GA-treated, CCl4-administrated, silymarin-treated, and control group animals after sacrificed. qRT-PCR was performed for analysis of mRNA expression levels of SOD3, CAT, and GPX2. (A) qRT-PCR results for analysis of SOD3 mRNA. (B) qRT-PCR results for analysis of CAT mRNA. (C) qRT-PCR results for analysis of GPX2 mRNA. Cont, normal control; CCl4, CCl4 alone; Sil, CCl4+100 mg/kg silymarin; GA25, CCl4+25 mg/kg GA; GA50, CCl4+50 mg/kg GA; GA100, CCl4+100 mg/kg GA. Data are presented as the mean± SD for three independent experiments, performed in triplicate.*** Significantly different from the control at p<0.001; ### Significantly different from CCl4 at p<0.001.
Figure 11
Figure 11. Inhibitory effects of GA on FeCl2-ascorbic acid stimulated lipid peroxidation and DPPH radical scavenging activity.
(A) The mouse liver homogenates were stimulated with FeCl2-ascorbic acid in the presence or absence of GA. The lipid peroxidation was measured as described in Section 2. Control value of lipid peroxidation in liver homogenates. (B) The DPPH radical scavenging activity was determined by the DPPH assay in the presence or absence of GA and the scavenging activity was measured as described in Section 2. The value is presented as the mean of the percentage inhibition±SD for three independent experiments, performed in triplicate. *Significantly different from the control (GA = 0 µg/ml) at p<0.05.
Figure 12
Figure 12. Potential mechanisms for anti-fibrosis mechanism of GA against CCl4-induced liver fibrosis in mice.

Similar articles

Cited by

References

    1. Kim HK, Li L, Lee HS, Park MO, Bilehal D, et al. (2009) Protective effects of Chlorella vulgaris Extract on carbon tetrachloride-induced acute liver injury in mice. Food Sci Biotechnol 18: 1186–1192.
    1. Guyton AC, Hall JE (2006) The liver as an organ. In: Guyton AC, Hall JE editors. Textbook of Medical Physiology. 11th ed. Philadelphia: Saunders Elsevier. 859–864.
    1. Friedman SL (2003) Hepatic fibrosis. In: Schiff ER, Sorrell MF, Maddrey WC editors. Schiff’s Diseases of the Liver. 9th ed. Philadelphia: Lippinocott Williams & Wilkins. 409–427.
    1. Poli G (2000) Pathogenesis of liverfibrosis: role of oxidative stress. Mol Aspects Med 21: 49–98. - PubMed
    1. Ivanov AV, Smirnova OA, Ivanova ON, Masalova OV, Kochetkov SN, et al. (2011) Hepatitis C Virus Proteins Activate NRF2/ARE Pathway by Distinct ROS Dependent and Independent Mechanisms in HUH7 Cells. PLoS ONE 6(9): e24957 doi:10.1371/journal.pone.0024957. - DOI - PMC - PubMed

Publication types

MeSH terms