. 2013;8(1):e53698.
doi: 10.1371/journal.pone.0053698. Epub 2013 Jan 14.

Gene expression deregulation in postnatal skeletal muscle of TK2 deficient mice reveals a lower pool of proliferating myogenic progenitor cells

Affiliations

Gene expression deregulation in postnatal skeletal muscle of TK2 deficient mice reveals a lower pool of proliferating myogenic progenitor cells

João A Paredes et al. PLoS One. 2013.

Abstract

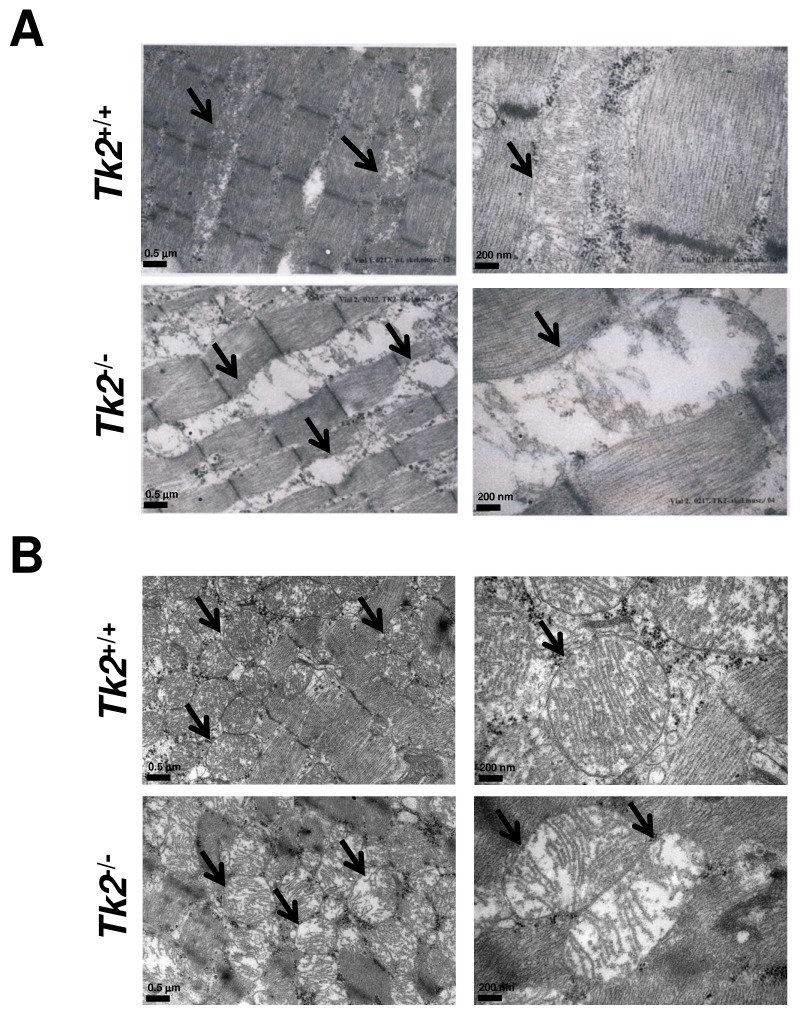
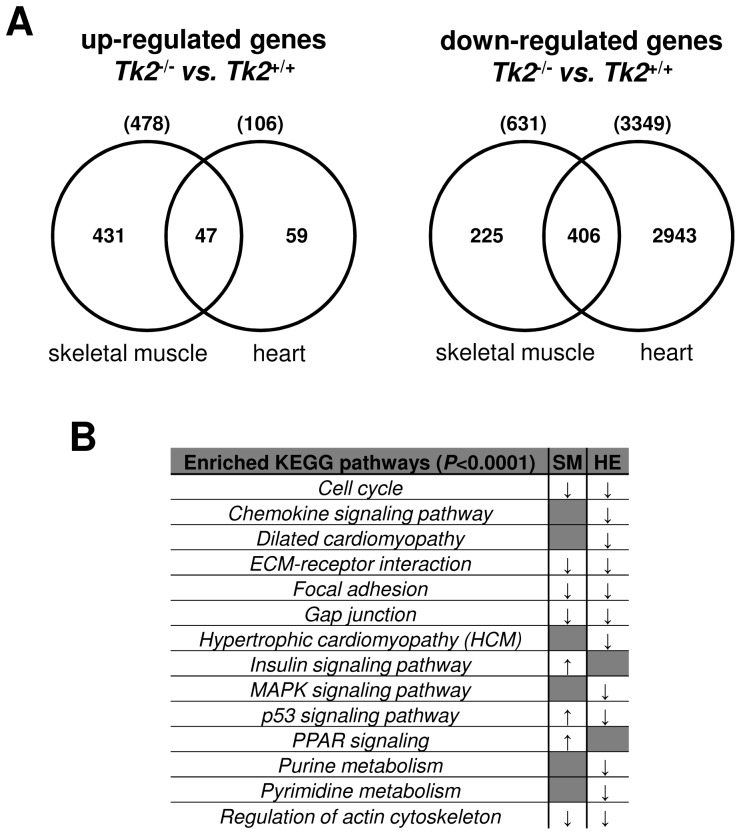
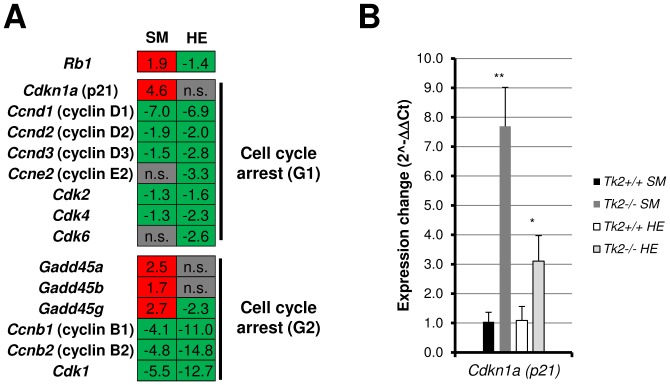
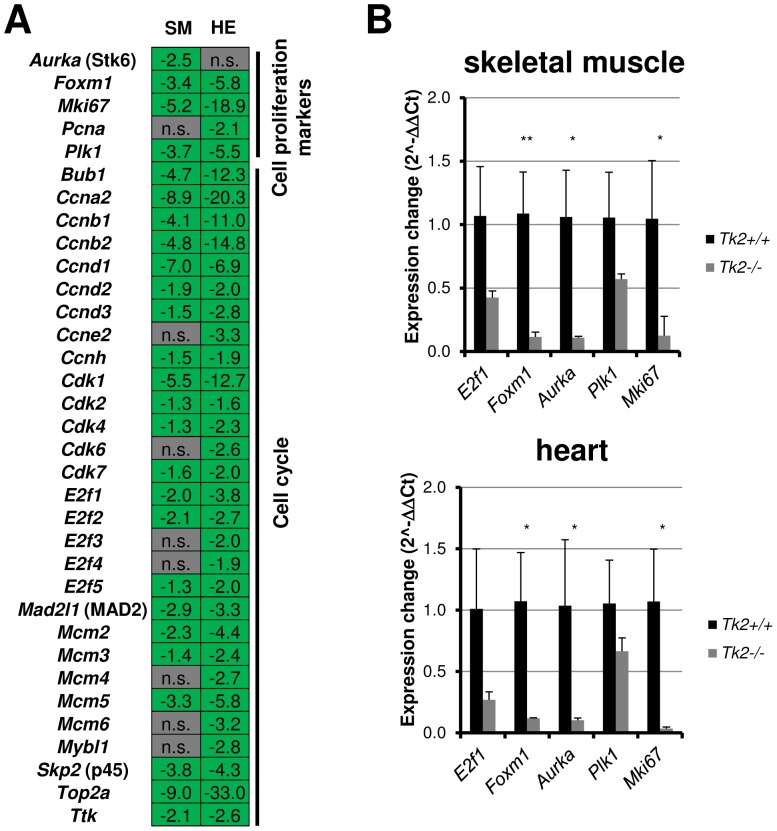
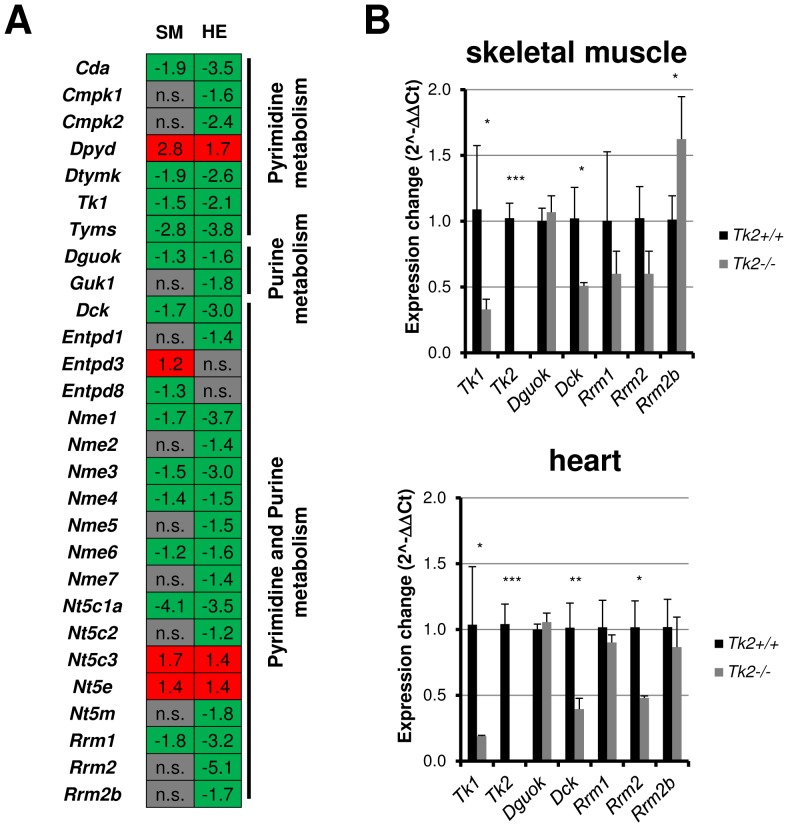
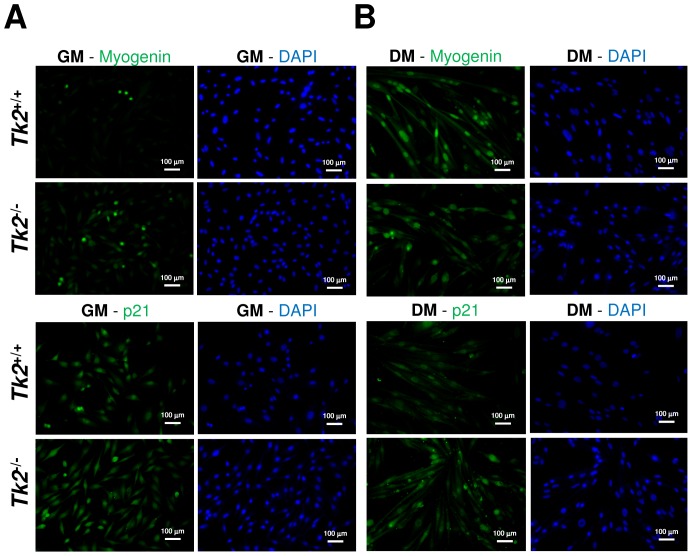
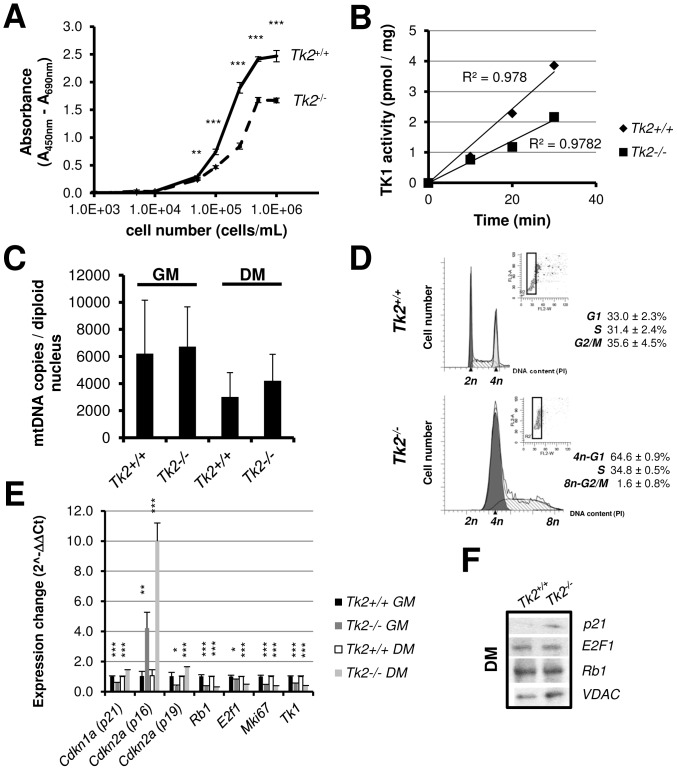
Loss of thymidine kinase 2 (TK2) causes a heterogeneous myopathic form of mitochondrial DNA (mtDNA) depletion syndrome (MDS) in humans that predominantly affects skeletal muscle tissue. In mice, TK2 deficiency also affects several tissues in addition to skeletal muscle, including brain, heart, adipose tissue, kidneys and causes death about 3 weeks after birth. We analysed skeletal muscle and heart muscle tissues of Tk2 knockout mice at postnatal development phase and observed that TK2 deficient pups grew slower and their skeletal muscles appeared significantly underdeveloped, whereas heart was close to normal in size. Both tissues showed mtDNA depletion and mitochondria with altered ultrastructure, as revealed by transmission electron microscopy. Gene expression microarray analysis showed a strong down-regulation of genes involved in cell cycle and cell proliferation in both tissues, suggesting a lower pool of undifferentiated proliferating cells. Analysis of isolated primary myoblasts from Tk2 knockout mice showed slow proliferation, less ability to differentiate and signs of premature senescence, even in absence of mtDNA depletion. Our data demonstrate that TK2 deficiency disturbs myogenic progenitor cells function in postnatal skeletal muscle and we propose this as one of the causes of underdeveloped phenotype and myopathic characteristic of the TK2 deficient mice, in addition to the progressive mtDNA depletion, mitochondrial damage and respiratory chain deficiency in post-mitotic differentiated tissue.


Conflict of interest statement

Competing Interests: The authors have declared that no competing interests exist.

Figures

Figure 1
Figure 1. Tk2 +/+ and Tk2 −/− mice skeletal muscle and heart mitochondria ultrastructure.
Transmission electron microscopy images of skeletal muscle (A) and heart (B) sections isolated from wild-type (Tk2 +/+) and Tk2 knockout (Tk2 −/−) 14 days-old mice. Mitochondria are indicated with solid arrows in the pictures.
Figure 2
Figure 2. Gene expression deregulation in 11 days-old Tk2 knockout (Tk2 −/−) skeletal muscle and heart comparing to wild-type (Tk2 +/+) tissues from mice with the same age.
A) Considering only genes with at least 2.0-fold variation in expression and with a statistically significant P-value (P-value<0.05), the number of up- and down-regulated genes in Tk2 −/− skeletal muscle and heart, comparing to the same tissues in Tk2 +/+ mice, are indicated. The numbers of similar genes that were up- or down-regulated in both analyses are indicated in the intersection of the Venn diagrams. B) In the group of differentially expressed genes in skeletal muscle and heart, statistically significant enrichment of genes belonging to specific KEGG pathways was detected using the Pathway analysis from the Expander software (see methods). Pathways significantly enriched in the group of up-regulated genes are marked with an upwards arrow (↑) and those enriched in the group of down-regulated genes are marked with a downwards arrow (↓). SM and HE indicate each of the gene expression analyses done, in skeletal muscle and in heart, respectively.
Figure 3
Figure 3. Gene expression variation of some genes involved in cell cycle arrest in both skeletal muscle and heart of 11 days-old Tk2 knockout (Tk2 −/−) mice.
A) Expression values obtained in the microarray analysis for some genes involved in cell cycle arrest at G1 or G2. SM and HE refer to each of the gene expression analyses made, in skeletal muscle and in heart. n.s. indicates that the gene is not significantly up- or down-regulated in the analysis. B) Expression of Cdkn1a (p21) was also analysed by Real-time qPCR for both tissues. The P-values for statistical comparisons (two-tailed unpaired Student's t-test) between Tk2 +/+ and Tk2 −/− tissues are shown - *P<0.05; **P<0.01.
Figure 4
Figure 4. Cell cycle and cell proliferation related genes expression variation in both skeletal muscle and heart of 11 days-old Tk2 knockout (Tk2 −/−) mice.
A) Gene variation obtained by microarray analysis. SM and HE refer to each of the gene expression analyses made, in skeletal muscle and in heart. n.s. indicates that the gene is not significantly up- or down-regulated in the analysis. B) Expression of some genes was also analysed by Real-time qPCR. The P-values for statistical comparisons (two-tailed unpaired Student's t-test) between Tk2 +/+ and Tk2 −/− tissues are shown - *P<0.05; **P<0.01.
Figure 5
Figure 5. dNTP pool maintenance related genes expression variation in both skeletal muscle and heart of 11 days-old Tk2 knockout (Tk2 −/−) mice.
A) Gene variation obtained by microarray analysis. SM and HE refer to each of the gene expression analyses made, in skeletal muscle and in heart. n.s. indicates that the gene is not significantly up- or down-regulated in the analysis. B) Expression of deoxyribonucleoside kinases genes was also analysed by Real-time qPCR. The P-values for statistical comparisons (two-tailed unpaired Student's t-test) between Tk2 +/+ and Tk2 −/− tissues are shown - *P<0.05; **P<0.01; ***P<0.001.
Figure 6
Figure 6. Tk2 +/+ and Tk2 −/− primary myoblasts culture and differentiation.
A) Primary myoblasts were isolated from 1–2 days old wild-type (Tk2 +/+) and Tk2 knockout (Tk2 −/−) pups and cultured according to standard methods. Cultured primary myoblasts in F-10/DMEM-based primary myoblast growth medium (GM, 20% fetal bovine serum) were analysed by immunocytochemistry using anti-myogenin and anti-p21 antibodies (Abcam). Nuclei have been stained with DAPI (Sigma). B) Isolated primary myoblasts capacity to differentiate in myotubes was tested by changing them to differentiation medium (DM - DMEM with 5% horse serum). Immunocytochemistry was performed using anti-myogenin and anti-p21 antibodies (Abcam). Nuclei have been stained with DAPI (Sigma). Pictures were taken 2 days after myoblasts have been transferred to DM.
Figure 7
Figure 7. Tk2 +/+ and Tk2 −/− primary myoblasts characterization.
A) Growth of Tk2 +/+ and Tk2 −/− myoblasts in F-10/DMEM-based primary myoblast growth medium was determined by XTT proliferation assay (see methods). Data points represent mean ± SD of measurements obtained from 4 independent myoblast cultures (n = 4). The P-values for statistical comparisons (two-tailed unpaired Student's t-test) between Tk2 +/+ and Tk2 −/− data points are shown - **P<0.01; ***P<0.001. B) Thymidine kinase activity measured in both Tk2 +/+ and Tk2 −/− cultured myoblasts (n = 2). C) mtDNA copy number of Tk2 +/+ and Tk2 −/− cultured myoblasts was measured by Real-time PCR in growth (GM) and differentiation conditions (DM, 8 days). D) Flow cytometry analysis of Tk2 +/+ and Tk2 −/− myoblasts cell cycle, 24 hours after cells have been plated. Data were obtained from 3 independent experiments (n = 3) and were analysed using the ModFit LT software, in order to obtain the percentages of cells in G1, S and G2/M cell cycle phases. E) Expression of several genes in Tk2 +/+ and Tk2 −/− growing myoblasts (GM) and differentiated myotubes (DM, 6 days) analysed by Real-time qPCR. The P-values for statistical comparisons (two-tailed unpaired Student's t-test) between Tk2 +/+ and Tk2 −/− cells are shown - *P<0.05; **P<0.01; ***P<0.001. F) Western-blot analysis of the expression of p21, E2F1, Rb1 and VDAC proteins in Tk2 +/+ and Tk2 −/− differentiated myotubes (DM, 6days).

Similar articles

Cited by

References

    1. Berk AJ, Clayton DA (1973) A genetically distinct thymidine kinase in mammalian mitochondria. Exclusive labeling of mitochondrial deoxyribonucleic acid. J Biol Chem 248: 2722–2729. - PubMed
    1. Bogenhagen D, Clayton DA (1976) Thymidylate nucleotide supply for mitochondrial DNA synthesis in mouse L-cells. Effect of 5-fluorodeoxyuridine and methotrexate in thymidine kinase plus and thymidine kinase minus cells. J Biol Chem 251: 2938–2944. - PubMed
    1. Leanza L, Ferraro P, Reichard P, Bianchi V (2008) Metabolic interrelations within guanine deoxynucleotide pools for mitochondrial and nuclear DNA maintenance. J Biol Chem 283: 16437–16445. - PubMed
    1. Pontarin G, Gallinaro L, Ferraro P, Reichard P, Bianchi V (2003) Origins of mitochondrial thymidine triphosphate: dynamic relations to cytosolic pools. Proc Natl Acad Sci U S A 100: 12159–12164. - PMC - PubMed
    1. Rampazzo C, Miazzi C, Franzolin E, Pontarin G, Ferraro P, et al. (2010) Regulation by degradation, a cellular defense against deoxyribonucleotide pool imbalances. Mutat Res 703: 2–10. - PubMed

Publication types

MeSH terms