. 2013;8(1):e54067.
doi: 10.1371/journal.pone.0054067. Epub 2013 Jan 16.

Low-power laser irradiation suppresses inflammatory response of human adipose-derived stem cells by modulating intracellular cyclic AMP level and NF-κB activity

Affiliations

Low-power laser irradiation suppresses inflammatory response of human adipose-derived stem cells by modulating intracellular cyclic AMP level and NF-κB activity

Jyun-Yi Wu et al. PLoS One. 2013.

Abstract

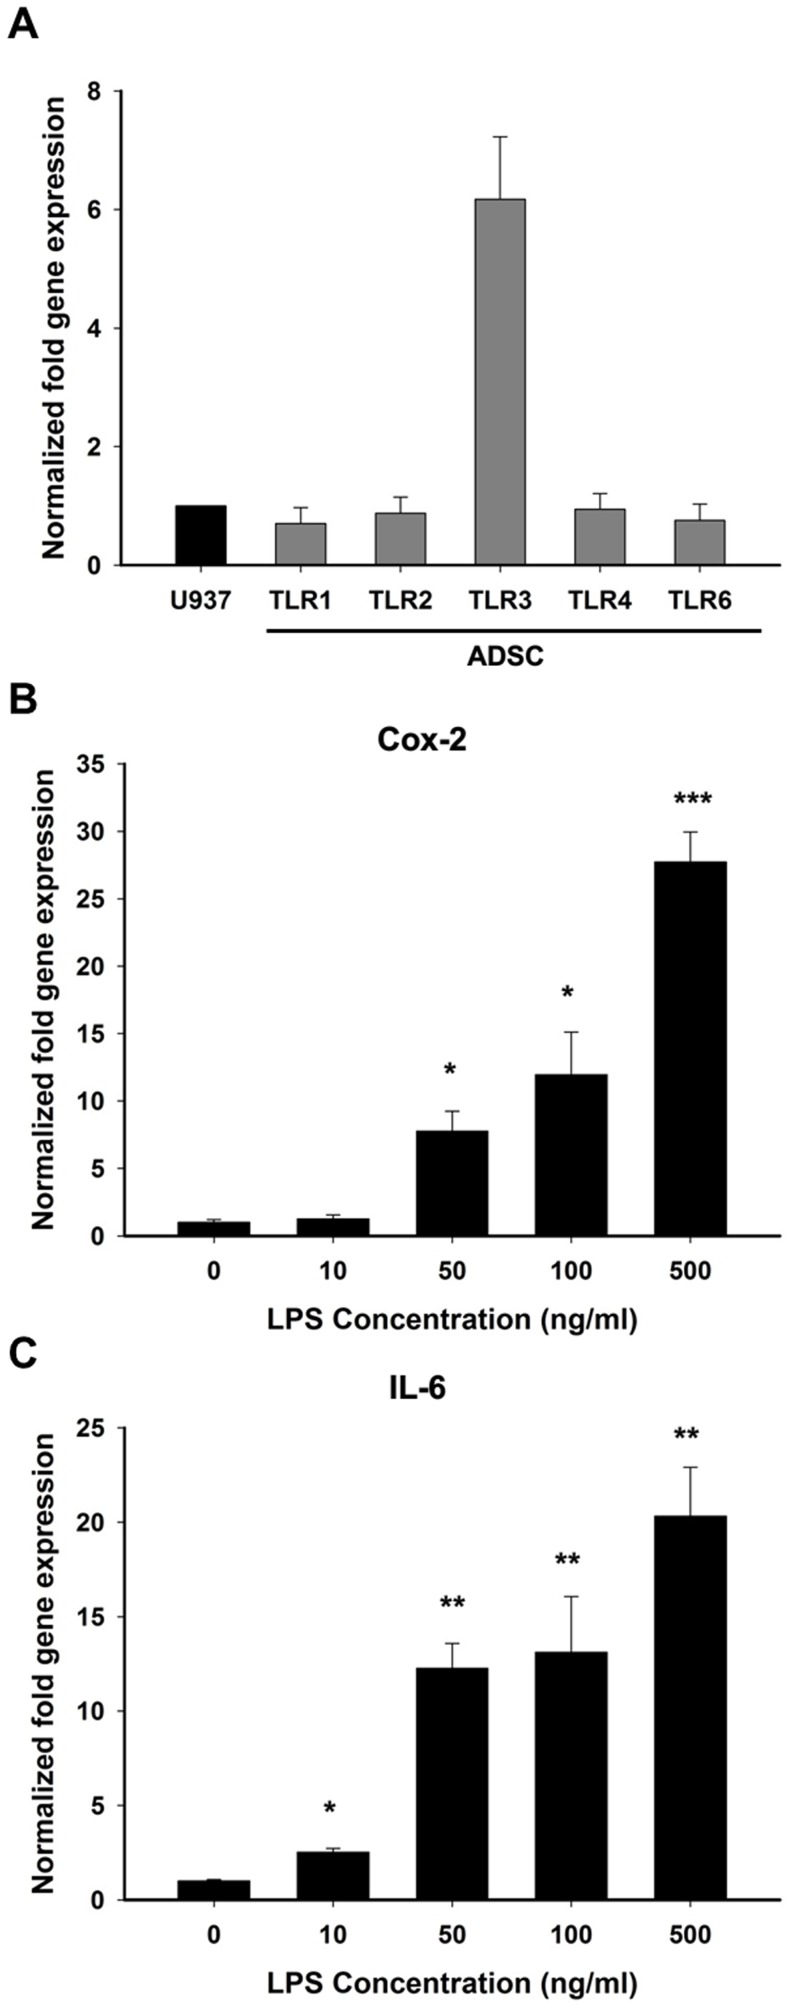
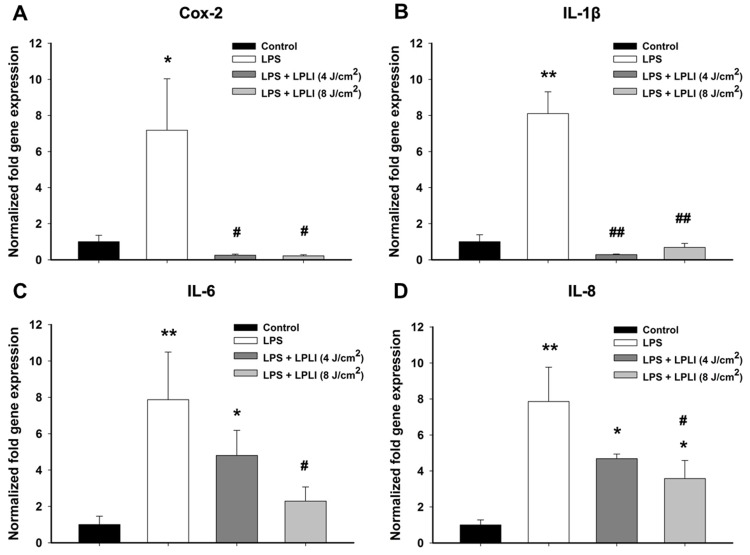
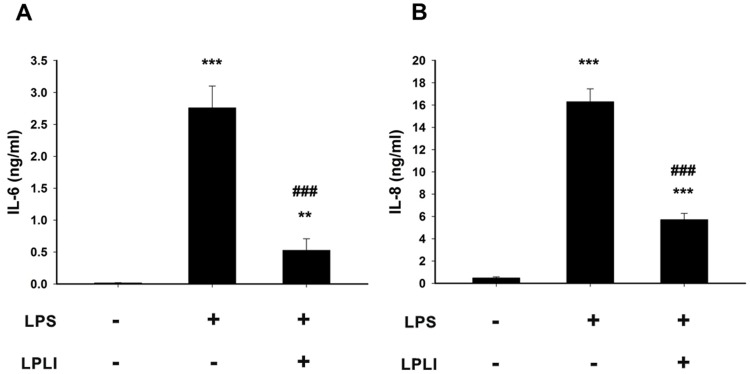
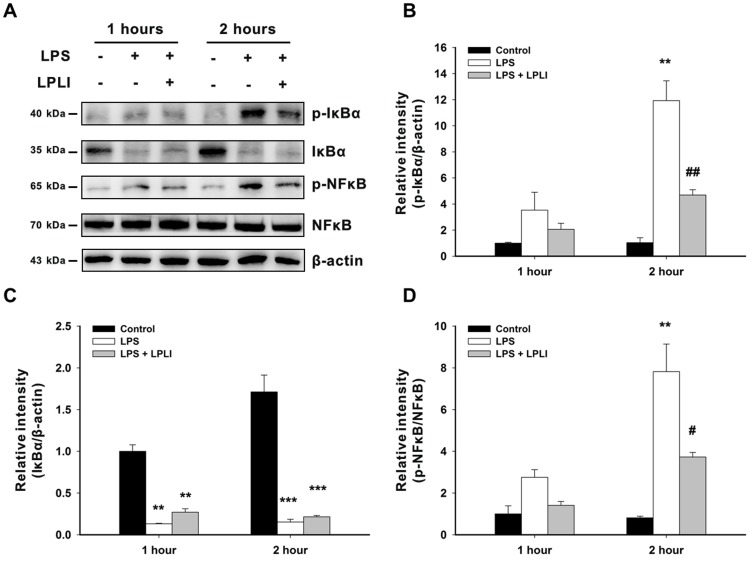
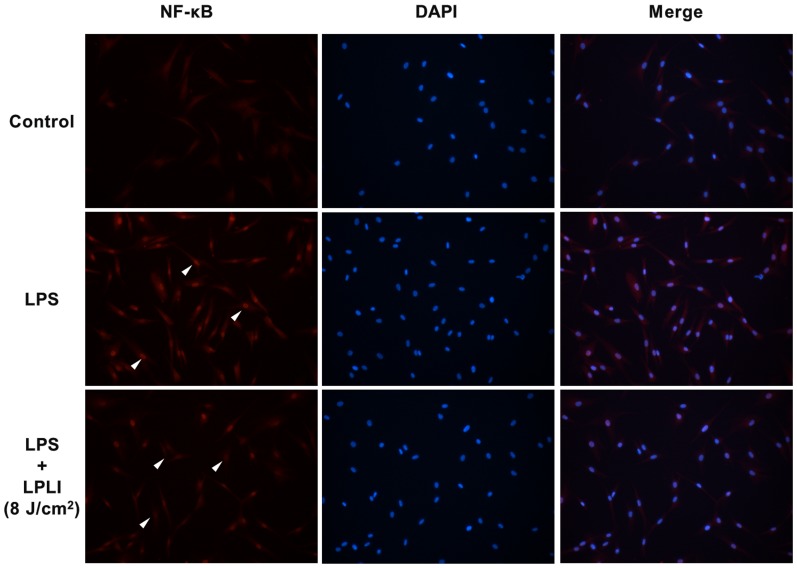
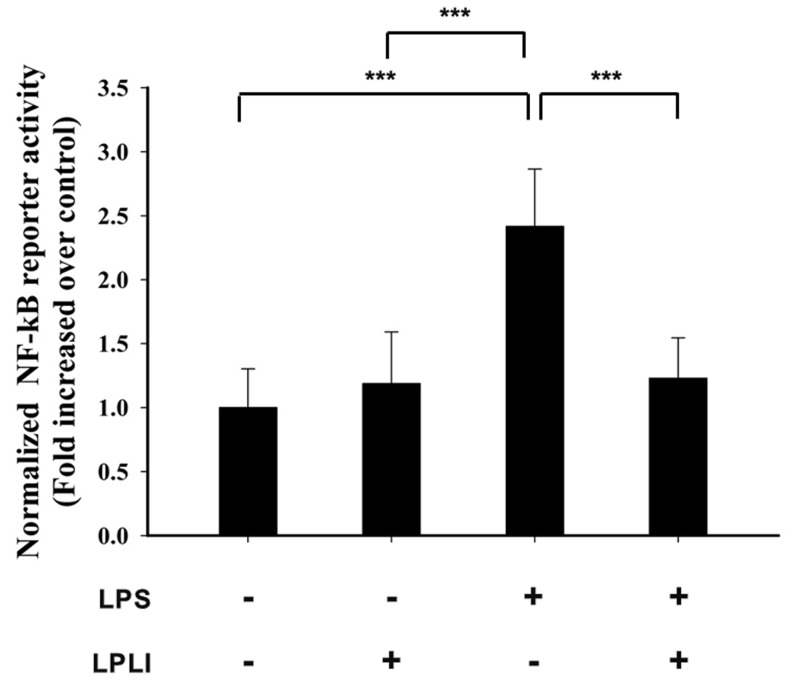
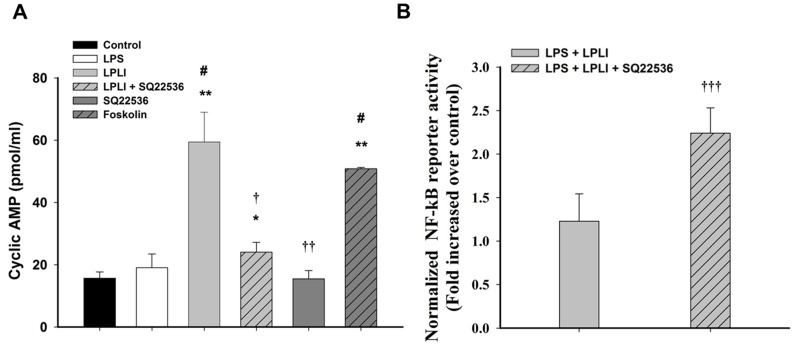
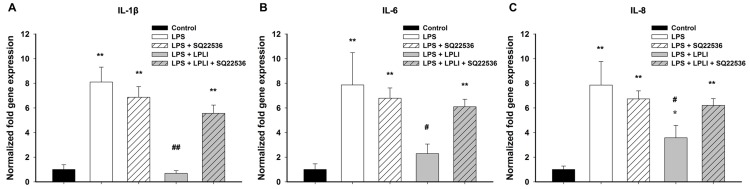
Mesenchymal stem cell (MSC)-based tissue regeneration is a promising therapeutic strategy for treating damaged tissues. However, the inflammatory microenvironment that exists at a local injury site might restrict reconstruction. Low-power laser irradiation (LPLI) has been widely applied to retard the inflammatory reaction. The purpose of this study was to investigate the anti-inflammatory effect of LPLI on human adipose-derived stem cells (hADSCs) in an inflammatory environment. We showed that the hADSCs expressed Toll-like Receptors (TLR) 1, TLR2, TLR3, TLR4, and TLR6 and that lipopolysaccharide (LPS) significantly induced the production of pro-inflammatory cytokines (Cyclooxygenase-2 (Cox-2), Interleukin-1β (IL-1β), Interleukin-6 (IL-6), and Interleukin-8 (IL-8)). LPLI markedly inhibited LPS-induced, pro-inflammatory cytokine expression at an optimal dose of 8 J/cm². The inhibitory effect triggered by LPLI might occur through an increase in the intracellular level of cyclic AMP (cAMP), which acts to down-regulate nuclear factor kappa B (NF-κB) transcriptional activity. These data collectively provide insight for further investigations of the potential application of anti-inflammatory treatment followed by stem cell therapy.


Conflict of interest statement

Competing Interests: The authors have declared that no competing interests exist.

Figures

Figure 1
Figure 1. hADSCs expresses TLRs and stimulated by LPS.
(A) The mRNA expression levels of all TLRs in the hADSCs were compared to the expression levels in U937 cells, as determined by real-time RT-PCR analysis; TLR3 showed a higher mRNA expression level in hADSCs than in U937 cells. (B, C) Determination of the optimal LPS treatment concentration by evaluating the expression of Cox-2 and IL-6 mRNA levels. The data are shown as the mean ± SD (n = 3). The following statistical levels were applied: *p<0.05, **p<0.01, and ***p<0.001 compared to the control.
Figure 2
Figure 2. LPLI suppresses gene expression of pro-inflammatory cytokines by real-time RT-PCR.
(A) Cox-2. (B) IL-1β. (C) IL-6. (D) IL-8. The results were analyzed using the 2−ΔCT method based on the control. The data are shown as the mean ± SD (n = 6). The following statistical levels were applied: *p<0.05 and **p<0.01 compared to the control and #p<0.05 and ##p<0.01 compared to LPS (50 ng/ml).
Figure 3
Figure 3. LPLI inhibits protein secretion of IL-6 and IL-8.
The levels of pro-inflammatory proteins in LPS-stimulated hADSC culture media at 24 hours were determined by ELISA. (A) IL-6. (B) IL-8. The data are shown as the mean ± SD (n = 8). The following statistical levels were applied: **p<0.01 and ***p<0.001 compared to the control and ###p<0.001 compared to LPS (50 ng/ml).
Figure 4
Figure 4. LPLI decreases IκBα degradation and NFκB activation.
(A) hADSCs were treated with or without LPS (50 ng/ml), immediately followed by LPLI (8 J/cm2). After 1 hour and 2 hours, the protein expression of p-IκBα, IκBα, p-NFκB and NFκB was determined using Western blot analysis, and β-actin served as loading control. The blots were quantified, and the results were expressed as ratios compared to LPS (0 ng/ml) at 1 hour, which was defined as 1. (B) p-IκBα vs. β-actin. (C) IκBα vs. β-actin. (D) p-NFκB vs. NFκB. The data are shown as the mean ± SD of 3 independent experiments. The following statistical levels were applied: **p<0.01 and ***p<0.001 compared to the control and #p<0.05 and ##p<0.01 compared to LPS (50 ng/ml).
Figure 5
Figure 5. LPLI decrease nuclear translocation of NF-κB.
hADSCs were pre-treated with or without LPS (50 ng/ml), followed by LPLI (8 J/cm2), and the localization of the NF-κB was determined by fluorescence. The images in the upper panel show the cytoplasmic localization of NF-κB in the control cells. The image in the middle panel shows the nuclear translocation of NF-κB in cells treated with LPS. The image in the lower panel shows that LPLI treatment blocked the nuclear translocation of NF-κB caused by LPS stimulation.
Figure 6
Figure 6. LPLI decreases the transcription activity of NFκB.
hADSCs were transfected with the vectors pGL-NFκB and pTK-Renilla (control vector), and the cells were then incubated with 50 ng/ml LPS with or without LPLI. Luciferase activity was assayed 5 hours after LPLI treatment. The data are expressed as the mean ± SD of 3 independent experiments. The statistical level applied was ***p<0.001.
Figure 7
Figure 7. LPLI increases intracellular cAMP level to suppress NF-κB transcriptional activity.
(A) Intracellular cAMP levels were measured by ELISA in hADSCs treated with LPS, LPLI, SQ22536, and forskolin. (B) NF-κB transcriptional activity was assayed 5 hours after LPLI treatment only and combined pretreatment of SQ22536. The data are expressed as the mean ± SD (n = 6). The following statistical levels were applied: *p<0.05 and **p<0.01 compared to the control, #p<0.05 compared to LPS (50 ng/ml), and †p<0.05, ††p<0.01, and †††p<0.001 compared to LPLI (8 J/cm2).
Figure 8
Figure 8. SQ22536 blocks the anti-inflammatory response of LPLI by real-time RT-PCR.
(A) IL-1β. (B) IL-6. (C) IL-8. The results were analyzed by the 2−ΔCT method based on the control. The data are shown as the mean ± SD (n = 6). The following statistical levels were applied: *p<0.05 and **p<0.01 compared to the control and #p<0.05 and ##p<0.01 compared to LPS (50 ng/ml).

References

    1. Bunnell BA, Flaat M, Gagliardi C, Patel B, Ripoll C (2008) Adipose-derived stem cells: isolation, expansion and differentiation. Methods 45: 115–120. - PMC - PubMed
    1. Zhu Y, Liu T, Song K, Fan X, Ma X, et al. (2008) Adipose-derived stem cell: a better stem cell than BMSC. Cell Biochem Funct 26: 664–675. - PubMed
    1. Garcia-Gomez I, Elvira G, Zapata AG, Lamana ML, Ramirez M, et al. (2010) Mesenchymal stem cells: biological properties and clinical applications. Expert Opin Biol Ther 10: 1453–1468. - PubMed
    1. Crisostomo PR, Wang M, Markel TA, Lahm T, Abarbanell AM, et al. (2007) Stem cell mechanisms and paracrine effects: potential in cardiac surgery. Shock 28: 375–383. - PubMed
    1. Caplan AI (2007) Adult mesenchymal stem cells for tissue engineering versus regenerative medicine. J Cell Physiol 213: 341–347. - PubMed

Publication types