. 2013;8(1):e54166.
doi: 10.1371/journal.pone.0054166. Epub 2013 Jan 14.

Validation of the zebrafish pentylenetetrazol seizure model: locomotor versus electrographic responses to antiepileptic drugs

Affiliations

Validation of the zebrafish pentylenetetrazol seizure model: locomotor versus electrographic responses to antiepileptic drugs

Tatiana Afrikanova et al. PLoS One. 2013.

Abstract

Zebrafish have recently emerged as an attractive in vivo model for epilepsy. Seven-day-old zebrafish larvae exposed to the GABA(A) antagonist pentylenetetrazol (PTZ) exhibit increased locomotor activity, seizure-like behavior, and epileptiform electrographic activity. A previous study showed that 12 out of 13 antiepileptic drugs (AEDs) suppressed PTZ-mediated increases in larval movement, indicating the potential utility of zebrafish as a high-throughput in vivo model for AED discovery. However, a question remained as to whether an AED-induced decrease in locomotion is truly indicative of anticonvulsant activity, as some drugs may impair larval movement through other mechanisms such as general toxicity or sedation. We therefore carried out a study in PTZ-treated zebrafish larvae, to directly compare the ability of AEDs to inhibit seizure-like behavioral manifestations with their capacity to suppress epileptiform electrographic activity. We re-tested the 13 AEDs of which 12 were previously reported to inhibit convulsions in the larval movement tracking assay, administering concentrations that did not, on their own, impair locomotion. In parallel, we carried out open-field recordings on larval brains after treatment with each AED. For the majority of AEDs we obtained the same response in both the behavioral and electrographic assays. Overall our data correlate well with those reported in the literature for acute rodent PTZ tests, indicating that the larval zebrafish brain is more discriminatory than previously thought in its response to AEDs with different modes of action. Our results underscore the validity of using the zebrafish larval locomotor assay as a rapid first-pass screening tool in assessing the anticonvulsant and/or proconvulsant activity of compounds, but also highlight the importance of performing adequate validation when using in vivo models.


Conflict of interest statement

Competing Interests: The authors have declared that no competing interests exist.

Figures

Figure 1
Figure 1. Schematic comparison of the experimental timelines used for the behavioral tracking and EEG assays.
Electrographic recordings (EEG) are depicted in the upper portion, while locomotor tracking is depicted in the lower portion. Treatment parameters, order in which they are applied and the key time-points for each experimental protocol are indicated by the arrows.
Figure 2
Figure 2. Behavioral profile of zebrafish larvae during a one-hour exposure to vehicle or PTZ.
The average movement (y-axis) of vehicle- and 20 mM PTZ-treated larvae are denoted by closed triangles (grey) and closed circles (black) respectively. The mean movement ± SD of 12 larvae is depicted per minute (x-axis) of the tracking session. By 15 min, the frequency of convulsion-like episodes in all larvae reached a rate of one or more per minute, which is reflected in the decrease in SD after this time point.
Figure 3
Figure 3. Behavioral profile of zebrafish larvae to AEDs.
(A) The top graph depicts the average larval locomotor activity within 30 minutes (y-axis) relative to VHC+PTZ (PTZ) control, as depicted by the average % ± SEM; treatment groups where average movement was significantly decreased compared to PTZ (one-way ANOVA) are marked *, **, and *** (p<0.05, p<0.01, and p<0.001, respectively). (B-O) The average total movement (y-axis) of larvae treated with VHC only or PTZ with either VHC or AEDs. The average larval movement is depicted per 5 min interval (x-axis) of the tracking session. Time points when the average movement was significantly decreased compared to PTZ control (repeated measures ANOVA) are marked *, **, and *** (p<0.05, p<0.01, and p<0.001, respectively); standard errors are shown. F values (treatment group-dependent variability): (A) 55.88, (B) 77.26, (C) 144.3, (D) 107.6, (E) 124.7, (F) 65.73, (G) 80.58, (H) 79.56, (I) 70.39, (J) 153.2, (K) 70.29, (L) 80.36, (M) 97.76, (N) 68.3, (O) 137.8. Total number of larvae used are indicated in brackets.
Figure 4
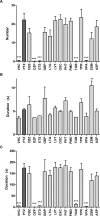
Figure 4. Quantitative analysis of interictal-like electrographic activity in response to AEDs.
(A) Total number of interictal-like events within a 10-min recording (mean±SEM); (B) duration of interictal-like events in seconds within a 10-min recording (mean±SEM). Values that were significantly different from PTZ control were determined using one-way ANOVA with *, ** and *** denoting p<0.05, p<0.01 and p<0.001 respectively. The number of recordings analysed were: VHC (n = 8), PTZ (n = 9), CBZ (n = 8), DZP (n = 8), ETS (n = 9), GBP (n = 8), LTG (n = 8), LVT (n = 8), OXC (n = 8), PHT (n = 8), PMD (n = 8), TGB (n = 8), TPR (n = 8), VPA (n = 8), ZSM (n = 8), ASP (n = 8); F values (treatment group-dependent variability): (A) 4.298, (B) 6.602.
Figure 5
Figure 5. Quantitative analysis of ictal-like electrographic activity in response to AEDs.
(A) Number of ictal-like events within a 10-min recording (mean±SEM); (B) duration of ictal-like events within a 10-min recording (mean±SEM); (C) total cumulative duration of all types of epileptiform activity measured. Values that were significantly different from PTZ control were determined using the one-way ANOVA with *, ** and *** denoting p<0.05, p<0.01 and p<0.001 respectively. The number of recordings analysed were: VHC (n = 8), PTZ (n = 9), CBZ (n = 8), DZP (n = 8), ETS (n = 9), GBP (n = 8), LTG (n = 8), LVT (n = 8), OXC (n = 8), PHT (n = 8), PMD (n = 8), TGB (n = 8), TPR (n = 8), VPA (n = 8), ZSM (n = 8), ASP (n = 8). F values (treatment group-dependent variability): (A) 13.45, (B) 3.056, (C) 11.41.
Figure 6
Figure 6. Electrographic activity in zebrafish optic tecta: fragments of representative recordings.
(A) Vehicle only; (B – P) 20 mM PTZ with the following pre-treatment: (B) VHC; (C) CBZ; (D) DZP; (E) ETS; (F) GBP; (G) LTG; (H) LVT; (I) OXC; (J) PHT; (K) PMD; (L) TGB; (M) TPR; (N) VPA; (O) ZSM; (P) ASP. Recordings were performed in current clamp mode, low-pass filtered at 1 kHz, high-pass filtered 0.1 Hz, digital gain 10, sampling interval 10 µs.

References

    1. Thurman DJ, Beghi E, Begley CE, Berg AT, Buchhalter JR, et al. (2011) Standards for epidemiologic studies and surveillance of epilepsy. Epilepsia 52: 2–26. - PubMed
    1. Romanelli P, Striano P, Barbarisi M, Coppola G, Anschel DJ (2012) Non-resective surgery and radiosurgery for treatment of drug-resistant epilepsy. Epilepsy research. doi: 10.1016/j.eplepsyres.2011.12.016. - PubMed
    1. Löscher W (2011) Critical review of current animal models of seizures and epilepsy used in the discovery and development of new antiepileptic drugs. Seizure 20: 359–368. - PubMed
    1. Watanabe Y, Takechi K, Fujiwara A, Kamei C (2010) Effects of antiepileptics on behavioral and electroencephalographic seizure induced by pentetrazol in mice. Journal of Pharmacological Sciences 112: 282–289. - PubMed
    1. Baraban SC, Taylor MR, Castro PA, Baier H (2005) Pentylenetetrazole induced changes in zebrafish behavior, neural activity and c-fos expression. Neuroscience 131: 759–768. - PubMed