. 2013;8(1):e54251.
doi: 10.1371/journal.pone.0054251. Epub 2013 Jan 16.

The role of hypoxia-inducible factor 1α in determining the properties of castrate-resistant prostate cancers

Affiliations

The role of hypoxia-inducible factor 1α in determining the properties of castrate-resistant prostate cancers

Weranja K B Ranasinghe et al. PLoS One. 2013.

Abstract

Background: Castrate-resistant prostate cancer (CRPC) is a lethal condition in patients receiving androgen deprivation therapy for prostate cancer (PC). Despite numerous studies showing the expression of HIF1α protein under normoxia in PC cell lines, the role of this normoxic HIF1α expression in chemo-resistance and migration has not been investigated previously. As no method is currently available to determine which tumors will progress to CRPC, the role of HIF1α in PC and its potential for predicting the development of CRPC was also investigated.

Methods: The effect of HIF1α protein knockdown on chemo-resistance and migration of PC3 cells was assessed by cell counting and Transwell assays, respectively. Translation efficiency of HIF1α mRNA was determined in PC cells using a HIF1α 5'UTR-luciferase construct. Clinical outcomes were correlated following the staining of 100 prostate tumors for HIF1α expression.

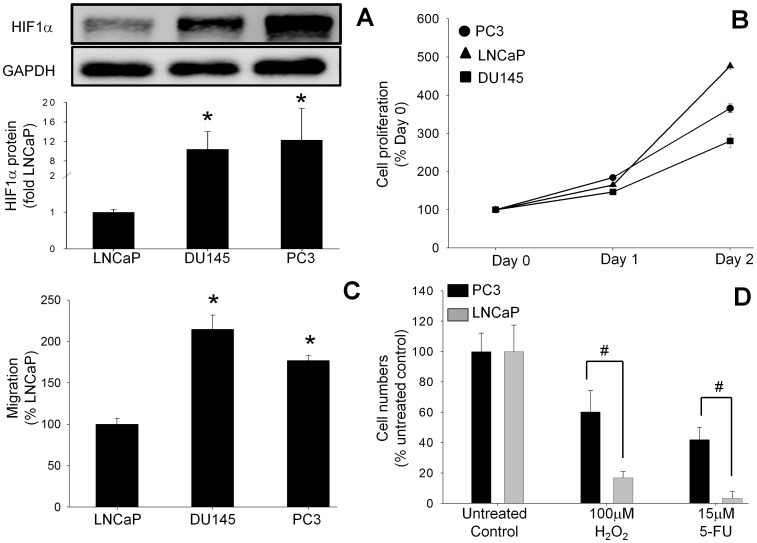
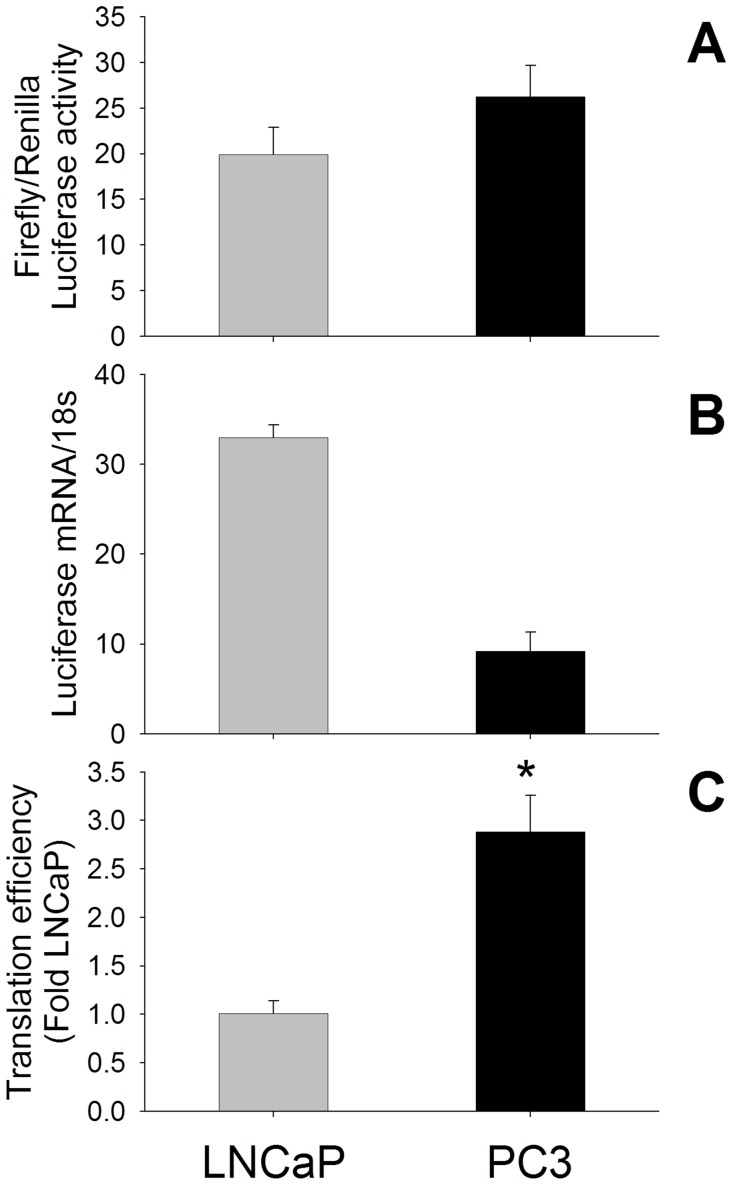
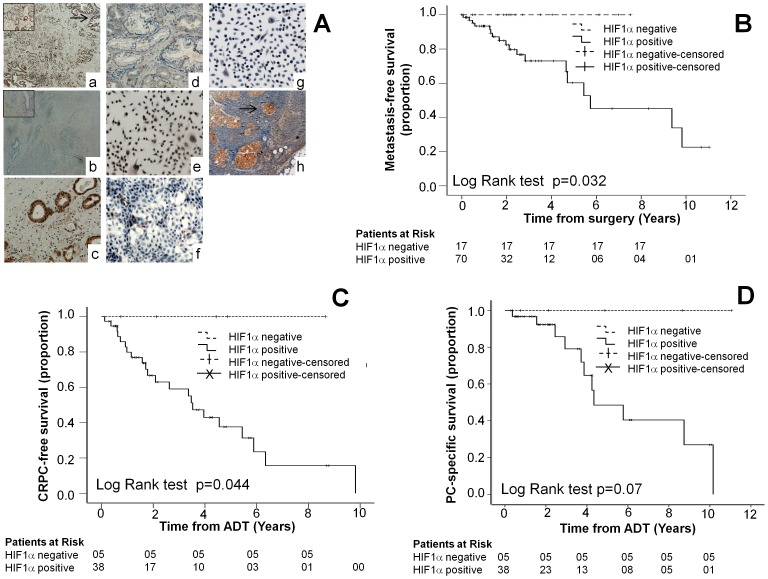
Results: The CRPC-like cell lines (PC3 and DU145) expressed more HIF1α protein than an androgen sensitive cell line (LNCaP). Migration rate and chemo-resistance were higher in the PC3 cells and both were decreased when HIF1α expression was reduced. Increased translation of HIF1α mRNA may be responsible for HIF1α overexpression in PC3 cells. Patients whose tumors expressed HIF1α had significantly decreased metastasis-free survival and the patients who were on androgen-deprivation therapy had decreased CRPC-free survival on Kaplan-Meier analysis. On multivariate analysis HIF1α was an independent risk factor for progression to metastatic PC (Hazard ratio (HR) 9.8, p = 0.017) and development of CRPC (HR 10.0, p = 0.021) in patients on androgen-deprivation therapy. Notably the tumors which did not express HIF1α did not metastasize or develop CRPC.

Conclusions: HIF1α is likely to contribute to metastasis and chemo-resistance of CRPC and targeted reduction of HIF1α may increase the responsiveness of CRPCs to chemotherapy. Expression of HIF1α may be a useful screening tool for development of CRPC.


Conflict of interest statement

Competing Interests: The authors have declared that no competing interests exist.

Figures

Figure 1
Figure 1. Basal HIF1α protein expression, proliferation rates and migration/invasion rates in human PC cell lines. (
A) Basal HIF1α protein concentrations in the human PC cell lines LNCaP, DU145 and PC3 under normoxic conditions were analyzed by Western blot. (B) Proliferation was assayed by cell counting after 24 and 48 hours. (C) Migration/invasion rates were measured by Transwell assays at 24 hours. Values in (A) and (C) are expressed as the fold increase compared to LNCaP cells, while the values in (B) are expressed as a percentage of the time 0 value. All values are the mean ± SEM of at least three separate treatments. (D) Survival rates of PC cells exposed to cytotoxic conditions. The survival of PC3 cells (which have higher basal HIF1α protein) when exposed to oxidative stress with hydrogen peroxide (H2O2) or chemotoxicity with 5-fluorouracil (5-FU) was compared to the survival of LNCaP cells (which have lower HIF1α expression). Survival was assessed by counting cell numbers at 24 hours. Values are expressed as a percentage of the untreated control and are the mean ± SEM of at least three separate treatments. #, P<0.05 versus treated LNCaP cells.
Figure 2
Figure 2. Knockdown of HIF1α expression in PC3 cells reduced both survival after cytotoxic treatments and migration rate.
(A) HIF1α concentrations were reduced in 2 separate clones of PC3 cells following stable expression of HIF1α shRNA as assessed by Western blot. Values are the mean ± SEM of at least three separate experiments and are expressed as a percentage of wild-type PC3 cells. *, P<0.05 versus wild-type PC3 cells. (B) The survival of PC3 cells after exposure to oxidative stress (hydrogen peroxide (H2O2)) or chemotoxicity (5-fluorouracil (5-FU) for 24 hours was reduced following HIF1α knockdown compared to scrambled control vector-transfected PC3 cells. Values are the mean ± SEM of at least three separate experiments and are expressed as a percentage of untreated scrambled control vector-transfected PC3 cells. #, P<0.05 versus control. (C) HIF1α protein expression in PC3 cells transfected with control shRNA after treatment with 1% O2, 300 µM CoCl2, 100 µM H2O2, and 15 µM 5-FU. Cell lysates were electrophoresed on SDS-polyacrylamide gels and blotted with HIF1α antibody. GAPDH expression was used as loading control. The Western blots shown are representative of at least three separate experiments. Band densities were determined by densitometric analysis of HIF1α/GAPDH and are presented relative to the value for untreated cells. Data represent mean ± SEM; * p<0.05 vs. untreated PC3 cells. (D) Rates of migration/invasion in the HIF1α knockdown PC3 cells were reduced compared to the scrambled control vector-transfected PC3 cells as assessed by Transwell assay. Values are the mean ± SEM of at least three separate experiments and are expressed as a percentage of untreated scrambled control vector transfected PC3 cells. *, P<0.05 versus control. (E) Induction of HIF1α in LNCaP cells by hypoxia (dark grey bars) or by cobalt chloride (light grey bars) increased survival after exposure to oxidative stress with H2O2 or chemotoxicity with 5-FU for 24 hours when compared to control LNCaP cells (black bars). Values are the mean ± SEM of at least three separate treatments and are expressed as a percentage of the untreated LNCaP control. #, P<0.05 versus treated LNCaP cells. *, P<0.05 versus LNCaP cells treated with 1% O2 and 5-FU. (F) HIF1α protein expression in LNCaP cells treated with 1% O2 and 300 µM CoCl2 in combination with either 100 µM H2O2 or 15 µM 5-FU. Cell lysates were electrophoresed on SDS-polyacrylamide gels and blotted with HIF1α antibody. GAPDH expression was used as loading control. The Western blots shown are representative of at least three separate experiments. Band densities were determined by densitometric analysis of HIF1α/GAPDH and are presented relative to the value for normoxic cells undergoing the same treatment. Data represent mean ± SEM; * p<0.05 vs. untreated control, 100 µM H2O2 or 15 µM 5-FU treated LNCaP cells.
Figure 3
Figure 3. The translation efficiency of the HIF1α 5′UTR-luciferase reporter in prostate cancer cells.
(A) Firefly and Renilla luciferase activities in prostate cancer cells following transfection of a HIF1α 5′UTR-luciferase construct and the pTK-Renilla control reporter vector were determined using a dual luciferase assay. (B) Real-time PCR (RT-PCR) analysis of luciferase mRNA in PC cells transfected with the HIF1α 5′UTR-luciferase construct. Following transfection, RNA was isolated, and luciferase mRNA expression detected by real time RT-PCR and normalized by 18S mRNA expression. (C) Translational efficiency represents the ratio of Firefly/Renilla luciferase activity, divided by the relative luciferase mRNA concentration in PC cells. The translational efficiency of luciferase mRNA driven by the 5′UTR region of HIF1α in PC3 cells is higher than in LNCaP cells. Values are the mean ± SEM of at least three separate experiments. *, P<0.05 versus treated LNCaP cells.
Figure 4
Figure 4. Kaplan–Meier Estimates of CRPC-free survival, metastasis-free survival and prostate cancer specific survival in patients.
(A) Representative immunohistochemistry results showing expression of HIF1α in prostate cancer specimens and cell lines. Positive (Aa) and negative (Ab) staining for HIF1α was observed in two typical tumors with Gleason score 9 (Inset box, X20 view). Positive (Ac) and negative (Ad) staining was also observed in two typical tumors with Gleason score 6. Positive staining in PC3 cells (Ae) and negative staining in LNCaP cells (Af) and in HIF1α knockdown PC3 cells (Ag) demonstrated the specificity of the HIF1α antibody. Additionally, HIF1α was expressed throughout the tumor with increased expression in the main prostatic glands (indicated by the arrow in Aa) and in lymph node metastases (indicated by the arrow in Ah). (B) The Kaplan–Meier survival curve demonstrates the metastasis–free survival versus the time from surgery. (C) The Kaplan–Meier survival curve demonstrates the CRPC- free survival versus the time from the start of androgen deprivation therapy. (D) The Kaplan–Meier survival curve demonstrates the prostate cancer specific survival versus the time from the start of androgen deprivation therapy. None of the HIF1α negative patients had any of the adverse outcomes in (B), (C) or (D). Outcome was analyzed by Log Rank (Mantel – Cox) tests.

References

    1. Ellem SJ, Risbridger GP (2007) Treating prostate cancer: a rationale for targeting local oestrogens. Nat Rev Cancer 7: 621–627. - PubMed
    1. Kirby M, Hirst C, Crawford ED (2011) Characterising the castration-resistant prostate cancer population: a systematic review. Int J Clin Pract 65: 1180–1192. - PubMed
    1. Berruti A, Mosca A, Porpiglia F, Bollito E, Tucci M, et al.. (2007) Chromogranin A expression in patients with hormone naive prostate cancer predicts the development of hormone refractory disease. J Urol 178: 838–843; quiz 1129. - PubMed
    1. Beltran H, Beer TM, Carducci MA, de Bono J, Gleave M, et al. (2011) New therapies for castration-resistant prostate cancer: efficacy and safety. Eur Urol 60: 279–290. - PubMed
    1. Alimirah F, Chen J, Basrawala Z, Xin H, Choubey D (2006) DU-145 and PC-3 human prostate cancer cell lines express androgen receptor: implications for the androgen receptor functions and regulation. FEBS Lett 580: 2294–2300. - PubMed

Publication types

MeSH terms

Substances