

Prediction of contact residue pairs based on co-substitution between sites in protein structures
- PMID: 23342110
- PMCID: PMC3546969
- DOI: 10.1371/journal.pone.0054252
Prediction of contact residue pairs based on co-substitution between sites in protein structures
Abstract
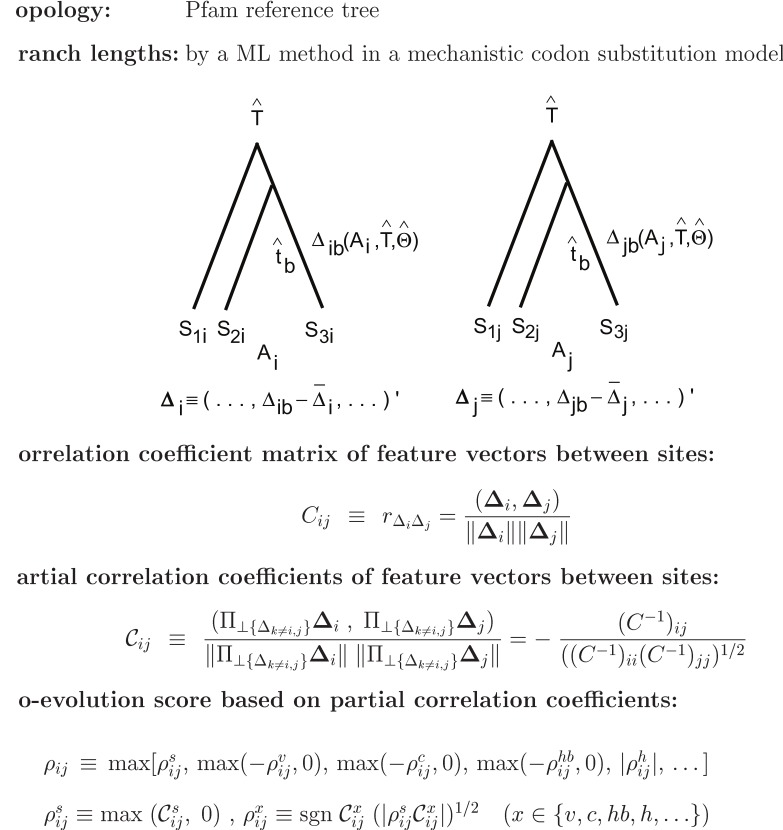
Residue-residue interactions that fold a protein into a unique three-dimensional structure and make it play a specific function impose structural and functional constraints in varying degrees on each residue site. Selective constraints on residue sites are recorded in amino acid orders in homologous sequences and also in the evolutionary trace of amino acid substitutions. A challenge is to extract direct dependences between residue sites by removing phylogenetic correlations and indirect dependences through other residues within a protein or even through other molecules. Rapid growth of protein families with unknown folds requires an accurate de novo prediction method for protein structure. Recent attempts of disentangling direct from indirect dependences of amino acid types between residue positions in multiple sequence alignments have revealed that inferred residue-residue proximities can be sufficient information to predict a protein fold without the use of known three-dimensional structures. Here, we propose an alternative method of inferring coevolving site pairs from concurrent and compensatory substitutions between sites in each branch of a phylogenetic tree. Substitution probability and physico-chemical changes (volume, charge, hydrogen-bonding capability, and others) accompanied by substitutions at each site in each branch of a phylogenetic tree are estimated with the likelihood of each substitution, and their direct correlations between sites are used to detect concurrent and compensatory substitutions. In order to extract direct dependences between sites, partial correlation coefficients of the characteristic changes along branches between sites, in which linear multiple dependences on feature vectors at other sites are removed, are calculated and used to rank coevolving site pairs. Accuracy of contact prediction based on the present coevolution score is comparable to that achieved by a maximum entropy model of protein sequences for 15 protein families taken from the Pfam release 26.0. Besides, this excellent accuracy indicates that compensatory substitutions are significant in protein evolution.
Conflict of interest statement
Figures
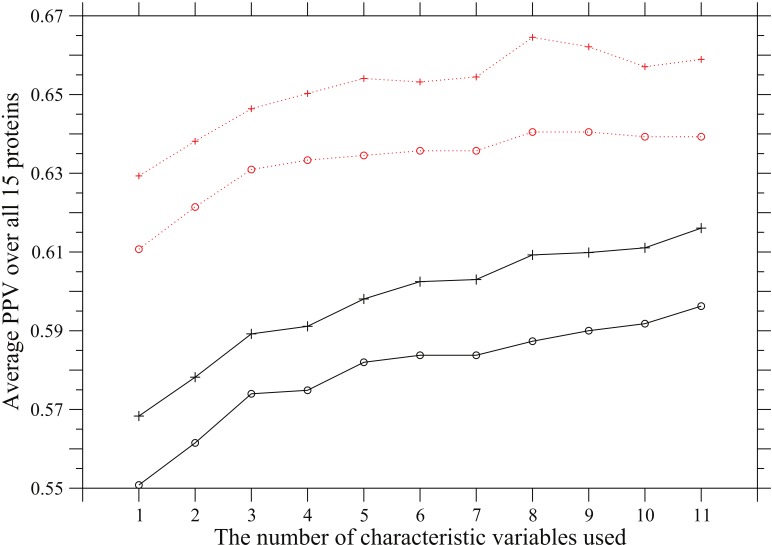
 propensity listed in Table 4 are added in the listed order to define an overall coevolution score; that is, (1) occurrence of amino acid substitution, (2) side-chain volume, (3) charge, (4) hydrogen-bonding capability, (5) hydrophobicity, (6)
  and (7) turn propensities, (8) aromatic interaction, (9) branched side-chain, (10) cross-link capability, and (11) ionic side-chain. The solid and dotted lines correspond to predictions in which the ratio of the predicted to the true contacts is equal to
  or
or  , respectively. The plus marks and open circles show the averages of PPV over all 15 proteins and the values of
  , where the sum is taken over all 15 proteins.
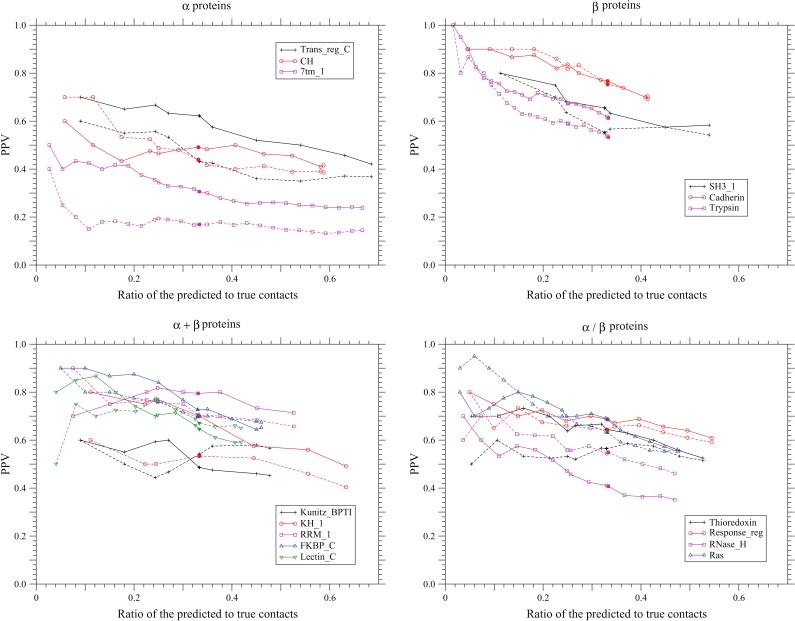
 ,
,  ,
,  , and
, and  . The solid and dotted lines show the PPVs of the present method and the method based on the DI score , respectively. Only the conservation filter is applied for the DI score. The total number of predicted site pairs is shown in the scale of the ratio of the number of predicted site pairs to the number of true contacts. The total number of predicted site pairs takes every 10 from 10 to a sequence length; also PPVs for the numbers of predicted site pairs equal to one fourth or one third of true contacts are plotted. The filled marks indicate the points corresponding to the number of predicted site pairs equal to one third of the number of true contacts. The number of sequences used here for each protein family is one listed in Table 1.
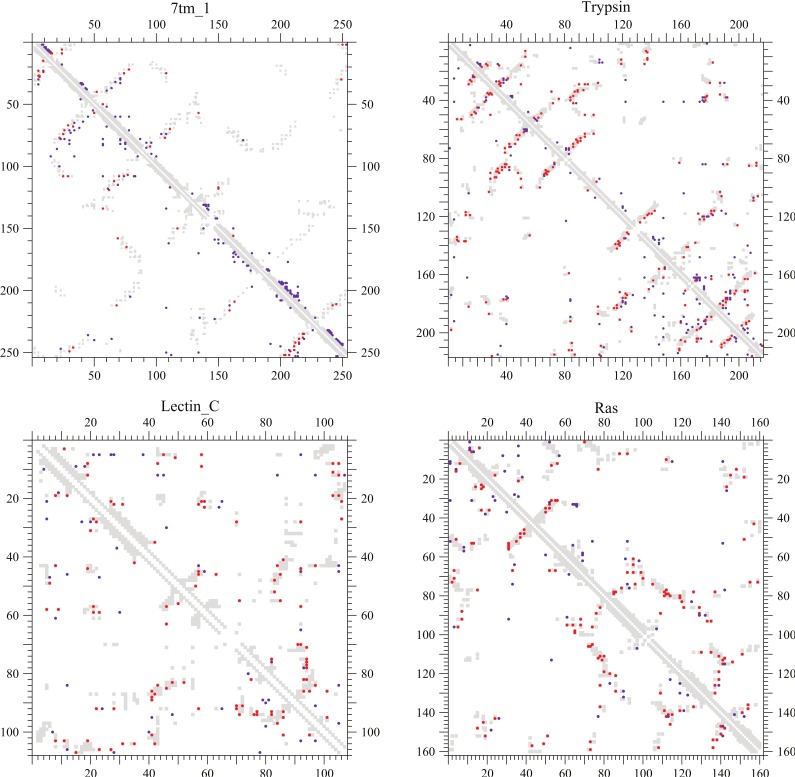
 ) in a sequence may be shown with the gray filled-squares but are excluded as well as nearest neighbors in both the predictions. The total numbers of coevolving site pairs and DI residue pairs plotted for each protein are both equal to one third of true contacts (
 ). The PPVs of both the methods for each protein are listed in Table 5.
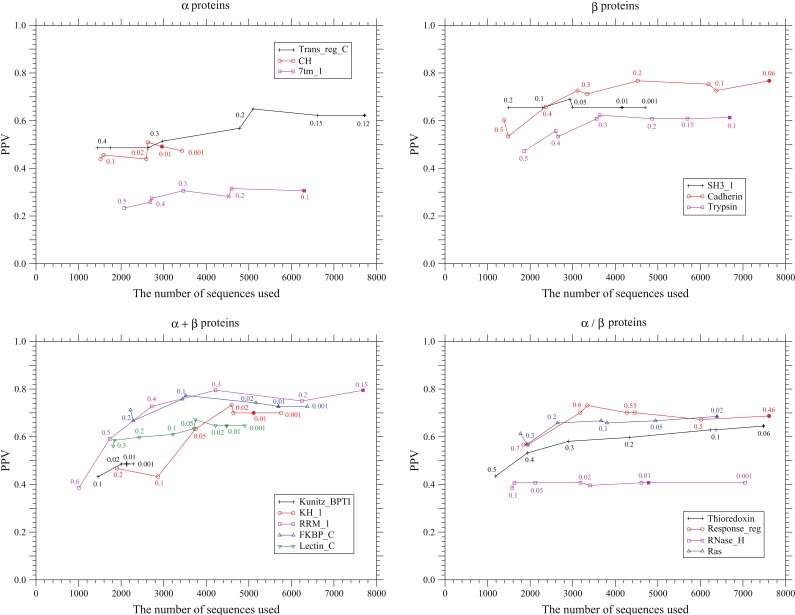
 ; OTUs connected to their parent nodes with branches shorter than this threshold value are removed in the Pfam reference tree of the Pfam full sequences used for each prediction. Some data points correspond to datasets generated by using the same value of the threshold but by removing different OTUs.
References
-
- Yanovsky C, Horn V, Thorpe D (1964) Protein structure relationships revealed by mutation analysis. Science 146: : 1593–1594. - PubMed
-
- Fitch WM, Markowitz E (1970) An improved method for determining codon variability in a gene and its application to the rate of fixation of mutations in evolution. Biochem Genet 4: 579–593. - PubMed
-
- Bazykin G, Kondrashov F, Ogurtsov A, Sunyaev S, Kondrashov A (2004) Positive selection at sites of multiple amino acid replacements since rat-mouse divergence. Nature 429: 558–562. - PubMed
-
- Maisnier-Patin S, Andersson DI (2004) Adaptation to the deleterious effect of antimicrobial drug resistance mutations by compensatory evolution. Research in Microbiology 155: 360–369. - PubMed
-
- Tufféry P, Darlu P (2000) Exploring a phylogenetic approach for the detection of correlated substitutions in proteins. Mol Biol Evol 17: 1753–1759. - PubMed
MeSH terms
Substances
LinkOut - more resources
Full Text Sources
Other Literature Sources
